 Open Access Article
Determination of the structure and morphology of gold nanoparticle–HSA protein complexes†
Robin
Capomaccio
ab,
Isaac
Ojea Jimenez
a,
Pascal
Colpo
a,
Douglas
Gilliland
a,
Giacomo
Ceccone
a,
François
Rossi
a and
Luigi
Calzolai
*a
aEuropean Commission, Joint Research Centre, Institute for Health and Consumer Protection, I-21027, Ispra, VA, Italy. E-mail: luigi.calzolai@jrc.ec.europa.eu
bInstitut de Biologie et Chimie des Protéines, BMSSI-UMR 5086, Université Lyon 1, Université de Lyon, 69367 Lyon, France
First published on 14th October 2015
Abstract
We propose a simple method to determine the structure and morphology of nanoparticle protein complexes. By combining a separation method with online size measurements, density measurements and circular dichroism, we could identify the number of proteins bound to each nanoparticle and their secondary structure changes in the complex. This method provides much-needed experimental information on the interaction of proteins with nanoparticles and on the behavior of nanoparticles in biological systems.
The structure and morphology of nanoparticle–protein complexes are important to understand the behavior of nanoparticles in biological systems and would help in the development of advanced nanomedicine.1–7 Existing techniques can give information on changes in size (ultracentrifugation,8 centrifugal particle sedimentation,9 and light scattering-based methods10,11) or on the ligands or proteins interacting with nanoparticles (by using CD,12 NMR13,14 or fluorescence correlation spectroscopy).15,16 But there is a lack of robust methods to determine the overall morphology and structure of NP–protein complexes. Here we show that by combining a separation technique with online size measurements, together with density measurements and circular dichroism, we could identify the number of proteins bound to each gold nanoparticle (AuNP) and their secondary structure changes in the AuNP–protein complex. This method reveals the overall morphology of the NP–protein complex directly in solution.
Citrate stabilized gold nanoparticles were synthesized in house (see the ESI† for complete Experimental details) to provide well monodispersed suspensions. The mean size and particle size distribution (PSD) were measured by electron microscopy (EM) and dynamic light scattering (DLS) (see Fig. S1 and S2, ESI†) leading to a diameter of 14.0 nm by EM and a hydrodynamic diameter of 17.8 nm (and a polydispersity of 0.070) by DLS. When AuNPs are mixed with an excess of human serum albumin (HSA, a 66 kDa protein) there are two types of particles in solution: unbound HSA proteins and AuNP–HSA complexes. Due to their difference in size the free protein and the AuNP–HSA complex can be separated by asymmetric flow field flow fractionation (AF4),17,18 a size-separation technique able to accurately separate complex polydispersed samples.19 Compared to Size Exclusion Chromatography (SEC), AF4 provides a broader dynamic range of size separation that is particularly useful for the size separation of NP–protein complexes and free proteins.
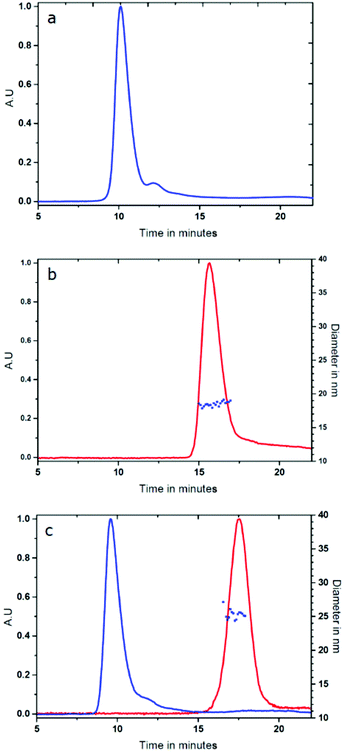
Fig. 1c shows the AF4 fractogram of the AuNP/HSA sample where the peaks of free HSA and the AuNP–HSA complex can be readily and selectively identified using the protein autofluorescence emission at 340 nm (upon excitation at 280 nm for the protein) and the absorbance at 525 nm (specific for the localized surface resonance band of AuNPs).
The second peak, belonging to the AuNP–HSA complex, has a longer exit time in the AF4 separation channel compared to the free AuNP (17 min vs. 16 min) indicating that the complex has a larger size than the free AuNP. The increased size can be accurately measured by coupling the DLS online to the AF4 separation system. The data in Fig. 1b and c (blue squares) show that the hydrodynamic diameter increases from 18.5 nm (for the free AuNP) to 24.4 nm for the complex when AuNPs are mixed with HSA in 1![[thin space (1/6-em)]](https://www.rsc.org/images/entities/char_2009.gif) :
:![[thin space (1/6-em)]](https://www.rsc.org/images/entities/char_2009.gif) 400 ratio.
400 ratio.
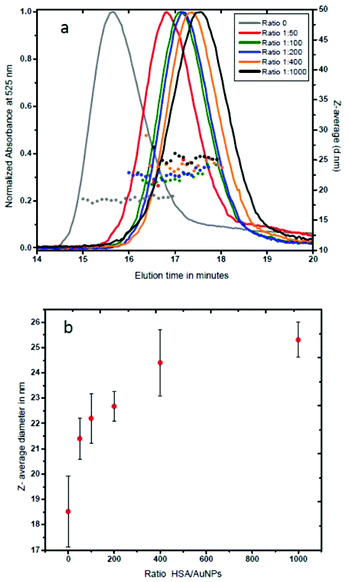
In order to analyze the effect of the nanoparticle–protein ratio on the size and overall morphology of the AuNP–HSA complex, we have performed similar experiments at various AuNP–HSA ratios. Fig. 2a shows that the retention time in the AF4 channel increases as the amount of protein per gold nanoparticle increases. The results (Fig. 2b) show a size of 21.4 nm for the 1![[thin space (1/6-em)]](https://www.rsc.org/images/entities/char_2009.gif) :
:![[thin space (1/6-em)]](https://www.rsc.org/images/entities/char_2009.gif) 50 ratio, 22.2 nm for the 1
50 ratio, 22.2 nm for the 1![[thin space (1/6-em)]](https://www.rsc.org/images/entities/char_2009.gif) :
:![[thin space (1/6-em)]](https://www.rsc.org/images/entities/char_2009.gif) 100 ratio, 22.7 nm for the 1
100 ratio, 22.7 nm for the 1![[thin space (1/6-em)]](https://www.rsc.org/images/entities/char_2009.gif) :
:![[thin space (1/6-em)]](https://www.rsc.org/images/entities/char_2009.gif) 200 ratio, 24.4 nm for 1
200 ratio, 24.4 nm for 1![[thin space (1/6-em)]](https://www.rsc.org/images/entities/char_2009.gif) :
:![[thin space (1/6-em)]](https://www.rsc.org/images/entities/char_2009.gif) 400, and 25.3 nm for the 1
400, and 25.3 nm for the 1![[thin space (1/6-em)]](https://www.rsc.org/images/entities/char_2009.gif) :
:![[thin space (1/6-em)]](https://www.rsc.org/images/entities/char_2009.gif) 1000 ratio.
1000 ratio.
These results indicate a saturation-type behaviour (Fig. 2b) and suggest that at saturation, human serum albumin forms a protein monolayer around gold nanoparticles to produce stable AuNP–protein complexes. It also indicates that the hydrodynamic diameter of AuNP–HSA complexes increases with the increase of protein molecules per gold nanoparticle. At saturation, HSA molecules form a monolayer of 3.4 nm in thickness around each nanoparticle. Similar values (3.5 nm) have been found in the case of HSA forming a protein corona around the FePt nanoparticles as measured by fluorescence correlation spectroscopy.15
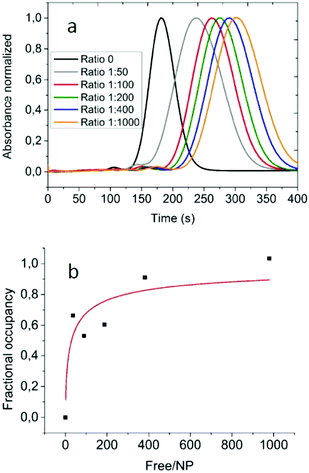
The size of the complexes could allow formulating some qualitative hypothesis on the nature of the protein corona, but in order to develop a robust experimental approach we recorded differential centrifugal sedimentation (DCS) data of the various AuNP–protein samples. The time needed by each particle to reach the detector under the centrifugal field in DCS is a function of the hydrodynamic diameter and the density of the particle. Combining these measurements with the accurate size of the AuNP–HSA complexes obtained by AF4-DLS allows determination of the apparent density of the complexes at the different NP–protein ratios. Fig. 3a shows that the various AuNP–HSA samples reach the detector at longer times compared to the free AuNP. By inserting the diameter measured using the AF4-DLS system (that provides accurate sizes due to the size-separation step of AF4 ensuring that monodispersed particle populations are measured by the online DLS, see the ESI† for Experimental details) into eqn (SI-2†) we could calculate the apparent densities of the complexes. The data analysis gave densities varying from 9.6 g cm−3 for the free AuNPs, to 6.9 g cm−3 for the 1![[thin space (1/6-em)]](https://www.rsc.org/images/entities/char_2009.gif) :
:![[thin space (1/6-em)]](https://www.rsc.org/images/entities/char_2009.gif) 50 ratio and 4.6 g cm−3 at saturation for the 1
50 ratio and 4.6 g cm−3 at saturation for the 1![[thin space (1/6-em)]](https://www.rsc.org/images/entities/char_2009.gif) :
:![[thin space (1/6-em)]](https://www.rsc.org/images/entities/char_2009.gif) 1000 ratio (see the ESI†). The somewhat surprising data for the free gold nanoparticles (compared to the 19.3 g cm−3 value for the bulk gold) can be explained by the presence of the citrate and water layer on the AuNP surface, and the overall effect on the particle density is quite high due to the small size of the nanoparticles. Previous analysis of small AuNPs with ultracentrifugation measurements has found a density of 12.5 g cm−3 for AuNPs of 20.3 nm.20
1000 ratio (see the ESI†). The somewhat surprising data for the free gold nanoparticles (compared to the 19.3 g cm−3 value for the bulk gold) can be explained by the presence of the citrate and water layer on the AuNP surface, and the overall effect on the particle density is quite high due to the small size of the nanoparticles. Previous analysis of small AuNPs with ultracentrifugation measurements has found a density of 12.5 g cm−3 for AuNPs of 20.3 nm.20
Combining all the experimental results (the density of the AuNP–protein complexes, together with their hydrodynamic diameter and the diameter of the core gold nanoparticles) it is possible to derive (see the ESI†) the mass of the protein layer surrounding the gold core of the complex and thus to estimate the average number of proteins present in each AuNP–HSA complex. The number of HSA molecules bound to each AuNP depends on the initial NP–protein ratio (Fig. 3b): it starts from a minimum of 13 for the 1![[thin space (1/6-em)]](https://www.rsc.org/images/entities/char_2009.gif) :
:![[thin space (1/6-em)]](https://www.rsc.org/images/entities/char_2009.gif) 50 ratio and increases up to 20 proteins for the 1
50 ratio and increases up to 20 proteins for the 1![[thin space (1/6-em)]](https://www.rsc.org/images/entities/char_2009.gif) :
:![[thin space (1/6-em)]](https://www.rsc.org/images/entities/char_2009.gif) 1000 ratio. Considering the surface area of one gold nanoparticle and the foot print of each HSA molecule, a single monolayer could contain a maximum of between 20 and 35 molecules based on their binding orientation on the gold nanoparticle surface.21 The number of bound proteins per NP is clearly an average value, as it is safe to assume that in solution there will be a distribution in the number of bound HSA molecules to each nanoparticle for the different initial NP–protein ratios.
1000 ratio. Considering the surface area of one gold nanoparticle and the foot print of each HSA molecule, a single monolayer could contain a maximum of between 20 and 35 molecules based on their binding orientation on the gold nanoparticle surface.21 The number of bound proteins per NP is clearly an average value, as it is safe to assume that in solution there will be a distribution in the number of bound HSA molecules to each nanoparticle for the different initial NP–protein ratios.
The experimental data can be fitted with a Hill-type equation:
| θ = 1/(1 + (K/L)n). |
Fig. 3b shows the fractional occupancy of HSA sites (at saturation, 20 bound HSA molecules per NP) per AuNP as a function of unbound proteins in solution. The best fit of the data with the Hill equation (Fig. 3b, red curve) indicates that 50% of full coverage is reached when in solution there are around 35 unbound proteins per NP. The Hill coefficient of 0.6 suggests an anti-cooperative binding of HSA to gold-NPs. A similar anti-cooperative behavior of HSA has been previously shown for the binding to FePt and quantum dot nanoparticles.15,16,22
The non-disruptive nature of the AF4-DLS technique allows recovering samples after their size separation with a simple fraction collector for further characterization. We have thus separated the AuNP-bound HSA from the unbound protein by collecting the AF4-separated peak shown in Fig. 1c (in red, NP–protein ratio 1![[thin space (1/6-em)]](https://www.rsc.org/images/entities/char_2009.gif) :
:![[thin space (1/6-em)]](https://www.rsc.org/images/entities/char_2009.gif) 400). Using circular dichroism, we were able to acquire the CD spectra of the HSA bound protein and to monitor the changes of its secondary structure upon binding with AuNPs (Fig. 4).
400). Using circular dichroism, we were able to acquire the CD spectra of the HSA bound protein and to monitor the changes of its secondary structure upon binding with AuNPs (Fig. 4).
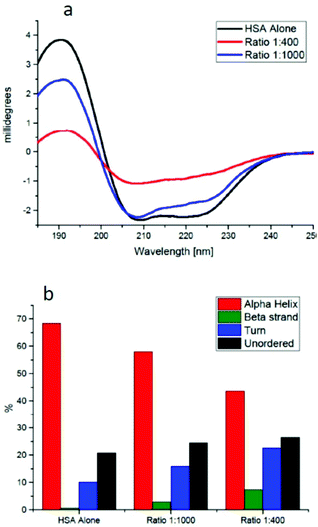
The CD spectra of HSA (Fig. 4a) show a clear change for the AuNP-bound protein in the far UV region between 200 and 240 nm, sensitive to the secondary structure elements present in the protein. A more detailed analysis of the two spectra using deconvolution software23 allows estimating the percentage of secondary structure elements present in each CD spectrum. The data, reported in Fig. 4b, clearly show that there is a reduction of around 10% in the α-helical content for the 1![[thin space (1/6-em)]](https://www.rsc.org/images/entities/char_2009.gif) :
:![[thin space (1/6-em)]](https://www.rsc.org/images/entities/char_2009.gif) 1000 AuNP–HSA complex and of around 30% for the 1
1000 AuNP–HSA complex and of around 30% for the 1![[thin space (1/6-em)]](https://www.rsc.org/images/entities/char_2009.gif) :
:![[thin space (1/6-em)]](https://www.rsc.org/images/entities/char_2009.gif) 400 complex.
400 complex.
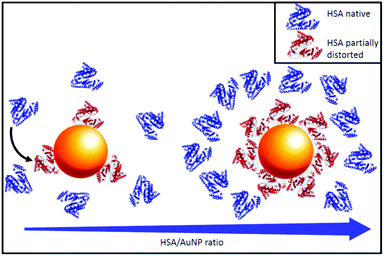
All these data suggest a model for the morphology of the AuNP–HSA complexes as a function of the AuNP–HSA ratio. At low ratios, the AuNP surface is not saturated by HSA molecules, 50% saturation is reached at an NP–protein ratio of around 1![[thin space (1/6-em)]](https://www.rsc.org/images/entities/char_2009.gif) :
:![[thin space (1/6-em)]](https://www.rsc.org/images/entities/char_2009.gif) 45, while at higher ratios HSA molecules form a single protein monolayer of 20 proteins covering the whole surface. The alpha helical content of HSA is reduced by around 30% upon binding to a gold nanoparticle, similar to the results reported in the literature24 (see Fig. 5, blue free HSA, red bound HSA).
45, while at higher ratios HSA molecules form a single protein monolayer of 20 proteins covering the whole surface. The alpha helical content of HSA is reduced by around 30% upon binding to a gold nanoparticle, similar to the results reported in the literature24 (see Fig. 5, blue free HSA, red bound HSA).
In addition, this methodology could also be applied to binary mixtures of proteins. By using fluorescent labelling for selective detection the amount of each protein bound to NPs can be detected and information on structural changes obtained.25
A similar experimental approach can be easily extended to protein-conjugated nanoparticles, thus providing a much needed, not too complex, robust method for determining the amount and structure of bound macromolecules used to modify the properties of nanoparticles.
Conclusions
In summary, we have demonstrated that it is possible to measure the structure and morphology of nanoparticle–protein complexes. By combining a separation method with online size measurements, density measurements and circular dichroism we could identify the average number of proteins bound to each nanoparticle and the changes in the secondary structure of bound proteins. This method can be applied to any combination of NPs and proteins, without the need for any fluorescence labeling. It will provide in-depth experimental information on protein–nanoparticle complexes needed for in-depth characterization of nanoparticle–protein conjugates and of the behavior of nanoparticles in biological systems.Acknowledgements
We would like to thank Dr Giuliano Siligardi and Dr Rohanah Hussein of Diamond Light Source for fruitful advice and discussions related to the experimental results. We thank Diamond Light Source for beamtime on B23 (SM9836 and SM9064), Giuliano Siligardi and Rohanah Hussein of B23 beamline for fruitful advice and discussions related to the experimental results and Támas Jávorfi for technical assistance.References
- A. E. Nel, L. Madler, D. Velegol, T. Xia, E. M. Hoek, P. Somasundaran, F. Klaessig, V. Castranova and M. Thompson, Nat. Mater., 2009, 8, 543–557 CrossRef CAS PubMed.
- M. Lundqvist, J. Stigler, G. Elia, I. Lynch, T. Cedervall and K. A. Dawson, Proc. Natl. Acad. Sci. U. S. A., 2008, 105, 14265–14270 CrossRef CAS PubMed.
- Z. J. Deng, M. Liang, M. Monteiro, I. Toth and R. F. Minchin, Nat. Nanotechnol., 2011, 6, 39–44 CrossRef CAS PubMed.
- A. Salvati, A. S. Pitek, M. P. Monopoli, K. Prapainop, F. B. Bombelli, D. R. Hristov, P. M. Kelly, C. Aberg, E. Mahon and K. A. Dawson, Nat. Nanotechnol., 2013, 8, 137–143 CrossRef CAS PubMed.
- M. I. Setyawati, C. Y. Tay, S. L. Chia, S. L. Goh, W. Fang, M. J. Neo, H. C. Chong, S. M. Tan, S. C. J. Loo, K. W. Ng, J. P. Xie, C. N. Ong, N. S. Tan and D. T. Leong, Nat. Commun., 2013, 4, 1673 CrossRef CAS PubMed.
- M. I. Setyawati, C. Y. Tay, D. Docter, R. H. Stauber and D. T. Leong, Chem. Soc. Rev., 2015 10.1039/C5CS00499C.
- C. Y. Tay, M. I. Setyawati, J. Xie, W. J. Parak and D. T. Leong, Adv. Funct. Mater., 2014, 24, 5936–5955 CrossRef CAS PubMed.
- R. P. Carney, J. Y. Kim, H. Qian, R. Jin, H. Mehenni, F. Stellacci and O. M. Bakr, Nat. Commun., 2011, 2, 335 CrossRef PubMed.
- Ž. Krpetić, A. M. Davidson, M. Volk, R. Lévy, M. Brust and D. L. Cooper, ACS Nano, 2013, 7, 8881–8890 CrossRef PubMed.
- N. C. Bell, C. Minelli and A. G. Shard, Anal. Methods, 2013, 5, 4591–4601 RSC.
- C. Minelli, R. Garcia-Diez, A. E. Sikora, C. Gollwitzer, M. Krumrey and A. G. Shard, Surf. Interface Anal., 2014, 46, 663–667 CrossRef CAS PubMed.
- S. Laera, G. Ceccone, F. Rossi, D. Gilliland, R. Hussain, G. Siligardi and L. Calzolai, Nano Lett., 2011, 11, 4480–4484 CrossRef CAS PubMed.
- L. Calzolai, F. Franchini, D. Gilliland and F. Rossi, Nano Lett., 2010, 10, 3101–3105 CrossRef CAS PubMed.
- X. Liu, M. Yu, H. Kim, M. Mameli and F. Stellacci, Nat. Commun., 2012, 3, 1182 CrossRef PubMed.
- C. Rocker, M. Potzl, F. Zhang, W. J. Parak and G. U. Nienhaus, Nat. Nanotechnol., 2009, 4, 577–580 CrossRef PubMed.
- L. Treuel, S. Brandholt, P. Maffre, S. Wiegele, L. Shang and G. U. Nienhaus, ACS Nano, 2014, 8, 503–513 CrossRef CAS PubMed.
- J. C. Giddings, Sep. Sci., 1966, 1, 123–125 Search PubMed.
- J. Giddings, Science, 1993, 260, 1456–1465 CAS.
- L. Calzolai, D. Gilliland, C. P. Garcia and F. Rossi, J. Chromatogr., 2011, 1218, 4234–4239 CrossRef CAS PubMed.
- J. B. Falabella, T. J. Cho, D. C. Ripple, V. A. Hackley and M. J. Tarlov, Langmuir, 2010, 26, 12740–12747 CrossRef CAS PubMed.
- L. Treuel, M. Malissek, S. Grass, J. Diendorf, D. Mahl, W. Meyer-Zaika and M. Epple, J. Nanopart. Res., 2012, 14, 1–12 CrossRef.
- P. Maffre, K. Nienhaus, F. Amin, W. J. Parak and G. U. Nienhaus, Beilstein J. Nanotechnol., 2011, 2, 374–383 CrossRef CAS PubMed.
- L. Whitmore and B. A. Wallace, Biopolymers, 2008, 89, 392–400 CrossRef CAS PubMed.
- S. Goy-López, J. Juárez, M. Alatorre-Meda, E. Casals, V. F. Puntes, P. Taboada and V. Mosquera, Langmuir, 2012, 28, 9113–9126 CrossRef PubMed.
- G. Siligardi and R. Hussain, Enantiomer, 1997, 3, 77–87 Search PubMed.
Footnote |
| † Electronic supplementary information (ESI) available. See DOI: 10.1039/c5nr05147a |
| This journal is © The Royal Society of Chemistry 2015 |

