 Open Access Article
Creative Commons Attribution 3.0 Unported Licence
Micromotors working in water through artificial aerobic metabolism†
D.
Yamamoto
*a,
T.
Takada
a,
M.
Tachibana
a,
Y.
Iijima
a,
A.
Shioi
a and
K.
Yoshikawa
b
aDepartment of Chemical Engineering and Materials Science, Doshisha University, Kyoto 610-0321, Japan. E-mail: dyamamot@mail.doshisha.ac.jp
bFaculty of Life and Medical Sciences, Doshisha University, Kyoto 610-0394, Japan
First published on 7th July 2015
Abstract
Most catalytic micro/nanomotors that have been developed so far use hydrogen peroxide as fuel, while some use hydrazine. These fuels are difficult to apply because they can cause skin irritation, and often form and store disruptive bubbles. In this paper, we demonstrate a novel catalytic Pt micromotor that does not produce bubbles, and is driven by the oxidation of stable, non-toxic primary alcohols and aldehydes with dissolved oxygen. This use of organic oxidation mirrors living systems, and lends this new motor essentially the same characteristics, including decreased motility in low oxygen environments and the direct isothermal conversion of chemical energy into mechanical energy. Interestingly, the motility direction is reversed by replacing the reducing fuels with hydrogen peroxide. Therefore, these micromotors not only provide a novel system in nanotechnology, but also help in further revealing the underlining mechanisms of motility of living organisms.
Introduction
The fabrication of minute, chemically propelled motors has been a popular yet challenging topic since Ismagilov et al. first demonstrated a centimeter-sized boat that travels on the surface of water. This initial structure was powered by hydrogen peroxide decomposition catalyzed by its Pt-covered stern,1 a reaction that releases oxygen bubbles which serve to propel it. A primary goal since then has been the scaling down of these systems to the micrometer or even nanometer scale.2,3 The first type of catalytic motor relies on external reactants for fuel,4 and while many such systems have been developed, they generally use only hydrogen peroxide5–8 or hydrazine.9–11 Both the chemicals are undesirable in that they are irritants, and often form and store bubbles that can disrupt system operation. Likewise, the other type of catalytic motor, the self-reacted variant, generates bubbles or solid residue, and again often requires toxic materials.12–16 These limitations often make these devices unusable, especially in biomedicine and nanodevices.Herein, we present a micromotor propelled by the oxidation of specific organic compounds using dissolved oxygen, a propulsion process very similar to that of minute organisms. While various types of micromotors have been proposed, we use a simpler micromotor that is composed of hundreds to thousands of primary Pt nanoparticles because the system is easily reproducible in any laboratories. The actual shape and structure of the Pt primary nanoparticles and their assemblies are shown in Fig. 1 and their SEM images are in ref. 17. This work relies on previous research that has demonstrated that catalytic Pt micromotors powered by hydrogen peroxide show different forms of propulsion (i.e., active Brownian motion, translation, rotation, and spinning), depending on their shape.17–19 Furthermore, we have clarified that the dynamical mode can be predicted by quantitative analysis of the two-dimensional shape; we adapt these previously attested shapes to the tested reductant fuels.17
Results and discussion
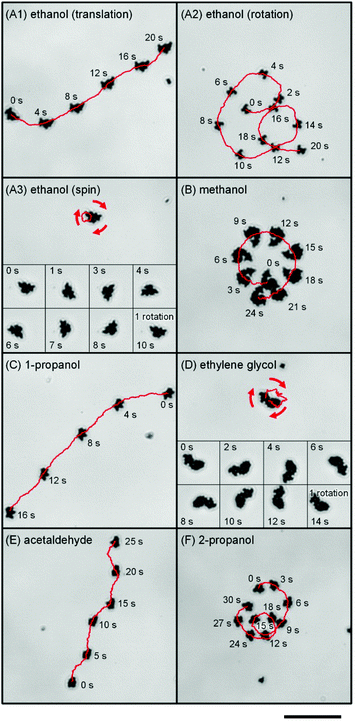
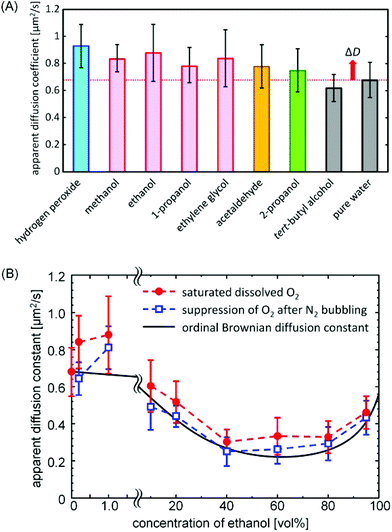
Fig. 1A–D show the trajectory of these micromotors for various primary alcohol solutions at a concentration of 1 vol%. As with previous hydrogen peroxide systems, those motors exhibited two-dimensional regulated motion on the bottom of the employed containers, the type of which was dependent on their morphology.17 In addition based on the careful observations, it has been shown that the primary factor in determining the moving speed is the asymmetric morphology and that the change in the size of the Pt-particles exhibits minor effects. Although quantitative comparison of the speed of these motors was difficult due to a lack of one-to-one correspondence between the shapes in the previous and current experiments, the motors in the current experiment did seem to move somewhat more slowly. Overall, though, the speed seems to be primarily dependent on the morphology and not on the specific alcohol species (Video S1 and S2, ESI†). Acetaldehyde also gave regulated motion (Fig. 1E), though the secondary alcohol 2-propanol showed activity only for concentrations above 10 vol% (Fig. 1F). Likewise, the tertiary alcohol tert-butyl alcohol gave random, unregulated motion at any concentrations. We also confirmed that inert silica particles and their assemblies show random Brownian motion in these solutions, indicating that the observed activity is unique to the Pt structures.While the designed motor generates regular motion, primary Pt nanoparticles simply seem to behave as “hot” colloids,20 with an effective temperature markedly higher than the bare temperature (see Fig. S2, ESI†). In order to evaluate whether non-equilibrium random motion affects this seemingly random displacement, we analyzed the scaling behavior of deviation with respect to time by separating the diffusion constant from the apparent value for the primary Pt particles; in this case, Dapp = DB + ΔD, where DB and ΔD represent the ordinary Brownian diffusion constant and a constant describing excess diffusion. Fig. 2A shows these constants for various aqueous solutions of the employed fuels, having obtained them by calculating the trajectory of more than 10 particles according to the two-dimensional Einstein–Smoluchowski equation (see Fig. S3, ESI†). The apparent ethanol diffusion constant of 0.88 μm2 s−1 was smaller than 0.93 μm2 s−1 of hydrogen peroxide but larger than the ordinary Brownian diffusion constant in pure water 0.68 μm2 s−1. Based on the Einstein–Stokes relationship of D ∝ T−1, the reaction-induced random motion corresponds to the kind of thermal fluctuation that would occur at the effective temperature around 400 K (see eqn S1–4, ESI†).20 Meanwhile, the non-equilibrium diffusion is transformed into directed motion for the Pt assembly; detailed discussion of the conversion efficiency is described in Note S1, ESI.† Likewise, the other primary alcohols and acetaldehyde increased apparent diffusion, while tert-butyl alcohol did not. Note that 2-propanol also increased apparent diffusion, though to a lesser extent.
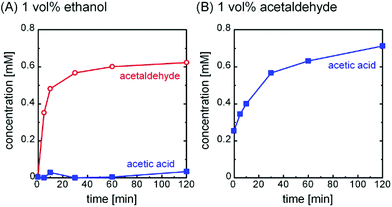
To determine the chemical reaction responsible for propulsion, we used an enzymatic spectrophotometric assay to identify the reaction products for the ethanol and acetaldehyde trials (Fig. S4†). During the experiment, the solutions were vigorously stirred and were not permitted contact with the atmosphere, since oxygen can promote excess oxidation of the fuels. Fig. 3 shows that ethanol and acetaldehyde were oxidized to acetaldehyde and acetic acid, respectively. The final product concentrations of about 0.6 mM were almost twice as large as the initial concentration of dissolved oxygen. We additionally confirmed that the concentration of the fuels stays at a fairly constant value of about 2 × 10² mM throughout the course of the experiment, and furthermore that no product forms when the Pt particles are not present. This suggests the following reactions:
(i) in 1 vol% ethanol
(ii) in 1 vol% acetaldehyde
Additional oxidation hardly occurs because the initial concentration of the fuel is much larger than that of the dissolved oxygen. Likewise, secondary alcohols likely oxidize to the corresponding ketones; in this case, the decreased kinetics of this reaction would seem to account for the decreased propulsion observed.
The ΔD values for the primary alcohols and acetaldehyde are very close to each other, implying that the provided propulsion is not significantly dependent on the individual reaction details, but rather on the commonality between all of them. Therefore, we propose that the generated oxygen concentration gradient resulting from oxygen consumption, and not bubble formation, is responsible for this motion. The concentration of dissolved oxygen in these experiments was on the order of 10−4 M, significantly lower than 10−1 M of the fuels. Therefore, as the fuel is oxidized, the surrounding oxygen concentration should drop rapidly, nearly completely disappearing in a short time. In other words, for the more rapid reaction observed with primary alcohols and acetaldehyde, the reaction rate is restricted by the diffusion limit of oxygen. On the other hand, the lower oxidation rate of secondary alcohols does not lead to the same diffusion-limited reaction. Overall, this suggests that the reaction rate depends strongly on the alcohol concentration.
Past studies with hydrogen peroxide have shown that the resulting oxygen concentration gradient is what propels Pt-containing Janus micromotors;21,22 this process is called self-diffusiophoresis.23 The present micromotor propulsion may be caused by the self-diffusiophoresis because of the asymmetry of the morphology. Let us consider that a boomerang-like micromotor is propelled by self-diffusiophoresis (Scheme 1). For hydrogen peroxide as fuel, the morphology yields the difference in the diffusion flux of the resulting oxygen molecules: the oxygen molecules released from the concave surface concentrate near the surface. This higher oxygen concentration decreases the diffusion flux. On the other hand, the oxygen molecules released from the convex surface expand toward the wider area so that the oxygen concentration decreases. This results in a higher diffusion flux. The opposite driving force in this study, however, should propel the motors in the opposite direction, given the inverse spatial gradient formed by the reaction of the oxygen absorbing fuels when compared to oxygen producing hydrogen peroxide. In order to confirm the validity of this mechanism, we first measured the diffusion constant of a primary particle at different dissolved oxygen concentrations (Fig. 2B). The value dropped significantly for lower concentrations of oxygen, regardless of the ethanol concentration. Note that diffusion constants in all cases decreased between 40 and 80 vol% of ethanol because of the increased viscosity of the mixture.24 In addition, we compared the performance of the identical micromotors in ethanol with that in hydrogen peroxide (Fig. 4A–C and Video S3 and S4, ESI†). As expected, all motion was perfectly reversed.
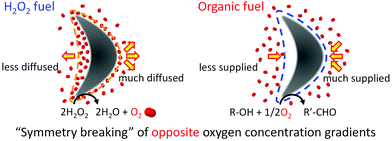 | ||
| Scheme 1 Moving mechanism of a Pt-assembled micromotor propelled by hydrogen peroxide and organic fuels. | ||
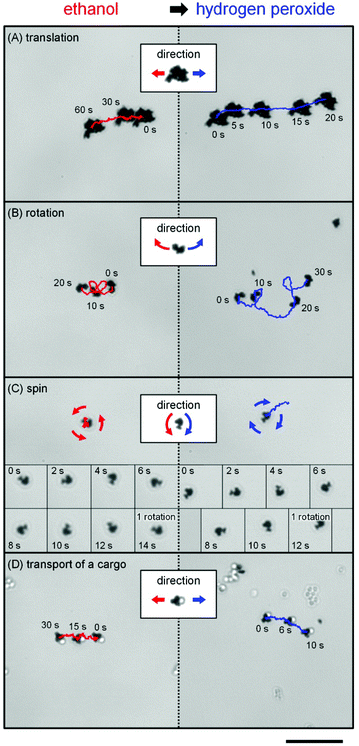 | ||
| Fig. 4 Directional inversion on translational and rotational motions for Pt motors caused by switching of the fuels. Trajectory and snapshots of the (A) translational, (B) rotational, and (C) spin regulated motions for Pt micromotors and (D) accompanying silica cargo (diameter: 1.5 μm) before and after switching from 1 vol% ethanol to 1 wt% hydrogen peroxide. An identical micromotor was used throughout each experiment (Fig. S1, ESI†). The scale bar indicates a length of 20 μm. | ||
Conclusions
In conclusion, we have developed a micromotor system powered by a broad class of common, non-toxic fuels. A wide range of available chemicals and concentrations (Fig. S5, ESI†) significantly increases the scope of application; for example, because the minimal concentration of ethanol is comparable to that found in the blood when drinking alcohol, these motors should be able to operate in vivo without any additional modifications. In addition, the system does not produce any toxic compounds, nor does it generate bubbles or solids that could impede operation even after 10 h of continued operation. Furthermore, the new mechanism increases the available motilities by reversing those previously available with hydrogen peroxide. This functionality allows these motors to pull and push micro-sized silica cargo by alternating between ethanol and hydrogen peroxide (Fig. 4D and Video S4, ESI†). Finally, this oxidative mechanism mirrors comparable biological systems, and the power of the system, on the order of 10−18 W, is roughly comparable to the power of around 10−17 W observed in a bacterium.25 Both systems additionally become inactive at low oxygen concentrations. Given these characteristics, this new system, upon further development and improved motility, may not only be able to serve in new microdevices and drug delivery systems, but also help to better understand the motility of microscopic organisms.Experimental section
Chemicals
Spherical Pt particles (PT-354012, 99.00%) were purchased from Nilaco. Methanol (99.8%), ethanol (99.5%), 1-propanol (99.5%), ethylene glycol (99.0%), acetaldehyde (90%), and hydrogen peroxide (30%) were obtained from Wako Pure Chemical Industries. 2-Propanol (99.5%) and tert-butyl alcohol (99.0%) were purchased from Tokyo Chemical Industry.Observation of Pt particle motion
The experimental setup was reported previously,17 and is briefly explained below. First, Pt powder was dispersed in deionized water by ultrasonication. The particle suspension was then mixed with organic solutes, typically to a concentration of 1 vol%. The resulting solutions were poured into μ-Slides (Nippon Genetics), and the motion of the Pt particles and assemblies were observed at room temperature by using an optical microscope (Olympus IX71, Olympus) and a high-speed CCD camera (30 frames per s). A separate device was used to obtain the results in Fig. 4 that replaced the solution around the Pt particles without convection, allowing for the observation of an identical particle in different solutions; this is explained in detail in Fig. S1, ESI.†Acknowledgements
This work was supported in part by a Grant-in-Aid for Young Scientists (B) (Grant No. 26820341) from the Japan Society for the Promotion of Science (JSPS) and by MEXT Supported Program for the Strategic Research Foundation at Private Universities, 2015–2019. The Hosokawa Powder Technology Foundation also provided funding.Notes and references
- R. F. Ismagilov, A. Schwartz, N. Bowden and G. M. Whitesides, Angew. Chem., Int. Ed., 2002, 41, 652–654 CrossRef CAS.
- T.-C. Lee, M. Alarcón-Correa, C. Miksch, K. Hahn, J. G. Gibbs and P. Fischer, Nano Lett., 2014, 14, 2407–2412 CrossRef CAS PubMed.
- D. A. Wilson, R. J. M. Nolte and J. C. M. van Hest, Nat. Chem., 2012, 4, 268–274 CrossRef CAS PubMed.
- D. Yamamoto and A. Shioi, KONA Powder Part. J., 2015, 32, 2–22 CrossRef.
- S. Fournier-Bidoz, A. C. Arsenault, I. Manners and G. A. Ozin, Chem. Commun., 2005, 441–443 RSC.
- J. G. Gibbs and Y.-P. Zhao, Appl. Phys. Lett., 2009, 94, 163104 CrossRef PubMed.
- Y. He, J. Wu and Y. Zhao, Nano Lett., 2007, 7, 1369–1375 CrossRef CAS PubMed.
- W. F. Paxton, K. C. Kistler, C. C. Olmeda, A. Sen, S. K. St. Angelo, Y. Cao, T. E. Mallouk, P. E. Lammert and V. H. Crespi, J. Am. Chem. Soc., 2004, 126, 13424–13431 CrossRef CAS PubMed.
- W. Gao, A. Pei, R. Dong and J. Wang, J. Am. Chem. Soc., 2014, 136, 2276–2279 CrossRef CAS PubMed.
- W. Gao, S. Sattayasamitsathit, A. Uygun, A. Pei, A. Ponedal and J. Wang, Nanoscale, 2012, 4, 2447–2453 RSC.
- R. Laocharoensuk, J. Burdick and J. Wang, ACS Nano, 2008, 2, 1069–1075 CrossRef CAS PubMed.
- W. Gao, X. Feng, A. Pei, Y. Gu, J. Li and J. Wang, Nanoscale, 2013, 5, 4696–4700 RSC.
- W. Gao, A. Pei and J. Wang, ACS Nano, 2012, 6, 8432–8438 CrossRef CAS PubMed.
- W. Gao, A. Uygun and J. Wang, J. Am. Chem. Soc., 2011, 134, 897–900 CrossRef PubMed.
- R. Liu and A. Sen, J. Am. Chem. Soc., 2011, 133, 20064–20067 CrossRef CAS PubMed.
- F. Mou, C. Chen, H. Ma, Y. Yin, Q. Wu and J. Guan, Angew. Chem., Int. Ed., 2013, 52, 7208–7212 CrossRef CAS PubMed.
- D. Yamamoto, A. Mukai, N. Okita, K. Yoshikawa and A. Shioi, J. Chem. Phys., 2013, 139, 034705 CrossRef PubMed.
- B. Jingjing, Y. Zhan, M. Nakajima, S. Yajing, M. Takeuchi, H. Qiang and T. Fukuda, IEEE Trans. Robot., 2014, 30, 33–39 CrossRef.
- N. I. Kovtyukhova, J. Phys. Chem. C, 2008, 112, 6049–6056 CAS.
- J. Palacci, C. Cottin-Bizonne, C. Ybert and L. Bocquet, Phys. Rev. Lett., 2010, 105, 088304 CrossRef.
- S. J. Ebbens and J. R. Howse, Langmuir, 2011, 27, 12293–12296 CrossRef CAS PubMed.
- J. R. Howse, R. A. L. Jones, A. J. Ryan, T. Gough, R. Vafabakhsh and R. Golestanian, Phys. Rev. Lett., 2007, 99, 048102 CrossRef.
- R. Golestanian, T. B. Liverpool and A. Ajdari, Phys. Rev. Lett., 2005, 94, 220801 CrossRef.
- I. Khattab, F. Bandarkar, M. Fakhree and A. Jouyban, Korean J. Chem. Eng., 2012, 29, 812–817 CrossRef CAS.
- S. Chattopadhyay, R. Moldovan, C. Yeung and X. L. Wu, Proc. Natl. Acad. Sci. U. S. A., 2006, 103, 13712–13717 CrossRef CAS PubMed.
Footnote |
| † Electronic supplementary information (ESI) available: Details of the experimental procedure, supplementary note S1, supplementary Fig. S1 to S5, and supplementary videos S1 to S4. See DOI: 10.1039/c5nr03300d |
| This journal is © The Royal Society of Chemistry 2015 |

