 Open Access Article
Creative Commons Attribution 3.0 Unported Licence
The spontaneous room temperature reduction of HAuCl4 in ethylene glycol in the presence of ZnO: a simple strategy to obtain stable Au/ZnO nanostructures exhibiting strong surface plasmon resonance and efficient electron storage properties†
Matías E.
Aguirre
a,
Gonzalo
Perelstein
a,
Armin
Feldhoff
b,
Adriana
Condó
c,
Alfredo J.
Tolley
c and
María A.
Grela
*a
aDepartamento de Química, Universidad Nacional de Mar del Plata, Funes 3350, B7602AYL Mar del Plata, Argentina. E-mail: magrela@mdp.edu.ar
bInstitut für Physikalische Chemie und Elektrochemie, Leibniz Universität Hannover, Callinstraße 3a, D-30167 Hannover, Germany
cCentro Atómico Bariloche, R8400AGQ San Carlos de Bariloche, Río Negro, Argentina
First published on 11th November 2014
Abstract
The room temperature spontaneous reduction of HAuCl4 in ethylene glycol in the presence of pre-formed ZnO nanoparticles is investigated by UV-vis spectroscopy. Analysis by HRTEM demonstrated that the synthesized nanostructures consist of small ZnO nanoparticles (5.0 nm) in contact with bigger (15 nm) spherical Au nanoparticles. The electronic communication between Au and ZnO blocks is confirmed by UV excitation of the colloid. These experiments indicate that ZnO nanoparticles efficiently transfer the electrons to Au nanoparticles in contact, inducing a 15 nm blue shift in the plasmon band. Titration experiments using the methylviologen couple (MV2+/MV˙+) are presented and analyzed to quantify the enhancement in the electron storage capability in the new nanostructure and the negative shift in the Fermi level caused by the Au loading in ZnO.
Introduction
The development of synthetic methods to produce metal nanoparticles and composite metal–semiconductor nanostructures is an active area of research.1–4 The interest for these materials is motivated in their broad range of applications that include catalysis,5 optoelectronics,6,7 information processing, sensing8 and biological applications.9,10 Recent advances in the preparation and assembly of metal nanostructures have opened up new opportunities for precise control of their interaction with light through the modulation of their plasmon band.11Noble metal nanoparticles can be synthesized by many chemical methods,12 the most popular being the reduction of the precursor salts by citrate, introduced by Turkevich in 1951,13 the synthesis of Brust involving a two phase process using sodium borohydride as a reductant14 or the polyol process developed by Fiévet and co-workers.15 The primary reaction of the latter process involves the reduction of the metal precursor by the polyol at elevated temperatures in the presence of a stabilizer, usually poly(vinylpyrrolidone), PVP.16 The temperature dependent reducing power of the polyols17 together with the known ability of PVP as a shape directing agent18 has been exploited to control the nucleation and growth processes i.e., to modulate the size and morphology of the metal nanoparticles by changing the reaction temperature and the concentration of the stabilizer.19,20
The development of plasmon bands in the visible region is of particular interest since their excitation can trigger chemical transformations of species in the vicinity of the nanostructure by the enhanced generation of excited states, thermal activation or hole-transfer. The latter process is supposed to be favoured in metal–semiconductor nanostructures, where the injection of the plasmon photoinduced electrons into the CB of the semiconductor may assist charge separation.21 However, to make this mechanism feasible, metal and semiconductor domains should be in direct contact avoiding the presence of stabilizers, insulating layers or molecular linkers since electron injection competes with the rapid electron scattering process.22
Here we report on a simple method for obtaining Au/ZnO nanocomposites in ethylene glycol at room temperature which does not require the addition of stabilizers or other reducing agents. Interestingly the synthesized material displays a sharp plasmonic band peaking at 535 nm and is stable for months. HRTEM studies indicate that the Au/ZnO nanostructures are formed by small ZnO nanoparticles (5 ± 0.8 nm) partially covered by relatively bigger (15 ± 5 nm) spherical Au nanoparticles. The electronic contact between the building blocks is assessed by a blue shift of 15 nm obtained by UV excitation of Au/ZnO. Titration experiments using the methylviologen couple (MV2+/MV˙+) are presented and analyzed to quantify the enhancement in the electron storage capability in the new nanostructure and the negative shift in the Fermi level caused by the Au loading in ZnO.
Experimental section
Materials
Methylviologen dichloride hydrate, 98%, (Aldrich), hydrogen tetrachloroaurate trihydrate, 99.9%, (Aldrich), zinc acetate dihydrate (Fluka), sodium hydroxide (Merck), tetramethyl-ammonium hydroxide (Sigma) were of the highest available purity and used as received. Ethylene glycol (Biopack), 1-octanol (extra pure grade, Merck), ethyl acetate (Sintorgan), heptane (Sintorgan) and dimethylsulfoxide (chromatographic grade, Sintorgan) were used without further purification.Methods
Glassware was cleaned with sulfochromic acid, washed with a non ionic detergent and wiped away with ultrapure water.
The crystalline properties of ZnO and Au/ZnO nanostructures were examined via powder X-ray diffraction (XRD). The analysis was carried out on a X'Pert PRO (PANalytical) powder X-ray diffractometer, with CuKα (1.54 Å) as the incident radiation and operated at an accelerating voltage of 40 kV with a current intensity of 40 mA. The samples for XRD analysis were prepared by precipitation of the nanocomposites dispersed in ethylene glycol with 1-octanol. The solid was repeatedly washed with small amounts of ethanol, and finally dried under a nitrogen stream and then heated at 120 °C.
ZnO and Au/ZnO nanocomposites were also investigated by transmission electron microscopy (HRTEM) using a Philips CM200 LaB6 microscope and a Tecnai F20 field-emission instrument, equipped with EDAX energy-dispersive X-ray spectrometers (EDXS). A ca. 10 μL drop of colloidal suspension was put on a copper-supported formvar–carbon foil and dried under a red light lamp.
Results and discussion
Formation of Au/ZnO nanostructures
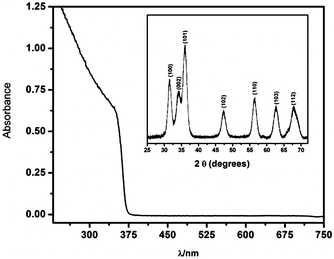
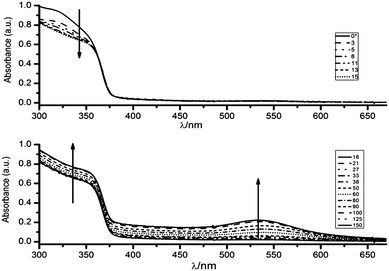
Fig. 1 shows the UV-vis absorption spectra of ZnO nanoparticles dispersed in ethylene glycol. The onset of absorption of the as-synthesized nanoparticles was found at energies higher than that of the ZnO bulk bandgap, demonstrating that they are in the quantum confinement regime. An average diameter 〈d〉 = 5.0 nm was evaluated from the UV-visible absorption spectra using available models, based on the effective mass approximation.24,25 For details see S1 (ESI†). The inset shows the XRD pattern of powders which confirms the formation of hexagonal wurzite nanocrystal particles, JCPDS card #36-1451.26Fig. 2 shows the evolution of the UV-vis spectra of a 0.16 mM HAuCl4 solution in a 2 mM ZnO sol maintained at constant temperature (298 K) and stirred by air-bubbling.
Absorption measurements were performed in a quartz cuvette (l = 0.5 cm). For clarity, the data are presented in two panels, as the absorbance in the UV region at λ < 370 nm decreases in the first ten minutes and then increases together with the appearance of a visible band. The solid curve of the upper panel shows the theoretical initial absorbance (denoted as t = 0* minutes) obtained as simple sum of the contributions of the individual species, and the rest of the curves show the following absorbance spectra obtained upon mixing the solutions. The high viscosity of ethylene glycol somehow prevents a good measure of the initial value. However, the first determination, obtained after 3 minutes of reaction, indicates a rapid depletion of the band attributable to the Au(III) species in pure ethylene glycol. This observation is followed by a slower decay of the absorbance range between 290 and 350 nm.
As shown in the lower panel of Fig. 2, a visible band centred at 535 nm, appears after the UV-vis spectrum in the region below 350 nm has recovered the absorption characteristics of ZnO. This feature indicates the formation of spherical Au nanoparticles with a moderate size distribution.
It should be stressed that the presence of ZnO was found to be necessary for the development of the plasmon band, which is indicative of the complete reduction of Au(III) to Au(0). In contrast, the evolution of the UV-vis spectra of a 0.11 mM HAuCl4 solution in pure ethylene glycol shows that the ligand-to-metal charge transfer (LMCT) band of the AuCl4− at 322 nm slowly decreases, with an apparent half-life time, τ ∼ 1200 minutes (see S3, ESI†). It is worthwhile to notice that in the absence of ZnO the reduction ends in Au(I) species, as the UV-vis spectra remain invariable once the absorption at 322 nm bleaches. The formation of small (d < 5 nm) subplasmonic nanoparticles was discarded by determining that there were no fluorescent signals upon excitation at λ = 270–300 nm which are typically observed for gold nanoclusters.27 The above results clearly indicate that in homogeneous systems it is necessary to enhance the moderate reducing power of ethylene glycol by photochemical or thermal activation12 in order to obtain Au nanoparticles, and lends additional support to the fact that Au(0) is formed on ZnO nanoparticles. On the other hand, the thermal and photochemical28 production of Au nanoparticles in ethylene glycol revealed that Au nanoparticles readily agglomerate and precipitate unless a suitable stabilizer is added during the synthesis.15,16 By these evidences we can safely discard the presence of free Au nanoparticles as products of our synthetic approach.
Au/ZnO nanostructures were characterized by XRD and HRTEM. Additionally, TEM was combined with energy dispersive X-ray spectroscopy (EDXS) and used during the measurements also as a scanning transmission electron microscope (STEM) to obtain high-angle annular dark-field (HAADF) micrographs and the phase distribution. This last information is shown in Fig. S2, in the ESI.†
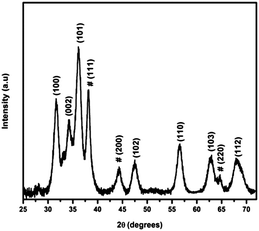
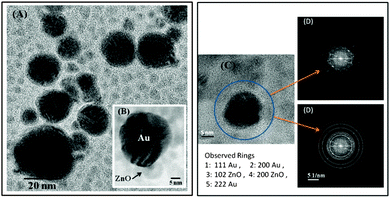
The XRD pattern of the Au/ZnO nanostructure, Fig. 3, shows in addition to the peaks corresponding to the reflection from the crystal planes of ZnO observed in the inset of Fig. 1, those characteristic of Au nanoparticles, JCPDS card No. 04-0784. HRTEM analysis shown in Fig. 4 apparently indicates that ZnO surrounds Au nanoparticles partially, but they do not form a closed shell. Notice that the formation of a perfect shell, covering Au nanoparticles, would be detrimental for our purposes, i.e., for their utilization in plasmonic photocatalysis. We have already performed additional experiments, results not shown, involving the visible excitation of the synthesized nanostructure to demonstrate that under these conditions, an electron from Au can be transferred to the semiconductor and that the hole left in the metal can be replenished by a donor added to a dispersion of the nanostructures in ethylene glycol.
Mechanism of formation of Au/ZnO nanostructures
The adsorption of gold chloride and gold hydroxyl chlorides [Au(OH)4−xClx]− complexes on titanium dioxide and other oxides has been considered in the literature, in connection with the loading of Au nanoparticles over the semiconductors by deposition–precipitation methods29 or photoreduction.30,31 Due to its amphoteric character, semiconductor metal oxides can attract both positive and negative ions depending on whether the pH of the media lies above or below the zero point charge, respectively.32 Besides the pure electrostatic interaction, the high fraction of undercoordinated atoms at the surface of the nanoparticles enhances their reactivity toward binding. In this context, it has been proposed that the interaction of gold hydroxy chlorides with aqueous titanium dioxide30 or alumina32 involves a reaction with surface M–OH groups available at the oxide–water interface to form an inner-sphere complex| MOH + [Au(OH)4−xClx]− = MAu(OH)3−xClx−1 + H2O + Cl− | (1) |
In the above equation M stands for the metal (M = Ti, Al), and the terminal coordinating OH group is the result of the dissociative water chemisorption.
A detailed description of the adsorption processes of inorganic and organic species is not simple, because it requires the definition of a particular crystal face at which the chemisorption takes place.33 Although there is still a considerable gap between the theoretical pictures and a realistic description of the processes taking place at the metal oxide interface, computational studies had shed some light on the specific ways that water34 and other ligands bearing definite anchor groups (as 1,2 OH moieties) interact with the ZnO surface.35
Based on these studies, to rationalize the reduction of Au(III) species on ZnO we assume that before the addition of AuCl4−, the semiconductor surface is covered by water and ethylene glycol molecules. The capping action of ethylene glycol towards ZnO nanoparticles has been assessed by FTIR spectroscopy36 and exploited to control the size and agglomeration state of ZnO nanoparticles.37 Upon addition of Au(III) species, the electrostatic attraction between gold chloride complexes (or chlorohydroxy complexes formed by the small amount water present in the solvent) and the positive charged ZnO surface brings these partners in close contact, and favours the chemical adsorption of the gold precursors on the defect sites of ZnO by substitution of one of the chloride ligands by a hydroxyl group on the surface of ZnO. The reaction between Au and ethylene adsorbed on neighbouring positions of the surface probably leads to the oxidation of the carbon atom associated with the OH group to aldehyde with the concomitant reduction of Au(III) to Au(I), which then is further reduced to Au(0).
It is interesting to notice that the plasmon band does not appear until the absorbance because Au(III) species has disappeared completely. This fact may be accounted considering the comproportionation reaction of nascent gold atoms with Au(III) species, as recently proposed by Belloni and co-workers:38
| Au(III) + Au(0) → Au(II) + Au(I) | (2) |
Once all Au(III) has been removed from the system, the agglomeration of Au(0) species as shown in Scheme 1 produces the plasmon band, and in turn explains the observed morphology of the nanostructures.
Assessing the contact between Au and ZnO blocks
It has been shown that UV-irradiation of a sol of ZnO nanoparticles in the absence of suitable electron scavengers leads to a blue shift in the absorption spectra. This phenomenon, referred to in the literature as the Moss–Burstein effect, can be used to ascertain the accumulation of conduction band electrons in semiconductor nanoparticles.39Electrochemical and photochemical experiments indicate that charged ZnO nanoparticles can transfer the electrons to Au nanoparticles in contact, increasing the number of accumulated charge carriers within the system. The storage of multiple electrons during the UV irradiation of Au/ZnO nanostructures drives the overall Fermi level of the system to more negative potentials.40–42
We have monitored the UV-vis spectra of pure ZnO and Au/ZnO nanostructures to investigate the effect of the metal on charge storage during the anaerobic irradiation at 303 ± 10 nm. In both cases we found that the excitonic band of ZnO progressively shifts to the blue until it reaches a steady state. However the irradiation of the Au/ZnO nanostructures additionally results in a shift of the plasmon band from 535 to 520 nm (see Fig. 5).
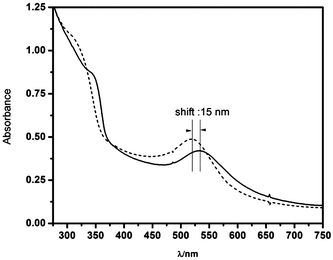 | ||
| Fig. 5 UV-vis spectra of the Au/ZnO nanostructures obtained before (solid line) and after (dashed line) anaerobic, 303 ± 10 nm irradiation. | ||
This change is indicative of the increased electron density in the metal, and can be taken as strong evidence that the junction between ZnO and Au nanoparticles in the nanostructure allows the transfer of electrons across the interface.43 It should be stressed that the original spectra can be completely recovered by admitting air into the cell, indicating that Au nanostructures are not affected by the UV irradiation.
On the other hand, the number of electrons stored – after reaching the steady state under anaerobic 303 nm irradiation – was evaluated by the production of the methyl viologen cation radical MV+ from MV2+, according to reaction (3):
| MV2+ + e− → MV+˙ | (3) |
We found that 0.0051 and 0.0173 μmoles of MV2+ are used to titrate the electrons stored in ZnO and Au/ZnO nanostructures, respectively. As reported elsewhere, these experiments allow the determination of the apparent Fermi level of the electrons after equilibration with the MV2+/MV˙+ couple using eqn (4):
 | (4) |
Using electron paramagnetic resonance, we have recently proved that the synthesized nanostructures can also be used in the plasmon photoinduced electron transfer process in the metal → semiconductor direction under selective visible irradiation, and that the hole in the metal can be replenished by a convenient donor added to the dispersion of the nanostructures in ethylene glycol.44 These results indicate that by modulating the excitation wavelength the electron flow direction can be switched in both directions. We are actively investigating these issues.
Conclusions
In summary we have shown that HAuCl4 can be spontaneously reduced in ethylene glycol in the presence of pre-formed ZnO nanoparticles at room temperature leading to Au/ZnO nanostructures with a sharp plasmonic band, and not requiring the presence of additional stabilizers. The electronic contact between ZnO and Au and the enhancement in electron accumulation caused by Au loading were assessed by UV irradiation in the absence of acceptors followed by MV2+ titration experiments in the dark.Acknowledgements
The authors thank Dr M. Desimone (Intema, CONICET) for technical assistance in the XRD analysis. This work was financially supported by the University of Mar del Plata and the National Research Council of Argentina (CONICET), project PIP 416. MEA thanks CONICET for a doctoral fellowship.References
- N. Zhang, S. Liu and Y.-J. Xu, Nanoscale, 2012, 4, 2227–2238 RSC.
- S. Linic, P. Christopher, H. Xin and A. Marimuthu, Acc. Chem. Res., 2013, 46, 1890–1899 CrossRef CAS PubMed.
- X. Zhou, G. Liu, J. Yu and W. Fan, J. Mater. Chem., 2012, 22, 21337–21354 RSC.
- C. Mondal, J. Pal, M. Ganguly, A. K. Sinha, J. Jana and T. Pal, New J. Chem., 2014, 38, 2999–3005 RSC.
- M. Haruta, CATTECH, 2002, 6, 102–115 CrossRef CAS.
- X. Li, G. Chen, L. Yang, Z. Jin and J. Liu, Adv. Funct. Mater., 2010, 20, 2815–2824 CrossRef CAS.
- J. Qi, X. Dang, P. T. Hammond and A. M. Belcher, ACS Nano, 2011, 5, 7108–7116 CrossRef CAS PubMed.
- F. Boccuzzi, A. Chiorino, S. Tsubota and M. Haruta, Sens. Actuators, B, 1995, 25, 540–543 CrossRef CAS.
- W.-Q. Zhang, Y. Lu, T.-K. Zhang, W. Xu, M. Zhang and S.-H. Yu, J. Phys. Chem. C, 2008, 112, 19872–19877 CAS.
- X. Wang, X. Kong, Y. Yu and H. Zhang, J. Phys. Chem. C, 2007, 111, 3836–3841 CAS.
- M. Rycenga, C. M. Cobley, J. Zeng, W. Li, C. H. Moran, Q. Zhang, D. Qin and Y. Xia, Chem. Rev., 2011, 111, 3669–3712 CrossRef CAS PubMed.
- D. V. Goia and E. Matijević, New J. Chem., 1998, 22, 1203–1215 RSC.
- J. Turkevich, P. C. Stevenson and J. Hillier, Discuss. Faraday Soc., 1951, 11, 55–75 RSC.
- M. Brust, M. Walker, D. Bethell, D. J. Schiffrin and R. Whyman, J. Chem. Soc., Chem. Commun., 1994, 7, 801–802 RSC.
- F. Fiévet, J. P. Lagier, B. Blin, B. Beaudoin and M. Figlarz, Solid State Ionics, 1989, 32, 198–205 CrossRef.
- P. Y. Silvert and K. Tekaia-Elhsissen, Solid State Ionics, 1995, 82, 53–60 CrossRef CAS.
- A. R. Tao, S. Habas and P. Yang, Small, 2008, 4, 310–325 CrossRef CAS.
- I. Pastoriza-Santos and L. M. Liz-Marzan, Adv. Funct. Mater., 2009, 19, 679–688 CrossRef CAS.
- F. Kim, S. Connor, H. Song, T. Kuykendall and P. Yang, Angew. Chem., Int. Ed., 2004, 116, 3673–3677 CrossRef PubMed.
- Y. Sun and Y. Xia, Science, 2002, 298, 2176–2179 CrossRef CAS PubMed.
- S. Linic, P. Christopher and D. B. Ingram, Nat. Mater., 2011, 10, 911–921 CrossRef CAS PubMed.
- J. C. Scaiano and K. Stamplecoskie, J. Phys. Chem. Lett., 2013, 4, 1177–1187 CrossRef CAS.
- D. A. Schwartz, N. S. Norberg, Q. P. Nguyen, J. M. Parker and D. R. Gamelin, J. Am. Chem. Soc., 2003, 125, 13205–13218 CrossRef CAS PubMed.
- L. Brus, J. Phys. Chem., 1986, 90, 2555–2560 CrossRef CAS.
- N. S. Pesika, K. J. Stebe and P. C. Searson, J. Phys. Chem. B, 2003, 107, 10412–10415 CrossRef CAS.
- American Society for Testing and Material, American Society for Testing and Material, Powder Diffraction Files, Joint Committee on Powder Diffraction Standards, Swarthmore, PA, 1999, pp. 3–888 Search PubMed.
- X. Liu, C. Li, J. Xu, J. Lv, M. Zhu, Y. Guo, S. Cui, H. Liu, S. Wang and Y. Li, J. Phys. Chem. C, 2008, 112, 10778–10783 CAS.
- S. Eustis, H. Y. Hsu and M. A. El-Sayed, J. Phys. Chem. B, 2005, 109, 4811–4815 CrossRef CAS PubMed.
- R. Zanella, S. Giorgio, C. R. Henry and C. Louis, J. Phys. Chem. B, 2002, 106, 7634–7642 CrossRef CAS.
- T. Soejima, H. Tada, T. Kawahara and S. Ito, Langmuir, 2002, 18, 4191–4194 CrossRef CAS.
- C.-Y. Wang, C.-Y. Liu, X. Zheng, J. Chen and T. Shen, Colloids Surf., A, 1998, 131, 271–280 CrossRef CAS.
- S. Ivanova, C. Petit and V. Pitchon, Appl. Catal., A, 2004, 267, 191–201 CrossRef CAS PubMed.
- W. Macyk, K. Szacilowski, G. Stochel, M. Buchalska, J. Kuncewicz and P. Labuz, Coord. Chem. Rev., 2010, 254, 2687–2701 CrossRef CAS PubMed.
- D. Raymand, A. C. T. van Duin, W. A. Goddard, K. Hermansson and D. Spangberg, J. Phys. Chem. C, 2011, 115, 8573–8579 CAS.
- A. Calzolari, A. Ruini and A. Catellani, J. Am. Chem. Soc., 2011, 133, 5893–5899 CrossRef CAS PubMed.
- R. S. Ningthoujam, N. S. Gajbhiye, A. Ahmed, S. S. Umre and S. J. Sharma, J. Nanosci. Nanotechnol., 2008, 8, 3059–3062 CrossRef CAS PubMed.
- T. Ghoshal, S. Kar and S. Chaudhuri, Cryst. Growth Des., 2006, 7, 136–141 Search PubMed.
- G. R. Dey, A. K. El Omar, J. A. Jacob, M. Mostafavi and J. Belloni, J. Phys. Chem. A, 2011, 115, 383–391 CrossRef CAS PubMed.
- (a) Y. Di Iorio, M. E. Aguirre, M. A. Brusa and M. A. Grela, J. Phys. Chem. C, 2012, 116, 9646–9652 CrossRef; (b) I. K. Levy, M. A. Brusa, M. E. Aguirre, G. Custo, E. San Roman, M. I. Litter and M. A. Grela, Phys. Chem. Chem. Phys., 2013, 15, 10335–10338 RSC.
- A. Wood, M. Giersig and P. Mulvaney, J. Phys. Chem. B, 2001, 105, 8810–8815 CrossRef CAS.
- V. Subramanian, E. E. Wolf and P. V. Kamat, J. Phys. Chem. B, 2003, 107, 7479–7485 CrossRef CAS.
- M. Tsuji, N. Miyamae, M. Hashimoto, M. Nishio, S. Hikino, N. Ishigami and I. Tanaka, Colloids Surf., A, 2007, 302, 587–598 CrossRef CAS PubMed.
- A. Takai and P. V. Kamat, ACS Nano, 2011, 5, 7369–7376 CrossRef CAS PubMed.
- M. Aguirre, G. M. Perelstein and M. A. Grela, Abstract presented in the Physical and Inorganic Chemistry Argentinean Meeting, AAIFQ Association, Rosario, Argentine, 2013, to be submitted for publication Search PubMed.
Footnote |
| † Electronic supplementary information (ESI) available. See DOI: 10.1039/c4nj01663g |
| This journal is © The Royal Society of Chemistry and the Centre National de la Recherche Scientifique 2015 |

