 Open Access Article
Creative Commons Attribution 3.0 Unported Licence
Microfluidic droplet-based liquid–liquid extraction: online model validation
Martin
Lubej
a,
Uroš
Novak
a,
Mingqiang
Liu
b,
Mitja
Martelanc
b,
Mladen
Franko
b and
Igor
Plazl
*a
aDepartment of Chemical Engineering, Faculty of Chemistry and Chemical Technology, University of Ljubljana, Vecna pot 113, 1000 Ljubljana, Slovenia. E-mail: igor.plazl@fkkt.uni-lj.si
bLaboratory for Environmental Research, University of Nova Gorica, Vipavska 13, P.O. Box 301, 5000 Nova Gorica, Slovenia
First published on 18th March 2015
Abstract
Droplet-based liquid–liquid extraction in a microchannel was studied, both theoretically and experimentally. A full 3D mathematical model, incorporating convection and diffusion in all spatial directions along with the velocity profile, was developed to depict the governing transport characteristics of droplet-based microfluidics. The finite elements method, as the most common macroscale simulation technique, was used to solve the set of differential equations regarding conservation of moment, mass and solute concentration in a two-domain system coupled by interfacial surface of droplet-based flow pattern. The model was numerically verified and validated online by following the concentrations of a solute in two phases within the microchannel. The relative azobenzene concentration profiles in a methanol/n-octane two-phase system at different positions along the channel length were retrieved by means of a thermal lens microscopic (TLM) technique coupled to a microfluidic system, which gave results of high spatial and temporal resolution. Very good agreement between model calculations and online experimental data was achieved without applying any fitting procedure to the model parameters.
Introduction
In the last two decades, the confluence of available microscale engineering and the scale dependence of fluid behaviour has revolutionized our ability to precisely control and manipulate fluids and fluidic/fluidic interfaces.1,2 In this period, microfluidics evolved using multidisciplinary knowledge involving physics, chemistry, biology, and engineering, where its applications range from materials processing and analytical chemistry to biology and medicine.3–9 Besides the advantages manifested in practical applications, microfluidic devices are excellent tools to gain deeper understanding of underlying mechanisms and principles, like transport phenomena and kinetics.10–16 In order to describe the transport phenomena in microflows, quantitative analysis of diffusion and convective mass transfer is needed.17–21The development of successful applications within the field of microfluidics and broader fields including analytical chemistry is reliant upon several factors,22,23 of which an appropriate detection approach is essential.24 Powerful analytical tools have been developed combining detection techniques with a microchip, and the majority of these methods are based on optical phenomena. Among them, fluorescence detection is the most commonly used in microfluidics. However, weak fluorescence of targets, photobleaching and autofluorescence of many polymer materials, as well as non-specific biomolecules in the sample, are challenges that still have to be solved.24,25 An option that eliminates these problems is thermal lens microscopy (TLM), a photothermal spectroscopic technique, which provides a flexible and highly sensitive detection approach for nonfluorescent molecules that is capable of carrying out single-molecule detection for label-free in vivo quantification.24 TLM provides high sensitivity, which is comparable to the sensitivity of spectrofluorimetric methods, and enables detection of absorbances as low as 10−7 AU (absorbance units).27 For example, TLM provided the possibility of determining average concentrations corresponding to 0.4 molecules in a detection volume of 7 fL and counting individual metallic nanoparticles.26 Detection is, however, performed at just a single excitation wavelength, which, in addition to the limited number of laser emission lines available for excitation in TLM, results in the relatively poor selectivity of TLM. To alleviate this disadvantage, TLM can be used in combination with separation techniques, such as liquid–liquid microextraction, or with some additional treatment of the sample or analyte (e.g. derivatization), as demonstrated in several analytical applications of TLM, which were previously reviewed.26,27 Nonetheless, combining TLM with microchip technology compensates for the weaknesses of available analytical techniques and widens its applicability to microchip chemistry.26–28 In our previous works, the optical configuration of a thermal lens microscope (TLM) was optimized for detection in a microfluidic chip with respect to the flow velocity, pump and probe beam parameters (beam waists, offsets, mode mismatching degree).29–31 As an application, TLM was used to study the diffusion of azobenzene in continuous parallel flow within a microfluidic chip31 and provided quantitative data on molecular transport (diffusion coefficients and partition coefficient) in a microfluidic system, which was first evidenced by TLM in a microfluidic stationary system by Kitamori and coworkers.32
In this work, concentrations of azobenzene were measured inside a microchannel during droplet-based extraction in methanol/n-octane with the in-house built TLM. A detailed description of the transport phenomena by means of mathematical modelling at the macroscopic level was presented, which provided insight into the concentration profiles of the moving droplet and the surrounding plug of stable slug flow. The finite elements method was used to solve the model based on momentum, mass and species conservation equations. The species flux continuity and the concentration distribution between the two phases were also taken into account to theoretically describe the transport phenomena in droplet-based microfluidics. The model was verified and validated online to depict the governing transport characteristics of multiphase flows at the microscale without modelling simplification based on the film theory and the volumetric mass transfer coefficient, kLa.
Theoretical background
Governing equations
A theoretical description of the liquid–liquid extraction process at formed and stable segmented flow in the microchannel was developed using the bases of continuum theory. The following set of differential equations regarding momentum conservation (eqn (1)), mass conservation (eqn (2)), and species conservation (eqn (3)) have to be solved to describe the convection–diffusion dynamics in all three spatial directions and to depict the governing transport characteristics of droplet-based microfluidics: | (1) |
 | (2) |
 | (3) |
 is the velocity vector (m s−1), pk is the kinematic pressure (m2 s−2), ν is the kinematic viscosity (m2 s−1), Ci is the concentration of the solute (azobenzene) in either methanol or n-octane (mol m−3), and Dij is the diffusion coefficient of the solute (azobenzene) in both solvents (methanol and n-octane) (m2 s−1).
The momentum and mass conservation equations (eqn (1) and (2)) are treated as stationary; however, the species conservation equation (eqn (3)) is time dependent, since the concentration profile solutions are regarded as functions of the different resident times of the slug inside the microchannel.
Slug geometry
The geometry of the slug was determined using two main parameters: the contact angle of the interfacial surface (determined from the photographs of the Taylor droplet flow inside the glass microchannel) and the volume of the slug. A system of four equations was solved to obtain the parameters that define the interfacial surface (eqn (4)–(7)): | (4) |
 | (5) |
 | (6) |
 | (7) |
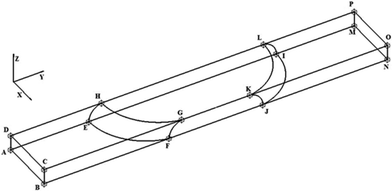
The parabolic function was used as a base for droplet and slug geometry determination, which was used as a physical domain for numerical calculations. The physical domain was decoupled into two parts (D1, D2) that define the fluid outside the slug and the fluid inside the slug (Fig. 1). Both domains were coupled at the interfacial surface using the mutually dependent boundary conditions regarding the velocity and concentration distribution at the interfacial surface.
The boundary conditions for the governing equations (eqn (1)–(3)) were determined for each boundary surface at domain parts and are listed in Table 1.
| Surfaces (Fig. 1) | Boundary conditions regarding velocity | Boundary conditions regarding concentration |
|---|---|---|
| ABCD, MNOP | Periodic condition  |
Periodic condition C1(ABCD) = C1(MNOP) |
| DHGC, HLGK, LPOK | Moving wall  |
Zero gradient  |
| CGFB, GKJF, KONJ | Moving wall  |
Zero gradient  |
| AEFB, EIJF, IMNJ, DHEA, HLIE, LPMI, DHEA | Symmetry  |
Symmetry  |
| HGFE, KLIJ | Flow continuity, no flow perpendicular to surface  , ,  |
Flux continuity, concentration distribution  C1 = C2 · Kp C1 = C2 · Kp |
The most significant boundary conditions for obtaining the droplet-based multiphase flows in the microchannel are those defined at the interfacial surfaces. The velocity at the interfacial surface was defined as zero in the direction perpendicular to the interfacial surface (no mass exchange over the interfacial surface). The velocity in the other directions was equalized in both domains (inside and outside the droplet) to satisfy the momentum continuity. The equilibrium relation between the concentration of azobenzene in methanol and n-octane defined by the partition coefficient Kp was assumed as a boundary condition at the one side of the interface, while the continuity of flux in the perpendicular direction to the interfacial surface was considered as a boundary condition at the other side of the methanol/n-octane interface. The initial condition for concentration differs depending on the simulation type. At simulations of transport from droplet to slug, the normalized concentration inside the droplet was set to 1 and inside the slug it was set to 0. When simulating the transport from slug to droplet, the initial condition regarding the normalized concentration was 1 inside the slug and 0 inside the droplet.
Numerical analysis
The finite element method (FEM), which is based on the discretization of continuous forms of transport equations, was used for the numerical solving of the system of partial differential equations (eqn (1)–(3)) with the appropriate boundary conditions described in Table 1. The verification of the mathematical model was performed on the basis of numerical analysis. The discretization of the physical domain for defined geometry (Fig. 1) by 1![[thin space (1/6-em)]](https://www.rsc.org/images/entities/char_2009.gif) 989
989![[thin space (1/6-em)]](https://www.rsc.org/images/entities/char_2009.gif) 070 heterogeneous tetrahedral elements with the higher mesh density of elements at the interfacial surfaces and channel walls has enabled stable and accurate solutions.
070 heterogeneous tetrahedral elements with the higher mesh density of elements at the interfacial surfaces and channel walls has enabled stable and accurate solutions.
Experimental set-up
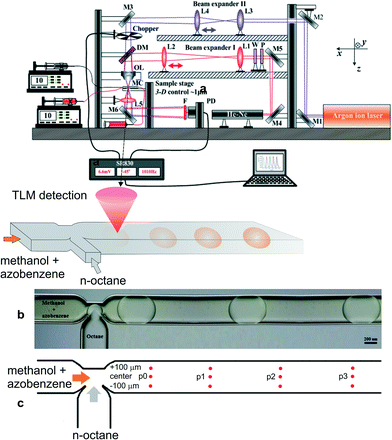
A pump beam from an Argon laser (Innova 90, Coherent Inc., Santa Paula, USA) at 457.9 nm was first reflected by mirrors to the beam expander II (lenses L3 and L4 with focal lengths of 3 and 5 cm, respectively), and then, after passing a mechanical chopper operating at 1.03 kHz, it was combined by a dichroic mirror with a 632.8 nm probe beam from a He–Ne laser (Melles Groit 25-LHP-151-230, Rochester, New York, USA), which first passes an optical isolator (composed of a linear polarizer and a quarter wave plate) and beam expander I (composed of lenses L1 and L2 with focal lengths of 4 and 15 cm, respectively) (Fig. 2a). These two beams were aligned coaxially through an objective lens (20×/NA 0.40), and then propagated through a microfluidic device (the dimensions of the microchannel were 190 μm × 390 μm × 11.25 mm in depth, width and length, respectively) (Fig. 2b). The microfluidic system was composed of two high-pressure syringe pumps equipped with stainless steel syringes (Harvard Apparatus, PHD 4400 series, Holliston, USA), which ensured precisely controlled, adjustable flow rates of methanol and n-octane through the PTFE tubes (VICI Jour, Schenkon, Switzerland) to the microfluidic chip with the T-junction (Dolomite Ltd., Royston, UK). Simultaneously, the probe beam (2 μm in diameter at its waist) was located ~70 μm below the pump beam waist to ensure the maximum detection sensitivity. The probe beam was diffracted by the TL effect and, after a condenser lens, its axial intensity was monitored by a photodiode (Thorlabs GmbH, PDA36A, Munich, Germany) mounted behind an interference filter and a 4 mm pinhole. The photocurrent signal from the photodiode was processed by a lock-in amplifier (Stanford Research Systems, SR830, Sunnyvale, California, USA) with a time constant set at 0.1 s and stored on a personal computer.The stable Taylor droplet flow formation was enabled at a total flow rate of 0.5 μL min−1 for the methanol and n-octane phases, while the inlet concentration of azobenzene in methanol or n-octane was 0.2 mg mL−1. Azobenzene was chosen for the purpose of this work due to the overlap of its absorption band with the wavelength of the available excitation laser and its similar solubility in both solvents. Low solubility in one of the solvents would result in higher experimental errors due to low TLM signals in the solvent providing low solubility, and corresponding low or no observable changes in concentration in the other solvent. The on-line TL-signal was recorded for up to 300 s, at distances of 1, 3, 5 and 7 mm from the junction at the center and 100 μm to each side of the main microchannel (Fig. 2c). The signal corresponding to the concentrations of azobenzene inside and outside the droplet for each measurement point was taken as the average over ten droplets or the following continuous phase solvent in each run, which was repeated twice. The signal corresponding to the initial concentration (C0) was measured in a similar way when just one of the solvents with dissolved azobenzene was pumped through the microchannel. The ratio of such signals (corresponding to C0) in n-octane and methanol served as a normalization factor to compensate for the differences in the thermo-optical properties (thermal conductivity (k), and temperature coefficient of refractive index (∂n/∂T) of the two solvents.
For the fluid flow observation and taking photographs, a digital microscope (Aigo GE-5, Beijing Huaqi Information Digital Technology Co., Ltd., Beijing, China) was employed.
Results and discussion
A schematic of the TLM setup together with the characterization of the microchannel and stable droplet-based flow is shown in Fig. 2. Since the impact of the solute concentration on the density and viscosity of the solvent fluids can be neglected due to their low concentration, the solutions to the momentum and mass conservation equations (eqn (1) and (2)) can be obtained irrespective of the species conservation equation (eqn (3)). The steady-state numerical solution was achieved in an average of 6 iterations, where the steady-state criterion was defined with relative initial residual of dependent variables lower than 10−3. The relative velocity profile of droplet-based laminar flow for one quarter of the channel without the contribution of the droplet's forward movement velocity profile through the channel is shown in Fig. 3. The velocity magnitude is presented using a colour map, while the direction of the fluid flow is represented by velocity vectors. The fluid circulation in the opposite direction of the droplet movement may be observed at the channel wall surfaces, which is balanced by the movement of the fluid in the direction of movement at the middle of the channel. A similar circulation pattern may be observed for the fluid outside the droplet.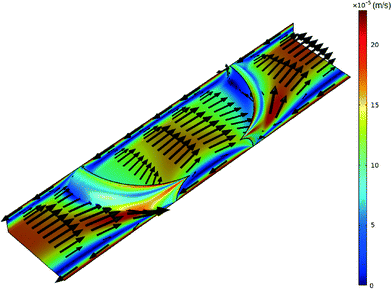 | ||
| Fig. 3 Velocity profile of both phases for the slice at the middle of the channel at a total flow rate of 0.5 μL min−1 of methanol and n-octane. | ||
After determining the velocity profile for stable segmented flow at laminar flow conditions in the microchannel, the concentration profiles of azobenzene in methanol and n-octane at different residence times can be predicted by solving the mass balance equation for solute (azobenzene) at non-steady state conditions (eqn (3)). The diffusion coefficients, Dij, for azobenzene in methanol and n-octane were taken from the literature31 and were 5.0 × 10⁻¹⁰ m2 s−1 and 6.0 × 10⁻¹⁰ m2 s−1, respectively. The partitioning coefficient, Kp, for azobenzene in the n-octane/methanol two-phase system was also taken from the literature31 and was 0.92. The experiments were performed and repeated in the T-shaped microchannel at equal inflows of the continuous (methanol) and dispersed phases (n-octane) with a total flow rate of 0.5 μL min−1, which enabled immediate formation of stable Taylor droplets of the same size and shape (Fig. 2b). At higher flow rates (a few μL min−1 or even higher), droplets become inhomogeneous in size and their flow velocity changes along the microchannel and between the droplets. The concentration of azobenzene used for this experiment (0.2 mg mL−1) appears relatively high for the sensitivity of TLM. Such a high concentration of analyte was, however, employed to reduce the error in the experimental data for those measurement positions in the continuous or dispersive phases where the analyte concentration was low due to the short time available for diffusion, and the corresponding TL signal was much more influenced by the instrumental noise.
A graphical presentation of the microfluidic droplet-based liquid–liquid extraction of azobenzene from methanol to n-octane at different positions along the microchannel (at different droplet residence times) is shown in Fig. 4. It can be observed from the graphical results that the convective mass transport in all three spatial directions dominates over diffusion, since the main change in concentration is observed in the middle of the channel, where the fluid circulation is the largest. However, the transfer of azobenzene across the methanol/n-octane interface is carried out only by the diffusional mass transport, so both macroscopic mass transport mechanisms are involved in the distribution of the solute in the two-phase system during the microfluidic extraction process. The efficiency of the process is limited by the partitioning coefficient, Kp. Comparisons between the simulated results and the online experimental data for the microfluidics droplet-based extraction of azobenzene from the methanol phase to the n-octane phase and the extraction of the solute in the opposite direction are presented in Fig. 5 and 6.
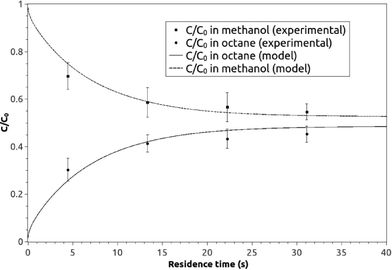 | ||
| Fig. 5 The experimental and model averaged and normalized concentration profiles for the extraction of azobenzene from methanol to n-octane along the microchannel at different residence times. | ||
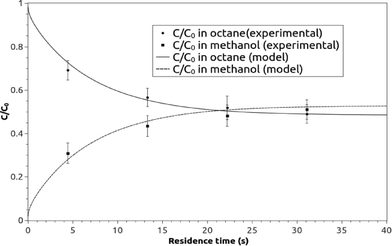 | ||
| Fig. 6 The experimental and model averaged and normalized concentration profiles for the extraction of azobenzene from n-octane to methanol along the microchannel at different residence times. | ||
Each experimental point on the graphs represents the average value of three measurement points in the transverse direction at a specific location (or residence time) along the microchannel (Fig. 2c). The TLM signal proportional to the solute concentration at a certain measurement point was continuously recorded when the slug travelled past this point.
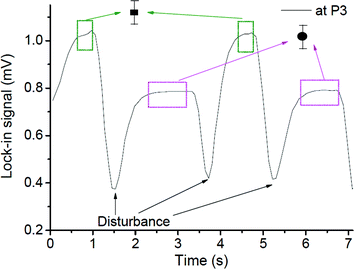
When the interfacial surface between the two phases passed the specific measurement point, the expected disturbance of the signal was observed (e.g. signals close to 1.5, 3.7 and 5.3 seconds for the case shown in Fig. 7). They are due to the diffraction of the probe beam by the refractive index gradients caused by the curved interface between the solvents when a slug is entering or exiting the detection point. To exclude the effects of these disturbances on the determined concentration ratio, only signals from the plateau regions (0.5 s and 1 s time span for the droplet and the continuous phase, respectively, as delineated by the squares in Fig. 7) were averaged and taken into consideration.
The average signals were normalized by the normalization factor (determined as described in the experimental section) to compensate for the differences in the optothermal properties of the two solvents, which result in different thermal lens enhancement factors, and are in turn reflected in different TLM signals for the same analyte concentration in different solvents.33,34 The value of normalization factor was 1.72, which is in good agreement with the theoretical value of 1.86 (found by dividing ((∂n/∂T)/k) ratios for n-octane and methanol).
Fig. 7 furthermore confirms that Taylor flows in combination with TLM can be used in chemical analysis based on liquid–liquid microextraction and derivatization to perform a microfluidic flow injection analysis where the reagents are dissolved in a continuous phase and analyte is extracted from the sample (dispersed phase). Such an approach provides much higher sample throughput compared to continuous parallel microfluidic flows, which were applied earlier.26
None of the model parameters, like the diffusion coefficients of the solute in both phases and partitioning coefficient, were used as fitting parameters, so the proposed model can be defined as validated online due to the good agreement between the model predictions and the online measurements. Moreover, the results show that the theoretical description of the transport phenomena for many chemical and biochemical processes in microfluidics multiphase flows can be described and predicted by macroscale simulation techniques based on the continuum approximation. However, the convection and the diffusion in all spatial directions along with the velocity profile have to be incorporated in the mathematical model to depict the governing transport characteristics of multiphase microfluidics.
Conclusions
A 3D mathematical model, incorporating convection and diffusion in all spatial directions along with the velocity profile, was developed to describe droplet-based liquid–liquid extraction in a microchannel. The model was verified by numerical analysis and validated by online monitoring of the relative solute concentration profiles in two phases within the microchannel. The thermal lens microscopic (TLM) technique coupled with a microfluidic system was used to obtain reliable experimental data with high spatial resolution at different positions inside the microchannel during the studied extraction process in a Taylor flow. The macroscale FE simulation technique based on the continuum approximation was applied to find the numerical solutions of the proposed model, and very good agreement between model calculations and online experimental data was achieved without applying any fitting procedure to the model parameters. Compared to previous reports on TLM in studies of molecular transport, the application of TLM described in this work represents an important step towards studies of microscale molecular processes in complex microfluidic systems, which can in turn serve as an important step for improvement of the selectivity in analytical applications of TLM.The understanding of the fundamental mechanisms involved in fluid flow characteristics at the micro scale is essential since their behaviour affects the transport phenomena and microfluidic applications. Therefore, over-simplifications in the theoretical description of the processes in microflow systems, especially in the cases of complex multi-phase flow patterns, can lead to false predictions in later design and optimization procedures.
Acknowledgements
Financial support by the EU FP7 project BIOINTENSE (grant agreement no. 312148) together with the financial support of the Ministry of Education, Science and Sport of the Republic of Slovenia through grants P2-0191 and P1-0034 is acknowledged.Notes and references
- J. Atencia and D. J. Beebe, Nature, 2005, 437, 648–655 CrossRef CAS PubMed
.
- A. J. DeMello, Nature, 2006, 442, 394–402 CrossRef CAS PubMed
.
- J. El-Ali, P. K. Sorger and K. F. Jensen, Nature, 2006, 442, 403–411 CrossRef CAS PubMed
.
- T. Chovan and A. Guttman, Trends Biotechnol., 2002, 20, 116–122 CrossRef CAS
.
- Z. T. Yu, K. Meng, A. Yong and J. Fu, Small, 2014, 10, 1687–1703 CrossRef CAS PubMed
.
- J. T. Wang, J. Wang and J. J. Han, Small, 2011, 7, 1728–1754 CrossRef CAS PubMed
.
- J. Y. Sim, J. H. Choi, J. M. Lim, S. Cho, S. H. Kim and S. M. Yang, Small, 2014, 10, 3979–3985 CrossRef CAS PubMed
.
- S. Bai, S. Debnath, K. Gibson, B. Schlicht, L. Bayne, M. Zagnoni and R. V. Ulijn, Small, 2014, 10, 285–293 CrossRef CAS PubMed
.
- K. Ohno, K. Tachikawa and A. Manz, Electrophoresis, 2008, 29, 4443–4453 CrossRef CAS PubMed
.
- J. P. McMullen and K. F. Jensen, Org. Process Res. Dev., 2011, 15, 398–407 CrossRef CAS
.
- M. Wörner, Microfluid. Nanofluid., 2012, 12, 841–886 CrossRef
.
- A. L. Dessimoz, L. Cavin, A. Renken and L. Kiwi-Minsker, Chem. Eng. Sci., 2008, 63, 4035–4044 CrossRef CAS PubMed
.
- A. E. Kamholz and P. Yager, Biophys. J., 2001, 80, 155–160 CrossRef CAS
.
- I. Plazl and M. Lakner, Acta Chim. Slov., 2010, 57, 100–109 CAS
.
- J. G. Quinn, Anal. Biochem., 2012, 421, 391–400 CrossRef CAS PubMed
.
- J. R. Burns and C. Ramshaw, Lab Chip, 2001, 1, 10–15 RSC
.
- N. Miložič, M. Lubej, U. Novak, P. Žnidaršič Plazl and I. Plazl, Chem. Biochem. Eng. Q., 2014, 28, 215–223 CrossRef
.
- A. Pohar, P. Žnidaršič Plazl and I. Plazl, Chem. Eng. J., 2012, 189–190, 376–382 CrossRef CAS PubMed
.
- K. Miyamotoa, H. Ichimura, T. Wagner, M. J. Schöning and T. Yoshinobu, Sens. Actuators, B, 2013, 189, 240–245 CrossRef PubMed
.
- B. Ungerböck, A. Pohar, T. Mayr and I. Plazl, Microfluid. Nanofluid., 2013, 14, 565–574 CrossRef
.
- P. Žnidarsič-Plazl and I. Plazl, Lab Chip, 2007, 7, 883–889 RSC
.
- P. A. Auroux, D. Iossifidis, D. R. Reyes and A. Manz, Anal. Chem., 2002, 74, 2637–2652 CrossRef CAS
.
- J. West, M. Becker, S. Tombrink and A. Manz, Anal. Chem., 2008, 80, 4403–4419 CrossRef CAS PubMed
.
- C. L. Cassano, K. Mawatari, T. Kitamori and Z. H. Fan, Electrophoresis, 2014, 00, 1–13 Search PubMed
.
- F. B. Myers and L. P. Lee, Lab Chip, 2008, 8, 2015–2031 RSC
.
- T. Kitamori, M. Tokeshi, A. Hibara and K. Sato, Anal. Chem., 2004, 76, 52A–60A CrossRef CAS
.
- M. Liu and M. Franko, Crit. Rev. Anal. Chem., 2014, 44, 328–353 CrossRef CAS PubMed
.
- K. Sato, M. Yamanaka, T. Hagino, M. Tokeshi, H. Kimura and T. Kitamori, Lab Chip, 2004, 4, 570–575 RSC
.
- M. Liu, D. Korte and M. Franko, J. Appl. Phys., 2012, 111, 033109 CrossRef PubMed
.
- M. Liu and M. Franko, Appl. Phys. B: Lasers Opt., 2014, 115, 269–277 CrossRef CAS
.
- M. Liu, U. Novak, I. Plazl and M. Franko, Int. J. Thermophys., 2014, 35, 2011–2022 CrossRef CAS
.
- K. Sato, M. Tokeshi, T. Sawada and T. Kitamori, Anal. Sci., 2000, 16, 455–456 CrossRef CAS
.
- M. Franko and C. D. Tran, Thermal lens spectroscopy, in Encyclopedia of analytical chemistry, ed. R. A. Meyers, John Wiley & Sons, 2006, 10.1002/9780470027318.a9079 Search PubMed.
- M. Šikovec, M. Franko, M. Novič and M. Veber, J. Chromatogr. A, 2001, 920, 119–125 CrossRef
.
| This journal is © The Royal Society of Chemistry 2015 |

