Future sustainable desalination using waste heat: kudos to thermodynamic synergy†
Muhammad Wakil
Shahzad
a,
Kim Choon
Ng
*a and
Kyaw
Thu
b
aWater Desalination and Reuse Centre, King Abdullah University of Science & Technology, Thuwal, 23955-6900, Saudi Arabia. E-mail: kim.ng@kaust.edu.sa
bME Dept., National University of Singapore, 117576 Singapore
First published on 2nd December 2015
Abstract
There has been a plethora of published literature on thermally-driven adsorption desalination (AD) cycles for seawater desalination due to their favorable environmentally friendly attributes, such as the ability to operate with low-temperature heat sources, from either the renewable or the exhaust gases, and having almost no major moving parts. We present an AD cycle for seawater desalination due to its unique ability to integrate higher water production yields with the existing desalination methods such as reverse osmosis (RO), multi-stage flashing (MSF) and multi-effect distillation (MED), etc. The hybrid cycles exploit the thermodynamic synergy between processes, leading to significant enhancement of the systems' performance ratio (PR). In this paper, we demonstrate experimentally the synergetic effect between the AD and MED cycles that results in quantum improvement in water production. The unique feature is in the internal latent heat recovery from the condenser unit of AD to the top-brine stage of MED, resulting in a combined, or simply termed as MEAD, cycle that requires no additional heat input other than the regeneration of an adsorbent. The batch-operated cycles are simple to implement and require low maintenance when compared with conventional desalination methods. Together, they offer a low energy and environmentally friendly desalination solution that addresses the major issues of the water–energy–environment nexus.
Water impactWe present a low-temperature waste heat driven adsorption desalination (AD) cycle for future sustainable desalination. Through internal heat recovery, it is integrated with multi-effect distillation achieving a quantum jump in water production without increasing overall energy input. The “breakthrough” in thermodynamic synergy between processes offers sustainable and environmentally friendly desalination that solves holistically the water–energy–environment nexus which otherwise eluded the desalination industry. |
Introduction
The Gulf Co-operation Council (GCC) countries suffer from an acute scarcity in potable water availability due to the region's adverse climatic weather. The daily water availability per capita per day in these countries has, in recent decades, fallen drastically below the UN defined acute water stress (AWS) of 500 m3, as shown in Table 1.1–3 The regional water shortage is compounded further by two other factors: firstly, the exponential increase in the population of GCC countries and, secondly, the quest for rapid economic growth of their economies. Confronted by these challenges, the only viable solution for closing the demand–supply water gap of the region is through massive investment into seawater desalination plants. For example, the Kingdom of Saudi Arabia (KSA), United Arab Emirates (UAE) and Kuwait have, respectively, contracted in new desalination capacities of 15, 10.2 and 3.5 million m3 per day, using conventionally proven but energy intensive processes such as reverse osmosis (RO), multi-stage flashing (MSF) and multi-effect distillation (MED). For energy sustainability, innovative low-energy and environmentally friendly desalination methods that can address the holistic targets of the water–energy–environment nexus have to be developed in the near future.4–7| Country | Population (in thousands) 2010 | Projected population (in thousands) 2035 | Per capita water availability (m3) per year by 2035 |
|---|---|---|---|
| Kuwait | 2737 | 4328 | 4.6 ± 1 |
| UAE | 7512 | 11![[thin space (1/6-em)]](https://www.rsc.org/images/entities/char_2009.gif) 042 042 |
13.6 ± 2.0 |
| Qatar | 1759 | 2451 | 21.6 ± 2.0 |
| KSA | 27![[thin space (1/6-em)]](https://www.rsc.org/images/entities/char_2009.gif) 448 448 |
40![[thin space (1/6-em)]](https://www.rsc.org/images/entities/char_2009.gif) 444 444 |
59.3 ± 2.0 |
| Bahrain | 1262 | 1711 | 67.8 ± 3.0 |
| Oman | 2803 | 4922 | 300 ± 10 |
Presently, energy planners of GCC countries have opted to integrate large-scale water desalination plants in situ with the power plants (PP), e.g., the co-location of PP + MED and PP + MSF, where the processes can be cascaded sequentially to maximize not just energetic but also the exergetic utilization of the working steam. Another commonly used but less exergy-efficient scheme is the integration of RO plants operating in remote sites or in tandem with the PP; the latter arrangement shares in situ the seawater intake and discharge facilities, whilst the former operates in remote sites for non-seawater applications. Although a PP + RO configuration squandered the opportunity of maximising the steam's exergy for processes, it is compensated by the efficient salt separation process of membranes. In the PP + MED configuration, the co-generation arrangement can optimize the temperatures and pressure levels between the expanding steam of turbines and the bled-off steam that powers the thermally-driven processes. For example, the world's largest co-generation facility available in Jubail (KSA), operates as an independent water and power plant, generates 2745 MW power and over 800![[thin space (1/6-em)]](https://www.rsc.org/images/entities/char_2009.gif) 000 m3 desalinated water per day simultaneously.
000 m3 desalinated water per day simultaneously.
In 2014, the installed co-generation plants in KSA were reported to consume approximately 1.5 million barrels of oil daily for both water and electricity production; equivalently, this is about 15% of the total daily oil production of Saudi Arabia. Given the KSA's projected GDP and population growth in the coming decades, the predicted domestic oil consumption is expected to exceed its oil production capacity by 2040 in a business-as-usual scenario, as shown in Fig. 1. If such a domestic consumption rate remains unabated, the balance of payments for the Kingdom's economic situation will then be untenable, and moreover, the increase in energy consumption will lead to severe environmental pollution.8,9
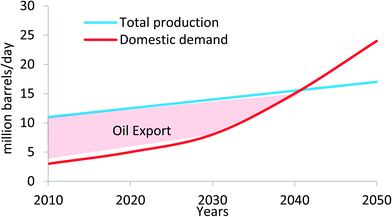 | ||
| Fig. 1 Oil production and domestic use in Saudi Arabia.9 | ||
Within the GCC countries, with their share of 65% of the world's installed desalination capacities, they emit 140–180 million tons of CO2 annually from the desalination plants. At these rates of consumption of electricity and water production, the carbon emission per capita of Middle East and North Africa (MENA) countries will supersede the world's average CO2 emission, as shown in Fig. 2.10,11
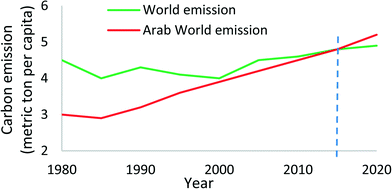 | ||
| Fig. 2 Carbon emission in Arab countries as compared to the world's emissions.10 | ||
In view of the looming energy consumption and pollution increase in KSA, the King Abdul-Aziz City of Science and Technology (KACST) has recently announced the first low-carbon desalination initiative where a utility scale solar-powered desalination plant with a capacity of 60![[thin space (1/6-em)]](https://www.rsc.org/images/entities/char_2009.gif) 000 m3 seawater per day (carried by pipelines from the Gulf) is to be built at the north eastern city of Al Khafji. The proposed project is an integrated solar concentrator photo-voltaics (CPV) of 40 MWelec, which will be built adjacent to a RO plant for potable water. The proposed RO plant needs only half of the power generated, 20 MWelec, whereas the other half will be added to the grid during diurnal periods that will be utilized for nocturnal operation. This initiative by KACST demonstrates the Kingdom's longer term goal of achieving sustainable desalination using renewable solar energy which is available in abundance in the Kingdom. The design comprises many two-axis sun tracking CPV panels, spread over 90 hectares of land, concentrating solar irradiance up to 1000 suns onto homogenizer-mounted multi-junction cells (MJC). They will produce electricity that will power the RO plant at daytime with the excess electricity up-loaded to the grid. Several accompanying hybrid technologies may have to be developed and tested for reliability. One probable approach is a heat-driven multi-effect adsorption (MEAD) cycle that treats the retentate of RO, increasing the water recovery ratio by 45% to 85%. It is a positive step towards achieving a low-carbon, sustainable desalination solution because the processes are energy efficient. In addition to CPV electricity, the harnessing of the rejected heat, from the MJC (CPV) cells at 65 °C to 80 °C, is a heat source for the MEAD cycle. The hybridization results in all the more environmentally friendly seawater desalination.12,13
000 m3 seawater per day (carried by pipelines from the Gulf) is to be built at the north eastern city of Al Khafji. The proposed project is an integrated solar concentrator photo-voltaics (CPV) of 40 MWelec, which will be built adjacent to a RO plant for potable water. The proposed RO plant needs only half of the power generated, 20 MWelec, whereas the other half will be added to the grid during diurnal periods that will be utilized for nocturnal operation. This initiative by KACST demonstrates the Kingdom's longer term goal of achieving sustainable desalination using renewable solar energy which is available in abundance in the Kingdom. The design comprises many two-axis sun tracking CPV panels, spread over 90 hectares of land, concentrating solar irradiance up to 1000 suns onto homogenizer-mounted multi-junction cells (MJC). They will produce electricity that will power the RO plant at daytime with the excess electricity up-loaded to the grid. Several accompanying hybrid technologies may have to be developed and tested for reliability. One probable approach is a heat-driven multi-effect adsorption (MEAD) cycle that treats the retentate of RO, increasing the water recovery ratio by 45% to 85%. It is a positive step towards achieving a low-carbon, sustainable desalination solution because the processes are energy efficient. In addition to CPV electricity, the harnessing of the rejected heat, from the MJC (CPV) cells at 65 °C to 80 °C, is a heat source for the MEAD cycle. The hybridization results in all the more environmentally friendly seawater desalination.12,13
In addition to the solar powered cycle example, the other waste heat driven and yet highly efficient cycles can be explored by the desalination industry. Low temperature heat sources are abundantly available, either from the exhaust of prime movers or from oil and gas refineries. The recent published literature shows a major shift in the process design of conventional heat-driven cycles, particularly those that utilize low temperature heat input for seawater desalination. In this paper, we demonstrate the thermodynamic synergy of the MEAD cycle, leading to a quantum increase in water production. Therefore, there is a great motivation to incorporate hybrid technologies for sustainable desalination in GCC countries.
MEAD cycle
We present the MEAD cycle that combines the multiple reuse of latent energy within evaporators of an AD cycle: it is akin to having the MED system designed as an integral AD evaporator, exploiting a wider range of temperature differentials across the MED stages. The key innovations are as follows: firstly, the recovery of condensed vapour energy, from the re-generation of an AD adsorbent, is delivered to the top-brine stage of MED. The re-use of this latent energy reduces eventually the need for an external cooling tower that reduces the footprint of an AD design. Secondly, the bottom-brine stage of MED is operated at a low evaporative temperature, typically less than 5 °C. It reduces the risk of scaling and fouling because the solubility of sulphate ions SO4− increases with decreasing solution temperatures. The detailed process flow schematic of the new cycle is shown in Fig. 3(a).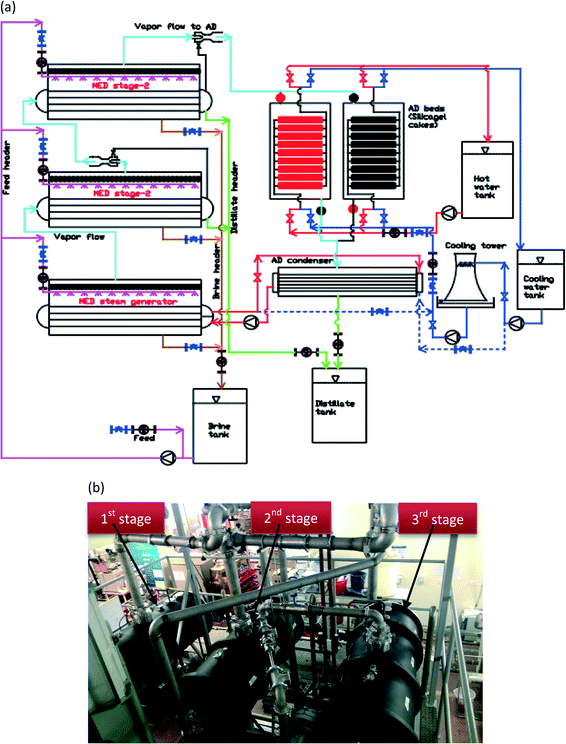 | ||
| Fig. 3 (a) Detailed flow schematic of a 3-stage MEAD cycle with an AD heat recovery loop. (b) A 3-stage MEAD experimental facility at NUS's adsorption desalination laboratory. | ||
Being batch-operated, the AD half-cycle time interval varies from 3 to 10 minutes depending on the low-grade heat source temperatures. The heat source from 55° to 80 °C is used for re-generating the silica gel adsorbent during the desorption half-cycle. However, the top-brine stage of MED recovers the heat emanating from the condenser that increases the vapour uptake of the AD adsorbent due to higher evaporator pressures. For the MED stages, seawater is sprayed in parallel onto the tube surfaces. The vapour produced in the top-brine stage is channelled into the subsequent stages to be reused for seawater evaporation. This process is repeated to the final stage of the MED cycle. The vapour from the last stage is hybridized with the AD cycle.
The distillate (potable water) from all stages and the AD condenser is collected in a tank, whilst the local pressure differences of the stages are accommodated via differential liquid columns of u-tubes. Similarly, the collected brine is re-circulated for more water recovery depending on the local salt concentration. As only recovered energy is used by the hybrid cycle, the electricity consumed is less than 1.3 kW h m−3. The thermal input to the MEAD cycle is deemed to be non-payable because if it is unused, it will be purged into the ambient.
MEAD pilot
We conducted experiments on a 3-stage MEAD hybrid pilot plant to demonstrate the thermodynamic synergy between the cycles, as shown in Fig. 3(b). Each MED vessel has a volume of 0.25 m3 and the heat transfer area of cuprous-nickel tubes is 4 m2, and they are instrumented with pressure, temperature and flow sensors. The top-brine stage of MED is solely powered by the condensed vapour latent energy, recovered from the AD condenser. The cascading condensation and evaporation processes of the MEAD cycle, coupled with the extraction of vapour by the adsorption half-cycle, increase the water production up to 2 to 3 fold over the conventional MED, and the details of these results are presented in the next section.Results and discussion
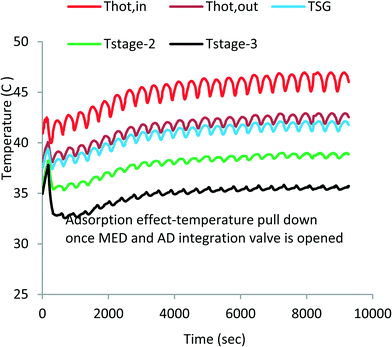
Fig. 4 shows the measured temperature profiles of key components of the MEAD cycle over the first 9000 s to reach cyclic steady state after starting from cold. The top two lines (denoted in red and brown) depict the supply and return hot water temperatures of the top-brine stage of MED. This heat input is derived from the run-around coolant circuit of the condenser–evaporator where latent energy is recovered from desorbed vapour emanating from the AD beds during the desorption processes. The third line (shown in blue) denotes the temperature of the generated vapour in the top-brine or steam generator (SG). The bottom two lines (shown in green and black) are the vapour temperatures of the 2nd and 3rd stages.It can be observed that the MED inter-stage temperature difference (ΔT) varies from 4 °C to 5 °C, indicating the successful operation of the 3-segment evaporator unit. The high ΔT across each MED stage increases the evaporative heat flux of feed water resulting in higher water production. The oscillating heat inputs (as depicted by the water inlet and outlet traces) are caused by the batch-operated cycles of AD beds; one bed undergoes an adsorption process with the vapour drawn from the evaporator, and the other bed undergoes a desorption process where the desorbed vapour condenses on water-cooled condenser. The bed switching interval between adsorption and desorption is 30 s where both beds are isolated from the evaporator and the condenser. Consequently, the vapour generation profiles of the MED stages follow the same temperature trends of the steam generator (SG) but with diminishing magnitude of fluctuations at each subsequent stage.
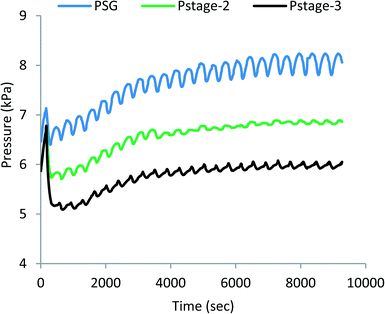
The pressure profiles of MEAD stages are shown in Fig. 5, and correspondingly, they depict similar fluctuations to those observed in the temperature profiles, and the top, middle and bottom traces are the pressures of the steam generator and the 2nd and 3rd stages of MED, respectively. The magnitude of fluctuations also decreases with each subsequent stage, but the pressure drop across the stages is about 1.5 kPa in the first pair and reduces to about 1 kPa in the next pair, indicating an excellent synergetic operation of MED stages.
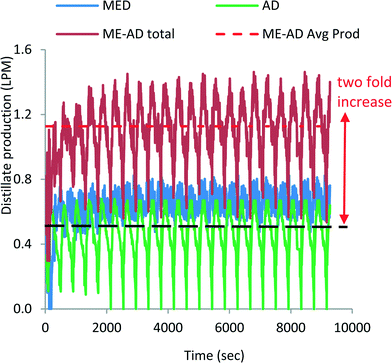
Fig. 6 shows the water production profiles of both the MED stages and the AD condenser. The blue line indicates the water production from 3 MED stages, whilst the green trace is the water production from the AD condenser. The combined distillate production is shown by the dark-orange colour traces, and the dotted-red line is the time-average total water production, achieving about 1.15 LPM from the small pilot unit. The cyclic nature of water production of MED stages is also a consequence of the batch operation of the AD cycle. The hybridization of MEAD cycles has boosted the water production by two-fold (0.56 LPM to 1.15 LPM) of the basic AD cycle which is achieved solely by the recovered heat of the condenser. The other aspect of the cycle is that all major components are stationary except liquid circulation by pumps, and thus, it has a specific power consumption of less than 1.3 kW h m−3. The MEAD stages operate with decreasing brine temperatures with increasing concentrations of brine. Therefore, the tendency for scaling on tube surfaces, from the known soft salts such as SO4−2, is significantly mitigated due to the inverse characteristics of solubility limits at lower brine temperatures. In the MEAD pilot plant, the seawater desalination reached a high concentration of up to 240![[thin space (1/6-em)]](https://www.rsc.org/images/entities/char_2009.gif) 000 mg l−1 without scaling. Such a high concentration application of the MEAD cycle is suited for the treatment of produced water from oil wells where environmental regulations have stringent levels for re-charging of water into the reservoirs.
000 mg l−1 without scaling. Such a high concentration application of the MEAD cycle is suited for the treatment of produced water from oil wells where environmental regulations have stringent levels for re-charging of water into the reservoirs.
In the basic AD, about 42 kW heat input is supplied to re-generate the adsorbent at 80 °C. The lowest evaporator temperature was maintained at about 10 °C, caused by the continued vapour uptake adsorption of the AD cycle, leading to a lower pressure ratio (PR) of 0.5, and the water production rate is 0.56 LPM. However, under the hybrid operation, the water production rate of MEAD has increased from 0.56 to 1.15 LPM. The synergetic operation has increased the PR to 0.96 even though its energy input remains almost same. We believe that the concept of hybridization of the MEAD cycle has great potential for large-scale implementation in seawater desalination. The details of the basic AD cycle operation and adsorbent characteristics can be found in the published literature.14–25 The advanced AD cycle and its hybrid details can be found in published articles.26–33
A simulation of exploiting the latent heat of AD condenser has been conducted. The simulation is conducted on a FORTRAN platform using the international math and state libraries (IMSL) along with the steam–water properties as a function of the pressure and temperature of seawater.35,36 A list of the governing differential equations is provided in the ESI.† At 47 °C heat source temperature, a total of 8 MED stages can be inserted to attain a bottom brine temperature of about 4 °C. Fig. 7 shows the temperature profiles of all stages. The simulation is in good agreement when compared with the experiments: the inter-stage temperature differential is within the same magnitude of the experiments of 4 to 5 K. It is also noted that the oscillations, induced by the AD cycle batch operation and connected to the bottom brine stage, diminish at the higher stages. Fig. 8 shows the respective water production rates of the MEAD cycle, and the total average production rate is 5.5 LPM.
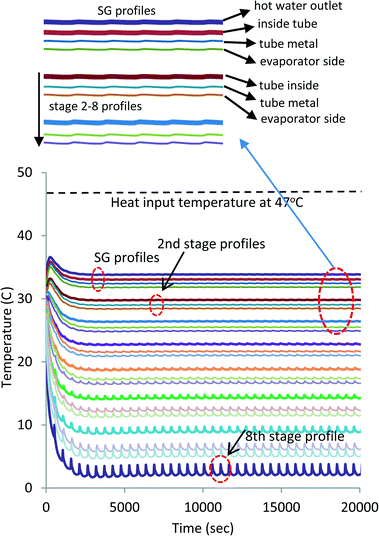 | ||
| Fig. 7 Projected 8-stage MEAD temperature profiles for full exploitation of the recovered energy of the condenser. | ||
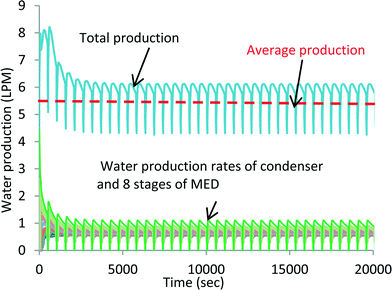 | ||
| Fig. 8 Water production profiles of MEAD by exploiting the total recovered latent energy of the condenser. | ||
The comparison between the basic AD, the 3-stage MEAD experiments and the simulated 8-stage MEAD is summarized in Table 2: three parameters are presented, namely, water production (in LPM), power input (in kW) and performance ratio (PR). The PR is defined here as the ratio of the energy of the distillate produced to the power input.34
The simulation demonstrates the maximum possible number of MED stages powered solely by using the recovered heat of the condenser at 47 °C. The kudos effect of thermodynamic synergies in between the stages and the AD cycle has yielded a high water production rate and hence performance ratio. A sustainable solution for seawater desalination using the highly-efficient MEAD cycle is achievable and it can address the key issues of the water–energy–environment nexus.
Conclusions
We have successfully demonstrated the efficacy of a hybrid MEAD desalination cycle that can be operated with low temperature waste heat or renewable energy source. The experiments confirmed the efficacy of thermodynamic synergy between AD and MED cycles. At the same heat source input, the simulation indicates that a maximum PR of 4.8 can be reached. These investigations demonstrate the kudos of innovative technology for cost-competitive and sustainable desalination of seawater.Nomenclature
Subscripts
| hw | Hot water |
| in | Inside/tube side |
| v | Vapor/gas |
| out | Outside/vapor space |
| f | Liquid/feed |
| g | Gas |
| b | Brine |
| HX | Heat exchanger |
| sat | Saturation |
| ref | Reference |
| cond | Condenser |
| ads | Adsorption |
Acknowledgements
The authors would like to thank the King Abdullah University of Science & Technology (KAUST) (Project no. 7000000411) and the National Research Foundation (NRF) Singapore (grant WBS no. R-265-000-399-281) for project financial support.Notes and references
- The demographic profile of Saudi Arabia, http://www.escwa.un.org/popin/members/saudi%20arabia.pdf (accessed March 2015).
- K. Mogelgaard, Why population matters to water resources, http://populationaction.org/wp-content/uploads/2012/04/PAI-1293-WATER-4PG.pdf (accessed May 2015).
- Tarek El Sayed, Attaining a sustainable water sector in the GCC, managing supply and demand, building institutions, A report by Strategy&, formerly Booz & Company, Published May 8, 2014 Search PubMed.
- About Saudi Arabia, water sources, http://www.saudiembassy.net/about/country-information/agriculture_water/Water_Resources.aspx (accessed May 2015).
- KSA water consumption, Arab news, http://www.arabnews.com/news/532571 (accessed June 2015).
- Z. Liu, H. Bai, J. Lee and D. D. Sun, Energy Environ. Sci., 2011, 4, 2582 CAS.
- C. Forrestal, P. Xu and Z. Ren, Energy Environ. Sci., 2012, 5, 7161 CAS.
- Desalination from oil power to solar power?, Saudi Gazette, http://www.saudigazette.com.sa/index.cfm?method=home.regcon&contentid=20130415161471 (accessed June 2015).
- M. Dziuban, Scarcity and Strategy in the GCC, Gulf Analysis Paper, Middle East Program, 2011, http://www.csis.org/mideast (accessed May 2015).
- S. Muttoo, Carbon Opportunities in the Gulf, http://www.strategicforesight.com/inner-articles.php?id=153#.VSG0evmUeN0 (accessed May 2015).
- K. Elgendy, Two Trends of Energy and Carbon Emissions in the Arab World, http://www.carboun.com/energy/two-trends-of-energy-and-emissions-in-the-arab-world/ (accessed April 2015).
- King Abdullah Initiative for Solar Water Desalination, KACST, http://kacstwatertech.org/eng/presentatoins/Day1/Session_1_1/Turki.pdf.
- M. Picow, Saudi Arabia to Replace Oil with Sun Power for Desalination Plants, http://www.greenprophet.com/2010/02/saudi-arabia-desalination-solar/ (accessed March 2015).
- K. Thu, K. C. Ng, B. B. Saha, A. Chakraborty and S. Koyama, Int. J. Heat Mass Transfer, 2009, 52, 1811–1816 CrossRef CAS.
- K. C. Ng, K. Thu, A. Chakraborty, B. B. Saha and W. G. Chun, Int. J. Low-Carbon Technol., 2009, 4, 61–67 CrossRef.
- B. B. Saha, K. C. Ng, A. Chakraborty and K. Thu, Cooling India, 2009, 72–78 Search PubMed.
- K. Thu, A. Chakraborty, B. B. Saha, W. G. Chun and K. C. Ng, Desalin. Water Treat., 2010, 20, 1–10 CrossRef CAS.
- B. B. Saha, K. C. Ng, A. Chakraborty and K. Thu, Cooling India, 2010, 22–26 Search PubMed.
- K. Thu, B. B. Saha, A. Chakraborty and K. C. Ng, Int. J. Heat Mass Transfer, 2011, 54, 43–51 CrossRef CAS.
- A. Chakraborty, K. C. Leong, K. Thu, B. B. Saha and K. C. Ng, Appl. Phys. Lett., 2011, 98, 221910 CrossRef.
- K. C. Ng, K. Thu, B. B. Saha, A. Chakraborty and W. G. Chun, Int. J. Refrig., 2011, 35, 685–693 CrossRef.
- K. Thu, A. Chakraborty, Y.-D. Kim, A. Myat, B. B. Saha and K. C. Ng, Desalination, 2013, 308, 209–218 CrossRef CAS.
- K. C. Ng, K. Thu, Y. D. Kim, A. Chakraborty and G. Amy, Desalination, 2013, 308, 161–179 CrossRef CAS.
- K. Thu, Y. D. Kim, A. Myat, A. Chakraborty and K. C. Ng, Desalin. Water Treat., 2013, 51, 150–163 CrossRef CAS.
- K. Thu, H. Yanagi, B. B. Saha and K. C. Ng, Int. J. Heat Mass Transfer, 2013, 65, 662–669 CrossRef CAS.
- M. W. Shahzad, K. Thu, K. C. Ng and W. G. Chun, Desalin. Water Treat., 2015, 1–10 Search PubMed.
- M. W. Shahzad, K. C. Ng, K. Thu, B. B. Saha and W. G. Chun, Appl. Therm. Eng., 2014, 72, 289–297 CrossRef CAS.
- K. Thu, Y.-D. Kim, G. Amy, W. G. Chun and K. C. Ng, Appl. Energy, 2013, 104, 810–821 CrossRef CAS.
- K. Thu, Y.-D. Kim, G. Amy, W. G. Chun and K. C. Ng, Appl. Therm. Eng., 2014, 62, 245–255, DOI:10.1016/j.applthermaleng.2013.09.023.
- M. W. Shahzad, K. Thu, B. B. Saha and K. C. Ng, Evergreen: Jt. J. Novel Carbon Resour. Sci. Green Asia Strategy, 2014, 01–02, 30–36 Search PubMed.
- K. C. Ng, K. Thu, M. W. Shahzad and W. Chun, IDA J. Desalin. Water Reuse, 2014, 6(1), 44–56 CrossRef CAS.
- K. C. Ng, K. Thu, S. J. Oh, L. Ang, M. W. Shahzad and A. B. Ismail, Desalination, 2015, 356, 255–270 CrossRef CAS.
- M. W. Shahzad, K. Thu, Y. D. Kim and K. C. Ng, Appl. Energy, 2015, 148, 273–281 CrossRef.
- J. H. Lienhard, M. A. Antar, A. Bilton, J. Blanco and G. Zaragoza, ISSN: 1049-0787; ISBN: 1-978-56700-311-6/12, http://web.mit.edu/lienhard/www/papers/reviews/Solar_Desalination_AnnRevHeatTransfer-Vol15-2012-4659.pdf (accessed Nov. 2015).
- F. W. Dittus and L. M. K. Boelter, Int. Commun. Heat Mass Transfer, 1985, 12, 3–22 CrossRef.
- M. W. Shahzad, A. Myat, W. G. Chun and K. C. Ng, Appl. Thermal Eng., 2013, 50, 670–676 CrossRef CAS.
Footnote |
| † Electronic supplementary information (ESI) available. See DOI: 10.1039/c5ew00217f |
| This journal is © The Royal Society of Chemistry 2016 |

