
 Open Access Article
 This Open Access Article is licensed under a Creative Commons Attribution-Non Commercial 3.0 Unported Licence
Can meta-omics help to establish causality between contaminant biotransformations and genes or gene products?
David R.
Johnson
a,
Damian E.
Helbling
b,
Yujie
Men
c and
Kathrin
Fenner
*cd
aDepartment of Environmental Microbiology, Eawag, Dübendorf, Switzerland
bSchool of Civil and Environmental Engineering, Cornell University, Ithaca, NY, USA
cDepartment of Environmental Chemistry, Eawag, Dübendorf, Switzerland. E-mail: kathrin.fenner@eawag.ch; Fax: +41 58 765 5802; Tel: +41 58 765 5085
dDepartment of Environmental Systems Science, ETH Zürich, Zürich, Switzerland
First published on 25th March 2015
Abstract
There is increasing interest in using meta-omics association studies to investigate contaminant biotransformations. The general strategy is to characterize the complete set of genes, transcripts, or enzymes from in situ environmental communities and use the abundances of particular genes, transcripts, or enzymes to establish associations with the communities' potential to biotransform one or more contaminants. The associations can then be used to generate hypotheses about the underlying biological causes of particular biotransformations. While meta-omics association studies are undoubtedly powerful, they have a tendency to generate large numbers of non-causal associations, making it potentially difficult to identify the genes, transcripts, or enzymes that cause or promote a particular biotransformation. In this perspective, we describe general scenarios that could lead to pervasive non-causal associations or conceal causal associations. We next explore our own published data for evidence of pervasive non-causal associations. Finally, we evaluate whether causal associations could be identified despite the discussed limitations. Analysis of our own published data suggests that, despite their limitations, meta-omics association studies might still be useful for improving our understanding and predicting the contaminant biotransformation capacities of microbial communities.
Water impactOne of the main challenges in contaminant biotransformation research is to identify the genes or gene products that cause or affect particular biotransformations. Meta-omics association studies are rapidly gaining attention as a possible approach to address this challenge, but meta-omics association studies have inherent limitations of both technical and biological natures. While the technical limitations have been discussed in detail (e.g., accuracy of functional annotations, sequencing depth, etc.), the biological limitations remain largely unaddressed. In this perspective manuscript, we describe general biological scenarios that could prevent meta-omics association studies from identifying the genes or gene products that cause particular contaminant biotransformations. We next explore our own published data to test the relevance of the discussed biological scenarios. We finally synthesize our findings and present our perspective about the potential of meta-omics investigations to investigate contaminant biotransformations in the face of their inherent biological limitations. |
Why use meta-omics association studies?
Biotransformation mediated by environmental microbial communities is one of the most efficient mechanisms to reduce environmental exposure to chemical contaminants.1,2 Our ability to predict the potential of a microbial community to biotransform specific chemical contaminants is therefore important not only for chemical risk assessment3 but also for environmental engineering applications such as soil bioremediation, wastewater treatment, and drinking water production.4,5 Establishing the relationships between particular contaminant biotransformations and the genes or gene products (i.e., transcripts or enzymes) that cause or promote those biotransformations is important for understanding and predicting the biotransformation capacity of a complex microbial community.6,7Conventionally, establishing causal relationships between contaminant biotransformations and genes or gene products has been achieved by characterizing microorganisms in pure or enrichment cultures where the contaminant of concern serves as a growth substrate and the responsible genes or gene products could be directly enriched and characterized.8–10 An important limitation of this approach is that it is susceptible to culturing biases and can lead to the enrichment of microorganisms, genes, or gene products that are environmentally irrelevant.11 A second limitation is that the approach is often not appropriate for co-metabolic contaminant biotransformations, which are likely important biotransformation mechanisms for trace organic contaminants.12,13 The main problem is that co-metabolic biotransformations do not support growth, thus making it challenging to directly enrich the responsible microorganisms, genes, and gene products. This problem also affects other recent methodological advances in the field of contaminant biotransformation research, such as stable isotope probing (SIP) or microautoradiography combined with fluorescence in situ hybridization (MAR-FISH). These methods rely on the incorporation of isotope-labelled compounds into new biomass14,15, and are therefore not likely to be helpful for identifying the biological determinants of co-metabolic biotransformations.
Given these limitations along with the increasing accessibility of high-throughput sequencing and mass spectrometry techniques, there is growing interest in using molecular data generated via meta-omics methodologies (i.e., methodologies that attempt to characterize the complete set of genes, transcripts, or enzymes of a community) to elucidate causal associations with biotransformations.16–20 The general strategy is to isolate and characterize aggregate DNA, RNA, or proteins from in situ environmental communities and use the abundances of genes or gene products to establish associations that reflect the communities' potential for biotransforming one or more contaminants (referred to here as a meta-omics association study). In this context, we use the term “association” to refer to a statistical relationship between two variables, which may be described quantitatively (e.g., a linear or monotonic relationship) or qualitatively (e.g., a co-occurrence relationship). The associations can then be used to generate hypotheses about possible causal relationships between contaminant biotransformations and particular genes or gene products. Important advantages of meta-omics association studies are that they avoid culturing biases, do not require that the contaminants of interest be used as growth substrates, and may help to identify the responsible organisms.
Overarching challenge
While powerful, an important limitation of meta-omics association studies is that they typically invoke the principle of “guilt by association”. The principle can be illustrated as follows: consider a meta-omics association study that tests for associations between the rate of a particular contaminant biotransformation and the abundance of a particular gene or gene product. If a positive association is observed, then it generates the hypothesis that the associated gene or gene product causes or promotes that biotransformation. Further experiments are then required to explicitly test the validity of that hypothesis. While the principle of “guilt by association” is undoubtedly useful for particular types of investigations,21,22 we believe there are significant challenges when applying the principle to meta-omics association studies with microbial communities. Below we discuss three potential limitations of the principle. We note that we do not consider limitations of a technical nature, such as inaccurate annotations of enzyme functions or insufficient sequencing depth. While these technical limitations may mask genuine associations or generate false associations, they have been discussed in detail elsewhere23. We instead focus on limitations that we believe are valid regardless of the quality or completeness of the meta-ome dataset, and are therefore likely to persist regardless of future technological advances.Limitation 1: an association may reflect a genuine but non-causal relationship
A meta-omics association study could, in principle, generate large numbers of associations that are genuine (i.e., they are not Type I or false positive errors) but nevertheless do not emerge from causal relationships between specific genes or gene products and a particular contaminant biotransformation (we refer to these as genuine but non-causal associations). While genuine but non-causal associations are of value for certain types of ecological questions (e.g. assessing co-occurrence patterns and generating hypotheses about potential interactions), they are unlikely to help identify the genes or gene products that cause or promote a particular biotransformation. Instead, their presence could make it exceedingly difficult to experimentally validate which of the associated genes or gene products actually cause or promote the biotransformation of interest. Below we describe three general scenarios that could lead to the generation of genuine but non-causal positive associations (Fig. 1). We note that we do not discuss general scenarios that could generate genuine but non-causal negative associations. While negative associations are of value, they are unlikely to generate meaningful hypotheses about the genes or gene products that cause or promote a particular biotransformation. Thus, unless specifically stated, we use the term association to refer to a positive association for the remainder of this manuscript.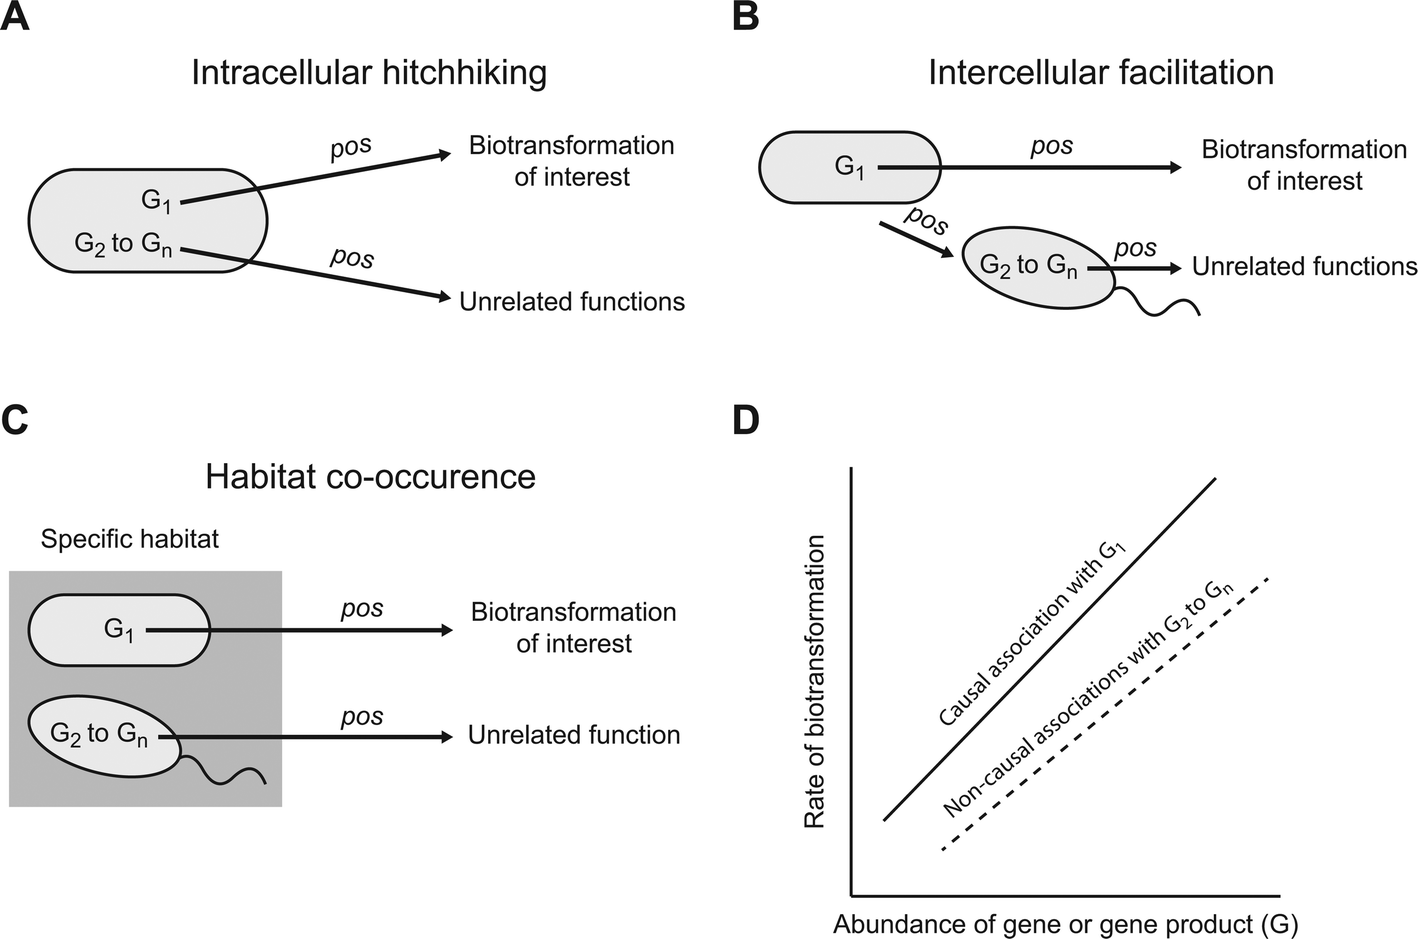 | ||
| Fig. 1 Possible scenarios that could generate genuine but non-causal positive associations. G1 is a gene or gene product that causes or promotes a particular biotransformation of interest while G2–Gn are genes or gene products that perform unrelated functions. There are at least three plausible scenarios whereby the abundances of G2–Gn could associate with the rate of that particular biotransformation, including (A) intracellular hitchhiking, (B) intercellular facilitation, and (C) habitat co-occurrence. (D) Each of these three plausible scenarios could generate genuine but non-causal positive associations. While we use linear positive associations for illustrative purposes, any monotonic positive association could occur. | ||
One general scenario is “intracellular hitchhiking” (Fig. 1A). Consider a microbial strain that carries a gene or gene product (designated as G1) that causes or promotes a particular contaminant biotransformation (Fig. 1A). Because G1 causes or promotes that biotransformation, we might expect a causal association between the abundance of G1 and the rate of that particular biotransformation (Fig. 1D; the relationship is depicted as linear for simplicity, but could be of any monotonic form). However, the same strain that carries G1 likely carries many other genes or gene products (designated as G2 to Gn) that cause or promote entirely unrelated functions. For example, G2 might be an enzyme that biotransforms a different substrate but continues to be synthesized even when that substrate is not present within the cell's local environment (i.e., the enzyme is constitutively expressed).24–26 The consequence is that, even though causal relationships do not exist between G2 to Gn and the biotransformation of interest, the co-occurrence of G2 to Gn and G1 within the same cell could generate large numbers of genuine but non-causal associations (Fig. 1D; the relationships are again depicted as linear for simplicity, but could be of any monotonic form). Considering that a single microbial strain typically carries several thousand genes and gene products, the size of G2 to Gn could be exceedingly large and “intracellular hitchhiking” could result in far more genuine but non-causal associations than causal associations.
A second general scenario is “intercellular facilitation” (Fig. 1B). Consider again a microbial strain that carries G1 that causes or promotes a particular contaminant biotransformation (Fig. 1B). We might again expect an association between the abundance of G1 and the rate of that particular biotransformation (Fig. 1D). However, the same strain that carries G1 might perform another function that positively affects the growth of a second microbial strain. For example, the strain that carries G1 might secrete a metabolite that promotes the growth of the second strain.27,28 If the second strain carries other genes or gene products (designated as G2 to Gn) that do not affect the biotransformation of interest, the abundances of G2 to Gn might nevertheless associate with the rate of that biotransformation even though they do not cause or promote that biotransformation (Fig. 1D). The result is again a potentially large number of genuine but non-causal associations. Moreover, for every additional “intercellular facilitation”, there is a new set of genuine but non-causal associations that could emerge by “intracellular hitchhiking”, thus leading to potentially large numbers of genuine but non-causal associations.
A third general scenario is “habitat co-occurrence” (Fig. 1C). Consider two different microbial strains that co-occur together in a particular habitat but do not otherwise interact with each other. For example, the two strains might be particularly well adapted to a specific environment such as plant root surfaces, arctic lakes, or hot springs. One strain carries gene or gene product G1 that causes or promotes a particular contaminant biotransformation while the other strain carries genes or gene products G2 to Gn that do not cause or promote that biotransformation. The consequence of habitat co-occurrence is that, while only G1 causes or promotes that biotransformation, genuine but non-causal associations could occur between the abundances of G2 to Gn and the rate of that biotransformation. This scenario is especially likely when meta-omics association studies are conducted across one or more environmental gradients, which is often the case.29 Moreover, for every additional co-occurring strain there are again new sets of possible genuine but non-causal associations that could emerge by “intracellular hitchhiking” and “intercellular facilitation”, thus leading to even larger numbers of genuine but non-causal associations.
While the above arguments may appear pessimistic, we presented these arguments as if only one microbial strain carries G1, and therefore only one strain is responsible for a particular contaminant biotransformation. This may not be the typical case, and instead a large number of different strains might carry G1 and contribute to that particular contaminant biotransformation. If G1 were widely distributed among different strains (i.e., if there were many strains that carry G1), then this could prevent the emergence of some genuine but non-causal associations. For example, consider intracellular hitchhiking. If many strains carry G1, but carry somewhat different compositions of G2 to Gn, then this could weaken or prevent the emergence of genuine but non-causal associations with any particular member of G2 to Gn. Therefore, it remains unclear, and most likely depends on the functions examined, how pervasive genuine but non-causal associations may be when using meta-omics association studies.
To test for evidence of pervasive non-causal associations, we examined data from our own recent research on contaminant biotransformations by activated sludge communities. We performed a meta-transcriptome association study where we used readily available sequencing methodologies to quantify the associations between the abundances of 5200 different transcripts and the biotransformation rate constants for atenolol among ten different wastewater treatment plant (WWTP) communities. All of the original data have been published elsewhere29–31 and are publically available (MG-RAST project number 6015 using the SEED subsystems database and an e-value cutoff of 10−5). We reasoned that, if the three general scenarios described for Limitation 1 are pervasive, then the distribution of significant associations should be skewed towards positive associations (i.e., all three of the general scenarios generate genuine but non-causal positive associations). In contrast, if the three general scenarios described for Limitation 1 are no more pervasive than scenarios that could generate negative associations, then the distribution of significant associations should be distributed about zero (i.e., there should be an approximately equal number of positive and negative associations). Indeed, we observed data that is consistent with the former expectation. The distribution of correlation coefficients with the biotransformation rate constants for atenolol showed a clear bias towards positive values (Fig. 2A) and the mean value of 0.16 was significantly greater than zero (P < 10−16; one-tailed, one-sample student's t-test). Moreover, when we randomized the biotransformation rate constants of atenolol across the ten WWTPs and re-calculated the correlation coefficients, the distribution of correlation coefficients was centered about zero (Fig. 2B) and the mean was not significantly different from zero (P > 0.05; two-tailed, one-sample student's t-test). These outcomes therefore provide support that the three general scenarios described for Limitation 1 are of potential concern and may indeed generate significant numbers of genuine but non-causal associations.
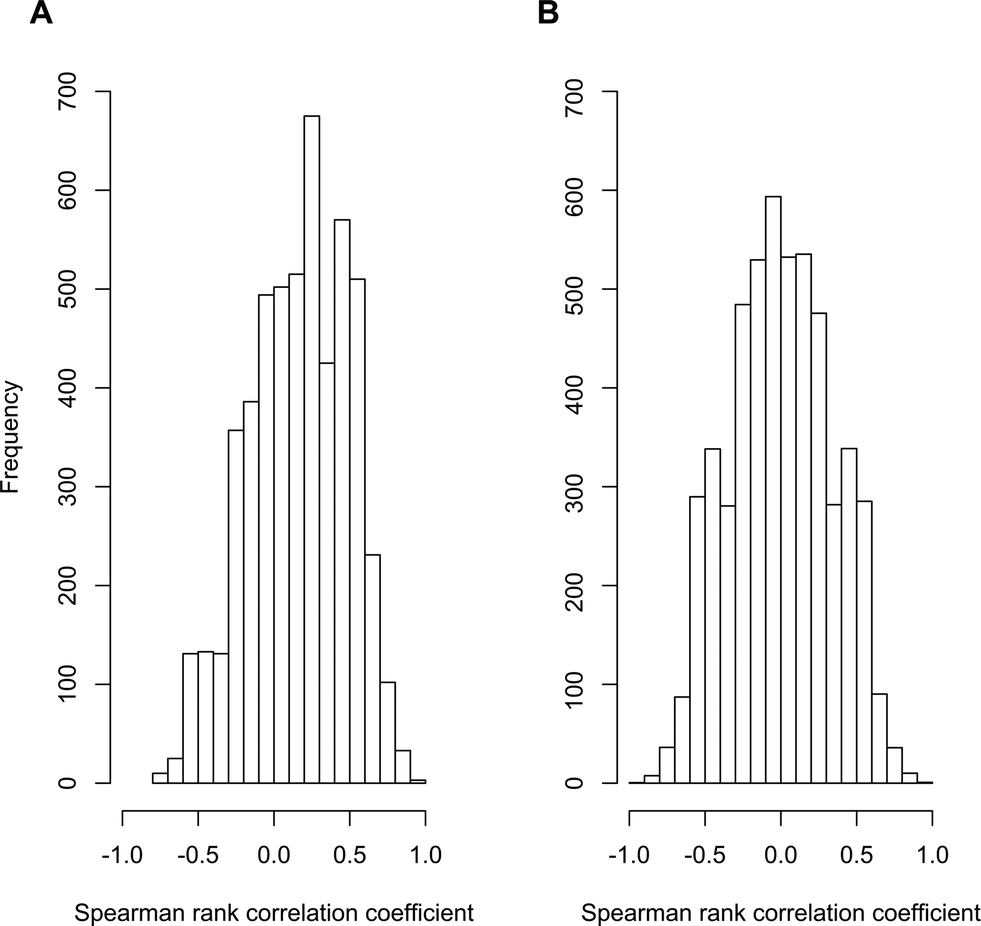 | ||
| Fig. 2 Distribution of correlation coefficients for the associations between atenolol biotransformation rate constants and transcript abundances. Frequency distribution of Spearman rank correlation coefficients (A) between transcript abundances and the measured atenolol biotransformation rate constants among the ten activated sludge communities sourced; and (B) between transcript abundances and the randomly scrambled atenolol biotransformation rate constants. Transcript abundances were obtained from the meta-transcriptome association study described in the text. | ||
Limitation 2: a causal relationship may not result in an association
Another typical assumption of the “guilt by association” principle is that a causal relationship between a gene or gene product and a biotransformation must lead to a positive association between the abundance of that gene or gene product and the rate of that biotransformation. However, this need not necessarily be true. Below we identify three general scenarios whereby a causal relationship between a gene or gene product and a biotransformation might not result in a positive association (Fig. 3).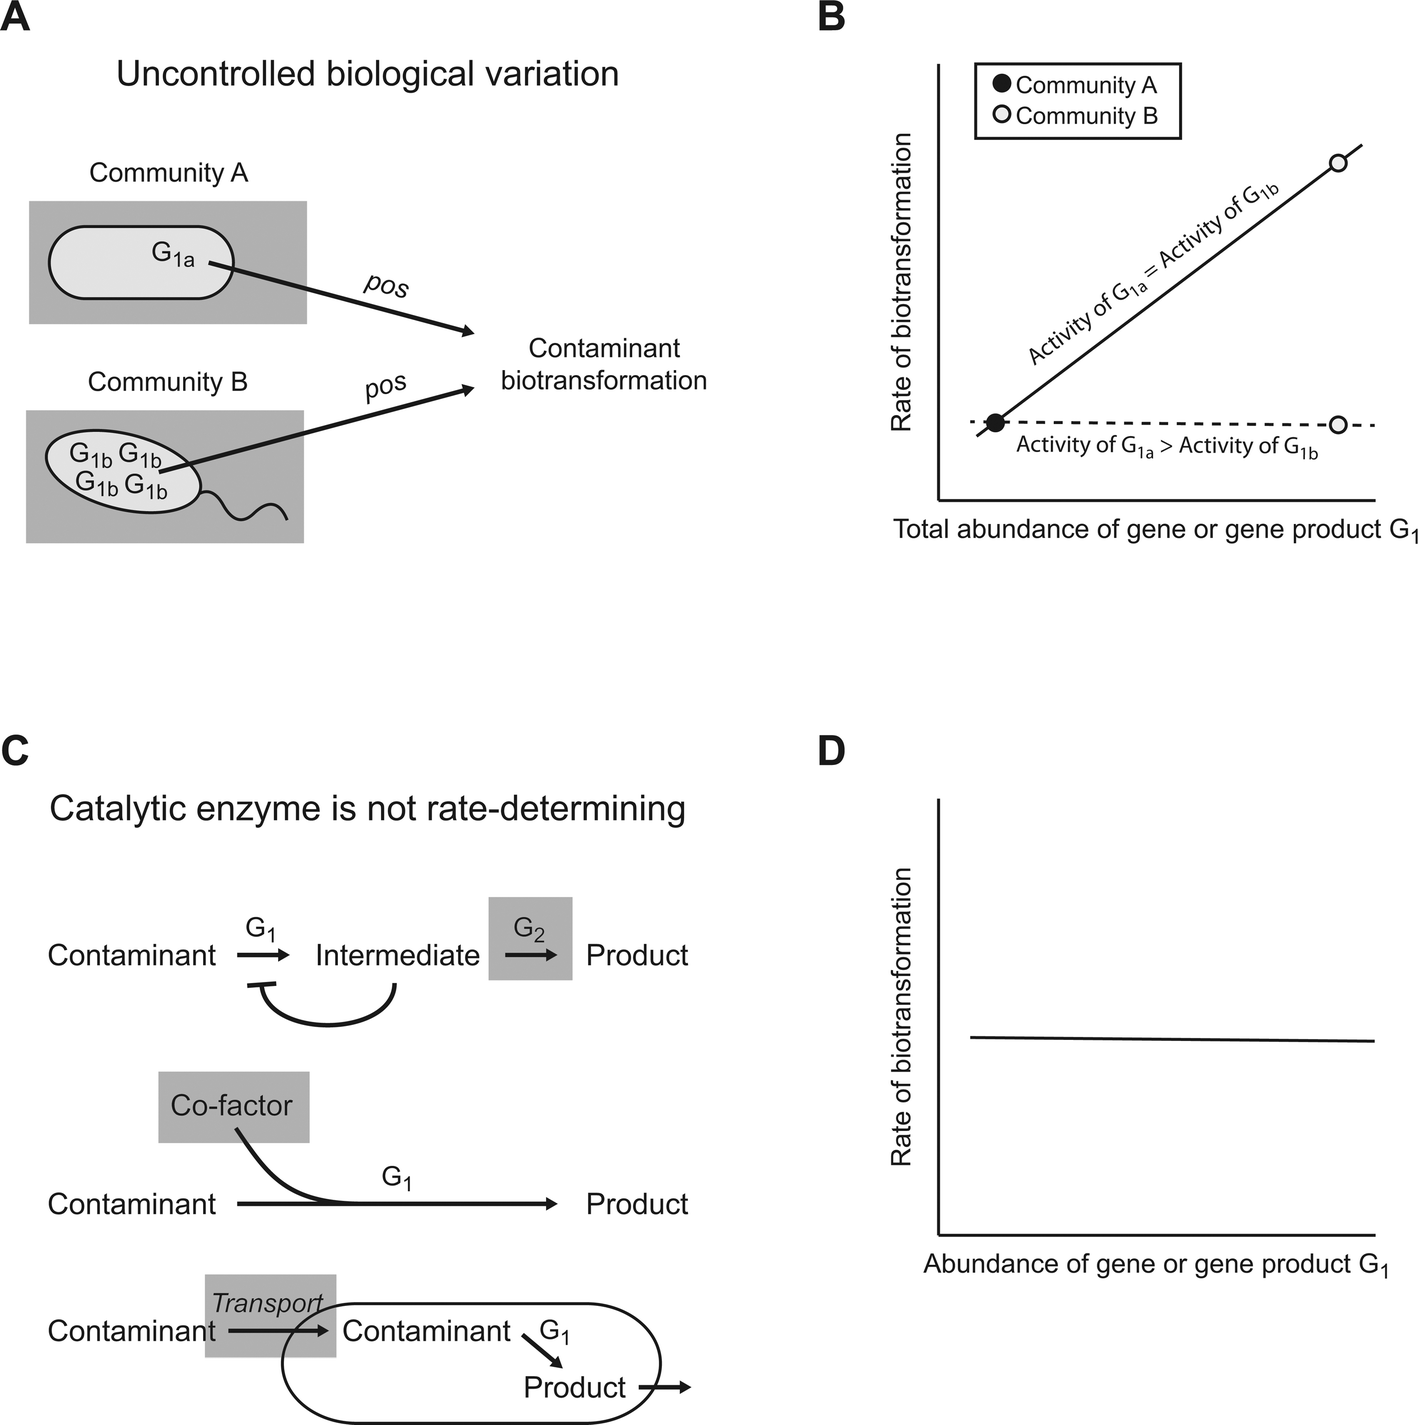 | ||
| Fig. 3 Possible scenarios that could prevent a causal association from emerging. G1 is a gene or gene product that catalyzes a particular biotransformation of interest. There are at least two plausible scenarios whereby the abundance of G1 might not associate with the rate of that particular biotransformation. (A) Uncontrolled biological variation, such as differences in the catalytic activities of different enzyme variants (G1a and G1b), could affect the association. (B) The association may be positive or may disappear completely depending on the relative catalytic activities of the different variants of G1. While we use linear associations for illustrative purposes, any monotonic association could occur. (C) The catalytic enzyme might not determine the rate of a particular biotransformation. In these scenarios, the shaded elements indicate potential alternative determinants of the rate of a particular biotransformation. (D) This would result in no association. | ||
One general scenario is uncontrolled biological variation (Fig. 3A). As an illustrative example, consider a situation where there are two variants of the enzyme G1 (designated G1a and G1b) that catalyze a particular contaminant biotransformation, but each variant is expressed preferentially in different microbial communities (Fig. 3A). If the catalytic activities of G1a and G1b were identical, then we would expect an association between the total abundance of G1 (i.e., the sum of G1a and G1b) and the rate of that particular biotransformation among the different microbial communities (Fig. 3B; the relationships are depicted as linear for simplicity, but could be of any monotonic form). However, if the catalytic activity of G1a were greater than that of G1b, then the association between the total abundance of G1 and the rate of that particular biotransformation may weaken or, in an extreme case, disappear (Fig. 3B; although community B expresses large numbers of G1b, it has a low biotransformation rate because of the poor catalytic activity of G1b). Such a scenario is biologically plausible, as different variants of the same class of enzymes can have surprisingly different catalytic activities.32
A second general scenario is that the abundance of the catalytic enzyme does not determine the rate of a particular contaminant biotransformation (Fig. 3C). Instead, other factors may determine the rate of that particular biotransformation. For example, the rate might be determined by the accumulation of metabolic intermediates within the cell that repress the activity of the catalytic enzyme (i.e., product inhibition).24 In this case, the rate might be determined by the abundance of downstream enzymes that consume the intermediates (Fig. 3C, enzyme G2). Alternatively, the rate might be determined by the availability of co-factors required for enzyme activity33 or by the transport of the contaminant into the cell.34 For all of these cases, the abundance of the genes or gene products for the catalytic enzyme may not associate with the rate of that particular biotransformation (Fig. 3D), regardless of the fact that the catalytic enzyme causes that particular biotransformation.
Finally, a third general scenario is that proportional relationships might not exist between different levels of genetic information processing, enzyme synthesis, and enzyme activity. A wide range of transcriptional, translational, and post-translational regulation mechanisms are known that may prevent the number of genes, transcripts, or enzymes from associating with enzyme activities.35 In other words, two communities with identical abundances of a particular gene or enzyme might nevertheless have substantially different enzyme activities. In extreme cases, these regulatory mechanisms could completely prevent an association from emerging between the abundances of genes or gene products and enzyme activities.
Limitation 3: multiple comparisons
In our view, a single aspect of meta-omics exemplifies both an important potential and a major peril of meta-omics association studies; meta-omics methodologies can quantify the abundances of many thousands of different genes and gene products in parallel. The potential is that we can test for associations between the abundances of an unprecedented number of genes or gene products and the rate of a particular contaminant biotransformation, thus enabling highly comprehensive explorations when there are no a priori expectations of the responsible genes or gene products. For example, using our own data, we could test whether each of the approximately 5200 different transcripts associates with the biotransformation rate constants for atenolol. The peril, however, is that we create an enormous multiple hypothesis testing problem. Multiple hypothesis testing occurs when one uses the same dataset (in this case a metatranscriptome dataset) to test more than one hypothesis. Consider a scenario where we want to test for associations between the abundances of individual genes or gene products and the rate of a particular biotransformation at a significance level of 0.05. If we test for associations with 20 different genes or gene products, then we would expect one false association (20 tests × 0.05 significance level). However, if we test for associations with 5200 individual genes or gene products, then we would expect 260 false associations (5200 tests × 0.05 significance level). Thus, the number of false associations could far exceed the number of genuine associations. How then do we separate false associations from genuine associations?The conventional approach to address this problem is to adjust the required significance level for multiple hypothesis testing. The simplest (but among the least powerful) method is the Bonferroni correction, which controls the family-wise error rate.36 As an illustrative example, assume that we want to test each individual hypothesis at a significance level of 0.05. In order to maintain this individual significance level after multiple hypothesis testing, we would define an effective required significance level as the desired significance level for an individual hypothesis test divided by the number of hypotheses tested. Thus, if the desired significance level for an individual hypothesis test is 0.05, then the effective required significance level is 0.05/5200 or 9.6 × 10⁻⁶.
Unfortunately, most meta-omics association studies with microbial communities do not analyze sufficient numbers of independent samples (designated as n) to obtain P-values that are equal to or smaller than this value. As a concrete example, we measured the correlation coefficients between the abundances of each of the 5200 transcripts from our previous study and the rate of ammonia removal (available for nine of the ten activated sludge communities37). In this case, we had prior knowledge that the abundance of ammonia monooxygenase transcripts causally associated with the rate of ammonia removal.30 Given this prior knowledge, we asked the following question: for the association between the number of ammonia monooxygenase transcripts and the rate of ammonia removal, how many independent activated sludge metatranscriptomes (n) would we have had to sequence in order for the correlation coefficient to be significant after accounting for multiple hypothesis testing? We can readily estimate this because the P-value solely depends on the magnitude of the correlation coefficient and n. We specified the desired P-value at 9.6 × 10⁻⁶ and measured the magnitude of the correlation coefficient (rho = 0.78, unpublished data), thus leaving n as the only unknown variable. We found that n = 24, which means that we would have had to sequence at least 24 activated sludge metatranscriptomes for the correlation coefficient, and thus the known causal association, to be statistically significant. While sequencing the metatranscriptomes of 24 activated sludge communities is within the capabilities of some environmental microbiology laboratories, it far exceeds the amount of sequencing that is typically generated for most studies in the field. If this level of sequencing were not accessible, then studies must rely more heavily on careful experimental design, sample selection, and data processing to maximize the accuracy of quantifications, and thus generate stronger associations.
A future perspective for meta-omics association studies?
All of the above limitations may theoretically impede the use of meta-omics associations studies to identify causal relationships between micropollutant biotransformations and genes or gene products. We therefore queried our own data with atenolol biotransformation to investigate whether, despite these limitations, we could observe patterns that pointed towards causal relationships. In our experiments, WWTP communities quantitatively transformed atenolol into atenolol acid via primary amide hydrolysis.30 When sorting the correlation coefficients between transcript abundances and atenolol biotransformation rate constants by their significance level (i.e., their P-values), we found a cluster of highly significant associations with gene transcripts encoding different urease subunits as well as transcripts encoding other parts of the urea cycle (i.e., urea ABC transporters, urea carboxylases, and urea carboxylase-related transporters/permeases). In total, we found 13 urea cycle-related transcripts among 281 transcripts that had significant associations (P < 0.05, without correcting for multiple hypothesis testing). In contrast, we only found seven urea cycle-related transcripts in the remaining 4952 transcripts that did not have significant associations. Urease catalyzes the hydrolysis of urea (a primary amide) to ammonium and CO2. It is therefore plausible that urease might also catalyze the reaction of atenolol to atenolol acid. Indeed, we found positive and monotonic associations between the atenolol biotransformation rate constants and the gene transcripts encoding the alpha and gamma subunits of urease (Fig. 4; Spearman rank correlation tests, P < 0.007). However, the final establishment of causality would require further experiments targeting the specific genes or gene products through, e.g., loss-of-function genetic manipulations or characterizations of purified enzymes.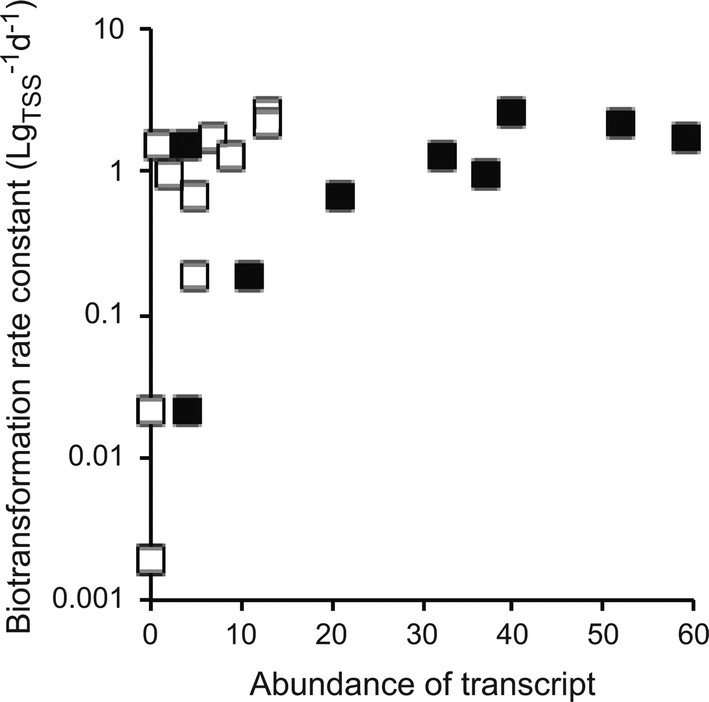 | ||
| Fig. 4 Associations between the rarified abundances of urease transcripts and the biotransformation rate constants of atenolol. Each data point is for one individual wastewater treatment plant community. Open squares are for the urease alpha subunit and the filled squares are for the urease beta subunit. The first-order biotransformation rate constants were normalized to total suspended solids (TSS). | ||
In summary, our own data indicate that, despite the above limitations, meta-omics association studies might indeed allow us to uncover candidate genes or gene products that are likely to cause or promote specific micropollutant biotransformations. If combined with rational approaches to limit the number of candidate genes, e.g., based on a comparison of reaction similarity with known enzymatic reactions38,39 to limit the number of hypotheses that are tested, we believe that meta-omics association studies are a promising approach to understand and predict variability in contaminant biotransformation performance among different microbial communities.
Acknowledgements
We thank Martin Ackermann, Hans-Peter E. Kohler, Tae Kwon Lee and Joonhong Park for useful discussions. We thank an anonymous reviewer for substantially improving the quality and clarity of this manuscript. We acknowledge support from the European Research Council under the European Union's Seventh Framework Programme (ERC grant agreement no. 614768, PROduCTS) and from the Swiss National Science Foundation (project no. CR23I2_140698).References
- K. Fenner, S. Canonica, L. P. Wackett and M. Elsner, Science, 2013, 341, 752–758 CrossRef CAS PubMed.
- B. A. Kolvenbach, D. E. Helbling, H. P. Kohler and P. F. Corvini, Curr. Opin. Biotechnol., 2014, 27, 8–14 CrossRef CAS PubMed.
- M. Pavan and A. P. Worth, QSAR Comb. Sci., 2008, 27, 32–40 CAS.
- A. Joss, S. Zabczynski, A. Göbel, B. Hoffmann, D. Löffler, C. S. McArdell, T. A. Ternes, A. Thomsen and H. Siegrist, Water Res., 2006, 40, 1686–1696 CrossRef CAS PubMed.
- V. de Lorenzo, Curr. Opin. Biotechnol., 2008, 19, 579–589 CrossRef CAS PubMed.
- K. Watanabe and N. Hamamura, Curr. Opin. Biotechnol., 2003, 14, 289–295 CrossRef CAS.
- C. Desai, H. Pathak and D. Madamwar, Bioresour. Technol., 2010, 101, 1558–1569 CrossRef CAS PubMed.
- M. J. Worsey and P. A. Williams, J. Bacteriol., 1975, 124, 7–13 CAS.
- L. H. Bopp, Journal of Industrial Microbiology, 1986, 1, 23–29 CrossRef CAS.
- X. Maymó-Gatell, Y. Chien, J. M. Gossett and S. H. Zinder, Science, 1997, 276, 1568–1571 CrossRef.
- J. Dunbar, S. White and L. Forney, Appl. Environ. Microbiol., 1997, 63, 1326–1331 CAS.
- M. Alidina, D. Li, M. Ouf and J. E. Drewes, J. Environ. Manage., 2014, 144, 58–66 CrossRef CAS PubMed.
- K. Fischer and M. Majewsky, Appl. Environ. Microbiol., 2014, 98, 6583–6597 CAS.
- M. G. Dumont and J. C. Murrell, Nat. Rev. Microbiol., 2005, 3, 499–504 CrossRef CAS PubMed.
- E. L. Madsen, Curr. Opin. Biotechnol., 2006, 17, 92–97 CrossRef CAS PubMed.
- K. F. Ettwig, M. K. Butler, D. Le Paslier, E. Pelletier, S. Mangenot, M. M. M. Kuypers, F. Schreiber, B. E. Dutilh, J. Zedelius, D. de Beer, J. Gloerich, H. J. C. T. Wessels, T. van Alen, F. Luesken, M. L. Wu, K. T. van de Pas-Schoonen, H. J. M. Op den Camp, E. M. Janssen-Megens, K. J. Francoijs, H. Stunnenberg, J. Weissenbach, M. S. M. Jetten and M. Strous, Nature, 2010, 464, 543–548 CrossRef CAS PubMed.
- H. Fang, L. Cai, Y. Yu and T. Zhang, Bioresour. Technol., 2013, 129, 209–218 CrossRef CAS PubMed.
- M. F. Haroon, S. Hu, Y. Shi, M. Imelfort, J. Keller, P. Hugenholtz, Z. Yuan and G. W. Tyson, Nature, 2013, 500, 567–570 CrossRef CAS PubMed.
- H. Fang, L. Cai, Y. Yang, F. Ju, X. Li, Y. Yu and T. Zhang, Sci. Total Environ., 2014, 470–471, 983–992 CrossRef CAS PubMed.
- J. E. Drewes, D. Li, J. Regnery, M. Alidina, A. Wing and C. Hoppe-Jones, Water Sci. Technol., 2014, 69, 628–633 CrossRef CAS PubMed.
- J. P. Ioannidis, G. Thomas and M. J. Daly, Nat. Rev. Genet., 2009, 10, 318–329 CrossRef CAS PubMed.
- D. Thomas, Nat. Rev. Genet., 2010, 11, 259–272 CrossRef CAS PubMed.
- B. J. Baker and G. J. Dick, Microbe, 2013, 8, 353–360 Search PubMed.
- S. D. Copley, Trends Biochem. Sci., 2000, 25, 261–265 CrossRef CAS.
- P. B. Hatzinger, K. McClay, S. Vainberg, M. Tugusheva, C. W. Condee and R. J. Steffan, Appl. Environ. Microbiol., 2001, 67, 5601–5607 CrossRef CAS PubMed.
- J. O. Sharp, T. K. Wood and L. Alvarez-Cohen, Biotechnol. Bioeng., 2005, 89, 608–618 CrossRef CAS PubMed.
- Y. Men, H. Feil, N. C. Verberkmoes, M. B. Shah, D. R. Johnson, P. K. Lee, K. A. West, S. H. Zinder, G. L. Andersen and L. Alvarez-Cohen, ISME J., 2012, 6, 410–421 CrossRef CAS PubMed.
- B. E. Morris, R. Henneberger, H. Huber and C. Moissl-Eichinger, FEMS Microbiol. Rev., 2013, 37, 384–406 CrossRef CAS PubMed.
- D. R. Johnson, T. K. Lee, J. Park, K. Fenner and D. E. Helbling, Environ. Microbiol. DOI:10.1111/1462-2920.12429.
- D. E. Helbling, D. R. Johnson, M. Honti and K. Fenner, Environ. Sci. Technol., 2012, 46, 10579–10588 CrossRef CAS PubMed.
- D. R. Johnson, D. E. Helbling, T. K. Lee, J. Park, K. Fenner, H. P. E. Kohler and M. Ackermann, Appl. Environ. Microbiol., 2015, 81, 666–675 CrossRef CAS PubMed.
- M. Baani and W. Liesack, Proc. Natl. Acad. Sci. U. S. A., 2008, 105, 10203–10208 CrossRef CAS PubMed.
- J. He, V. F. Holmes, P. K. Lee and L. Alvarez-Cohen, Appl. Environ. Microbiol., 2007, 73, 2847–2853 CrossRef CAS PubMed.
- E. M. Hearn, D. R. Patel and B. van den Berg, Proc. Natl. Acad. Sci. U. S. A., 2008, 105, 8601–8606 CrossRef CAS PubMed.
- L. Snyder, J. E. Peters, T. M. Henkin and W. Champness, Molecular Genetics of Bacteria, ASM Press, 4th edn, 2013 Search PubMed.
- S. Dudoit and M. J. van der Laan, Multiple Testing Procedures with Applications to Genomics, Springer, 2008 Search PubMed.
- D. E. Helbling, D. R. Johnson, T. K. Lee, A. Scheidegger and K. Fenner, Water Res., 2015, 70, 471–484 CrossRef CAS PubMed.
- D. A. Latino and J. Aires-de-Sousa, J. Chem. Inf. Model., 2009, 49, 1839–1846 CrossRef CAS PubMed.
- Y. Yamanishi, M. Hattori, M. Kotera, S. Goto and M. Kanehisa, Bioinformatics, 2009, 25, 179–186 CrossRef PubMed.
| This journal is © The Royal Society of Chemistry 2015 |