 Open Access Article
Creative Commons Attribution 3.0 Unported Licence
Isothermal titration calorimetry as a powerful tool to quantify and better understand agglomeration mechanisms during interaction processes between TiO2 nanoparticles and humic acids†
Frédéric
Loosli
a,
Letícia
Vitorazi
b,
Jean-François
Berret
b and
Serge
Stoll
*a
aGroup of Environmental Physical Chemistry, University of Geneva, F.-A. Forel Institute Section des Sciences de la Terre et de l'Environnement, 10 route de Suisse, 1290 Versoix, Switzerland. E-mail: serge.stoll@unige.ch; Fax: +41 22 379 0302; Tel: +41 22 379 0333
bLaboratoire Matière et Systèmes Complexes, UMR 7057 Université Paris-Diderot/CNRS, Bâtiment Condorcet, 10 rue Alice Domon et Léonie Duquet, F-75205 Paris cedex 13, France
First published on 21st August 2015
Abstract
The association processes between engineered TiO2 nanoparticles and Suwannee River humic acids are investigated by isothermal titration calorimetry and by measuring the exchanged heat during the binding process, allowing the determination of thermodynamic (change in enthalpy, Gibbs free energy and entropy) and reaction (binding affinity constant, reaction stoichiometry) parameters. Our results indicate that strong TiO2–Suwannee River humic acid interactions are entropically and enthalpically favorable with exothermic binding reactions and that the mixing order is also an important parameter. High humic acid concentrations induce homoagglomeration (“self”-assembly) and are shown to favor an enthalpically driven association process. Light scattering techniques are also considered to investigate the influence of TiO2 surface charge modifications and agglomeration mechanisms. Patch and bridging mechanisms are found to result in the formation of large agglomerates once charge inversion of TiO2–humic acid complexes is achieved. Moreover, van der Waals interactions are also found to play a significant role during interaction processes due to the amphiphilic character of humic acids.
Nano impactThe stability of engineered nanoparticles in aquatic systems is strongly influenced by their interactions with aquagenic compounds such as natural organic matter. In order to have a better understanding of these interaction processes and the resulting agglomeration or stabilization mechanisms, isothermal titration calorimetry is proposed here as a promising and novel technique in the field of environmental science. This approach allows the thermodynamic quantification and determination of the agglomeration mechanism during association processes between TiO2 nanoparticles and humic acids. Such an evolution in the comprehension of the interaction phenomena is an important step to improve our knowledge of the behavior of nanoparticles and the risk assessment associated to nanoparticles in aquatic systems. |
1. Introduction
A better understanding of the fate and behavior of engineered nanoparticles (ENPs) in the presence of aquagenic compounds is of great importance for the risk assessment associated to ENPs entering environmental aquatic systems.1–5 Indeed, nanomaterials are produced in large and growing amounts6 due to their very unique electronic and surface chemistry properties.7 ENPs are then expected to enter aquatic natural systems not only through surface runoff and accidental discharge but also due to the lack of efficiency in removing them in wastewater treatment plants.8–10 Once in aquatic systems, ENP stability is strongly influenced by the physicochemical properties of water, i.e. pH, ionic strength,11–13 ENP intrinsic properties, i.e. size, shape, surface charge and chemistry,14,15 and the presence of aquagenic compounds such as natural colloids and living microorganisms.16,17 Complex formation between ENPs and natural compounds strongly modifies the ENP stability, fate, transport, bioavailability and effect towards living organisms.18,19An important class of organic colloids is represented by natural organic matter (NOM). The larger fraction of NOM is composed of humic substances with up to 30–50% of total surface water organic matter.20 Humic substances are derived from plant and animal residues through humification processes.21 The interaction processes between ENPs and the soluble fraction of humic substances (fulvic and humic acids) have been investigated in many studies.22–24 Their presence was shown to deeply modify the ENP surface charge, resulting in stability through electrostatic interactions and steric effects once adsorbed on ENPs.25–27 The presence of NOM was found not only to promote ENP agglomeration or stabilization but also to induce the partial fragmentation of already formed ENP agglomerates.28–30 Agglomeration versus fragmentation was found to be dependent on the nature of NOM, ENP surface properties and the concentration ratio between them.
Most of these studies investigated the ENP stability for different experimental conditions by determining the ENP surface charge modification and the resulting state of agglomeration (size and fractal dimension) to understand the influence of pH, NOM properties, electrolyte concentration and valency. In the present study we focus on a different but important complementary aspect related to the quantification of the energies associated to the interaction processes and agglomeration mechanisms. Isothermal titration calorimetry (ITC) is used here to quantify the complexation between TiO2 ENPs and humic acids. ITC is an instrumental technique which permits the determination, in a single experiment, of all interaction thermodynamic parameters (ΔH, ΔS and ΔG) and to provide information on the reaction stoichiometry and binding affinity. ITC has been applied to study binding reactions for the self-assembly of supramolecular polymers and protein–substrate interactions.31–34 In this study we use a novel approach, via ITC measurements, to get a quantitative insight into the interaction energies between TiO2 ENPs and humic acids. TiO2 ENPs are one of the most produced nanomaterials,6,35,36 being used in many industrial domains such as in the food, cosmetic and painting industries.37–39 TiO2 ENPs are likely to be already present in the natural aquatic systems in the ng L−1 to μg L−1 range.9,40 The influence of NOM and water properties on their stability was thoroughly investigated.41,42
In the present study all thermodynamic reaction parameters associated to the complexation processes are considered together, in addition to ENP surface charge modification and size evolution, to propose a detailed quantification of the energy involved during interaction processes. Comparison is also made with dynamic light scattering and electrophoretic mobility measurements to obtain a better description of the agglomeration mechanisms (patch and bridging) between TiO2 ENPs and humic acids.
2. Materials and methods
2.1. Materials
A 5 g L−1 TiO2 dispersion was prepared by dilution of a 15 wt% TiO2 suspension (obtained from Nanostructured & Amorphous Materials, Inc., Houston, TX, USA), after homogenization, with Milli-Q water (Millipore, Zoug, ZG, Switzerland, with R >18 MΩ cm, T.O.C. <2 ppb). NaOH and HCl (1 M, Titrisol®, Merck, Zoug, ZG, Switzerland) were used after dilution to adjust the ENP dispersions at pH 3.8 and 10.4. The TiO2 dispersion was then dialyzed against water (pH 3.8 and 10.4) with 12–14 kDa cutoff dialysis membranes (Spectrum Laboratories, Inc., Rancho Dominguez, CA, USA). Dialysis was realized to minimize the change in enthalpy due to the dilution processes during titration. The rather low molecular weight of SRHAs43 does not allow their dialysis. The dialysis solvent was first used to prepare humic acid (Suwannee River humic acids (SRHAs), Standard II, International Humic Substances Society, Denver, CO, USA) solutions with concentrations equal to 1.25 mM in terms of charge concentration (600 mg L−1 for pH 3.8 and 201 mg L−1 for pH 10.4) which were stirred overnight. The water from dialysis was also used to dilute the TiO2 and SRHA suspensions to experimental concentrations (from 0.1 to 3.5 g L−1 for TiO2 and from 0.0375 to 0.75 mM for SRHA).2.2. Isothermal titration calorimetry measurement
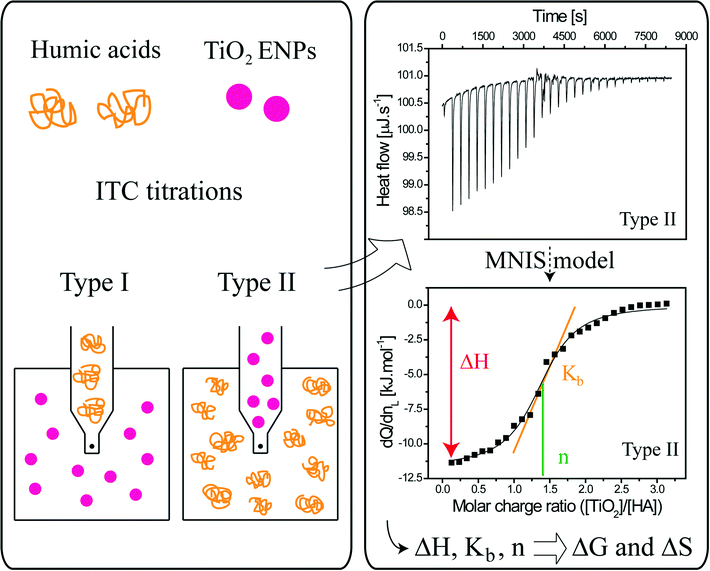
A VP-ITC calorimeter (MicroCal Inc., Northampton, MA, USA) with a sample cell volume equal to 1.4643 mL was used to determine the heat exchange between TiO2 ENPs and SRHAs. After a preliminary injection of 2 μL of the first compound (ligand (L)), 28 successive injections of 10 μL into the sample cell containing the other compound of interest (macromolecule (M)) were realized with injection duration equal to 20 s and a delay of 300 s between two successive additions The stirring speed was set to 307 rpm and the working temperature to 298.15 K for all experiments. The plot of the heat of exchange (dQ/dnL) as a function of the molar charge ratio (Z = [L]/[M], where [L] and [M] are the ligand and macromolecule molar charge concentration, respectively) is fitted with a multiple non-interacting sites (MNIS) model (eqn (1)) where the sites do not exhibit cooperative binding behavior.44 In order to determine the fitting parameters, the following equation is used. | (1) |
In this equation, the fitting parameters are ΔHb [kJ mol−1], Kb [M−1] and n, and they represent the binding enthalpy (energy involved during association processes), affinity binding constant (affinity between the two compounds) and reaction stoichiometry, respectively. These parameters are adjusted to fit the experimental curves with the mathematical MNIS model given by eqn (1). Then, the Gibbs free energy, ΔG [kJ mol−1], and the change in entropy, ΔS [kJ K−1 mol−1], are calculated from the fitting parameters with ΔG = −RT![[thin space (1/6-em)]](https://www.rsc.org/images/entities/char_2009.gif) ln
ln![[thin space (1/6-em)]](https://www.rsc.org/images/entities/char_2009.gif) Kb and ΔS = (ΔH − ΔG)/T. The ligand and macromolecule charge numbers for the ith-injection are equal to:
Kb and ΔS = (ΔH − ΔG)/T. The ligand and macromolecule charge numbers for the ith-injection are equal to:
| Li = Li−1 + Vi[L]mNA and M = [M]mVcellNA | (2) |
 | (3) |
 | (4) |
 | (5) |
In eqn (2), Vi and Vcell represent the volume of ligand injected and the cell volume, respectively. [L]m or [M]m corresponds to the moles of charge of ligand or macromolecule per unit volume, respectively, and NA is Avogadro's constant. The concentration in terms of moles of charge per unit volume for TiO2 and SRHA are expressed in eqn (3) and (4), respectively. In eqn (3), [TiO2]M represents the TiO2 mass concentration, SA the ENP specific surface area [m2 g−1] and σTiO2 the TiO2 hydroxyl site density [sites per nm2]. In eqn (4), [SRHA]M represents the SRHA mass concentration, Qtot the SRHA overall charge density [meq g C−1] and C% the SRHA percent of carbon, which is equal to 52.63%.45 For the modified Henderson–Hasselbalch equation (eqn (5)), the values of maximum charge densities Q1 and Q2 of SRHA carboxylic and phenolic binding sites, the two dissociation constants K1 and K2 and empirical parameters n1 and n2 were taken from the study by Ritchie et al. dealing with the proton binding of standard SRHA.46
TiO2 charge concentrations were estimated based on manufacturer data (primary TiO2 diameter equal to 15 nm and in good agreement with the mode value of TiO2 number size distribution (ESI† Fig. S1)) to calculate the SA and on the study by Kominami et al. to estimate σTiO2.47 A value of SA equal to 100 m2 g−1 and 5 sites per nm2σTiO2 were used to determine the TiO2 charge concentration, and the factor of conversion between the mass and the charge concentration was set so that a 1 g L−1 TiO2 dispersion corresponds to a 0.83 mM charge concentration.
The mixing order of the two compounds, which is an important issue to consider, was investigated to better understand the TiO2–SRHA and SRHA–TiO2 interactions and agglomeration process as illustrated in Fig. 1. In the first set of experiments (type I) SRHA played the role of ligand and was added to the TiO2 dispersions. In the second set of experiments (type II) TiO2 ENPs (L) were added to SRHA (M).
Experiments were made at pH 3.8 (and at pH 10.4) without the addition of electrolyte. Such a pH value was used to address the interaction between isolated and SRHA. It is important to note that results remain valid as long as pH < pHPCN,TiO2. The domain of concentration investigated was from 0.25 mM SRHA in 0.1 g L−1 TiO2 to 1.25 mM SRHA in 0.5 g L−1 TiO2 for type I experiments and from 0.7 g L−1 TiO2 in 0.0375 mM SRHA to 3.5 g L−1 TiO2 in 0.1875 mM alginate for type II experiments. Such TiO2 concentrations are higher than the expected environmental concentrations, which are in the ng L−1 to μg L−1 range,8–10 but necessary to obtain an optimum signal with the calorimeter.
2.3. Zeta potential and size distribution measurements
Zeta (ζ) potential values and z-average hydrodynamic diameters of TiO2 and SRHA suspensions as a function of pH as well as TiO2 in the presence of SRHA as a function of charge ratio were determined by laser Doppler velocimetry and dynamic light scattering (Zetasizer Nano ZS instrument, Malvern Instruments, Worcestershire, UK). The instrument was operated at 298.15 K. For the determination of ζ potential values the Smoluchowski approximation model was applied according to the formation and presence of large agglomerates.30 All polydispersity indexes were found to be below 0.6.3. Results and discussion
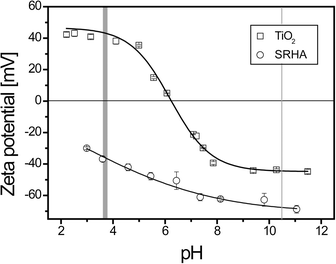
ITC experiments were realized to determine the binding properties mainly at pH <pHPCN,TiO2. Such a pH domain favors electrostatic interactions. TiO2 ENPs are positively charged (ζ potential = +40.9 ± 1.4 mV) (mean ± standard deviation on mean of triplicates), whereas SRHAs are negatively charged (ζ potential = −37.2 ± 1.9 mV) as shown in Fig. 2, where the ζ potential is represented as a function of pH for both compounds. Some experiments were also made at pH >pHPCN,TiO2, where both compounds exhibit the same charge (negatively charged TiO2 and SRHA) to check if only steric and electrostatic repulsions are involved or if other forces such as van der Waals interactions are also expected to play a significant role during the interaction processes. At pH <pHPCN,TiO2 and pH >pHPCN,TiO2 TiO2 ENPs are dispersed as shown in Fig. S1† with z-average diameter equal to 50 nm, whereas the SRHA z-average diameter is found to be constant with pH changes and equal to 379 ± 19 nm (Fig. S2†).3.1. TiO2–SRHA thermodynamic and reaction binding parameters determined by ITC
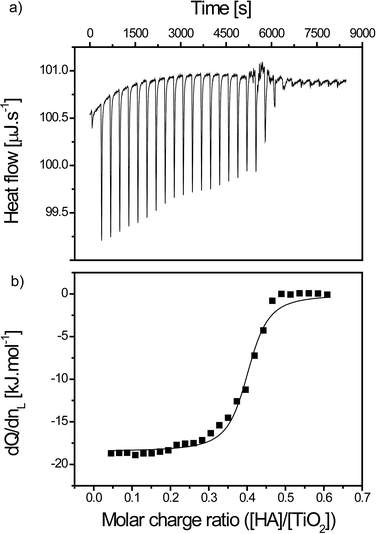
| SRHA in TiO2 | ΔHb [kJ mol−1] | K b [M−1] | n | ΔG [kJ mol−1] | TΔS [kJ mol−1] |
|---|---|---|---|---|---|
| 0.25 mM in 0.1 g L−1 | −18.3 | 4.3 × 10⁶ | 0.41 | −37.9 | 19.6 |
| 0.50 mM in 0.2 g L−1 | −22.9 | 2.5 × 10⁶ | 0.31 | −36.5 | 13.6 |
| 0.75 mM in 0.3 g L−1 | −23.2 | 1.1 × 10⁶ | 0.34 | −34.6 | 11.4 |
| 1.25 mM in 0.5 g L−1 | −24.4 | 8.5 × 10⁵ | 0.32 | −33.9 | 9.4 |
TiO2 titrations with SRHA are thus spontaneous reactions with high Gibbs energy value (ΔG < −30 kJ mol−1). The interaction energies are found to lead to the formation of TiO2–SRHA complexes due to favorable enthalpy conditions (ΔHb <0) and entropic gain (TΔS >0). Relative concentration is found to influence the binding energy as higher concentration involved higher ΔHb values. This behavior can be attributed to the importance of SRHA homoagglomeration (“self”-assembly) due to agglomerates weakly bonded by hydrophobic interactions and H-bonding,48,49 which is concentration dependent.50 Indeed larger SRHA agglomerates are expected to promote interaction with an increasing amount of TiO2 ENPs in comparison to smaller SRHA agglomerates. The decrease in the binding affinity, and thus calculated Gibbs free energy, with the increase in the relative experimental concentrations is due to the relation between Kb and c according to Kb ~ c−2.44 The reaction stoichiometry is found, for type I titrations, to slightly decrease. Overall it denotes that TiO2 ENPs are not fully coated with SRHA, which is in agreement with the SRHA structure. Indeed humic acids are often considered as heterogeneous semi-rigid globular macromolecules.51–53 The entropy gain is lower when relative concentrations are increasing. This is not only due to the decrease in the Gibbs free energy for higher concentration but also to the fact that for larger SRHA homoagglomerates the gain in entropy is smaller owing to the lower conformational entropy gain that occurs during the binding process and lower gain in entropy due to the release of water molecules. The complex formation is therefore mainly driven by the importance of the binding energy (ΔHb < −TΔS) except for the lowest relative concentration investigated in this study for which ΔHb and −TΔS have similar values.
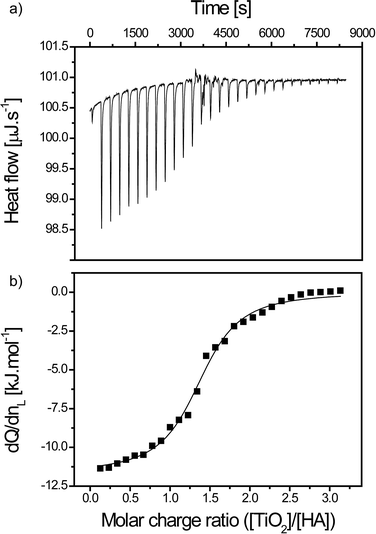
| TiO2 in SRHA | ΔHb [kJ mol−1] | K b [M−1] | n | ΔG [kJ mol−1] | TΔS [kJ mol−1] |
|---|---|---|---|---|---|
| 0.7 g L−1 in 0.0375 mM | −11.7 | 5.1 × 10⁵ | 1.41 | −32.6 | 20.9 |
| 1.4 g L−1 in 0.0750 mM | −12.0 | 3.3 × 10⁵ | 1.60 | −31.5 | 19.5 |
| 2.1 g L−1 in 0.1125 mM | −12.2 | 2.5 × 10⁵ | 1.40 | −30.8 | 18.6 |
| 3.5 g L−1 in 0.1875 mM | −13.4 | 1.6 × 10⁵ | 1.24 | −29.6 | 16.2 |
The reaction stoichiometry is not dependent on the relative concentration investigated (n = 1.41 ± 0.15). Moreover, the enthalpy of binding is not significantly influenced by the increase in concentration (−12.3 ± 0.8 kJ mol−1).
When comparison is made between the two titration procedures an important difference in the value of the binding enthalpy is observed due to the much higher SRHA concentration, and thus larger SRHA homoagglomerate formation and higher enthalpy of interaction for type I. When SRHAs are added to the solution containing TiO2 the enthalpy is significantly more important because of the possibility to complex more ENPs. SRHA homoagglomeration phenomenon is also the reason why type I titrations are mainly driven by enthalpy, whereas type II interaction processes are driven by an important gain in entropy as the total free Gibbs free energy is similar for both titration types. The entropic gain arises from the SRHA and ENP counter-ions and water molecules released during the adsorption processes. It should be noted that larger loss of entropy is associated with a larger increase in enthalpy as suggested by the enthalpy–entropy compensation.54,55 Similar total free energy values were observed during the association process between ZnO ENPs with lysozyme as well as between proteins and amino acid functionalized gold ENPs.56–58 However, in these studies the interactions (Kb = 0.9 × 10⁶ M−1) were enthalpically favorable but entropically unfavorable due to conformational restriction of proteins.
Reaction stoichiometries are not equal to unity even in the presence of an electrostatic interaction scenario. Indeed as SRHAs are relatively heterogeneous in size and highly charged macromolecules in these working conditions, bridging and patch mechanisms are expected to play an important role during the interaction processes.59–61 Therefore a significant number of ENP surface sites are hindered due to conformational restrictions and surface charge heterogeneity, which favors a reaction stoichiometry lower than unity for type I titration and higher than unity for type II.
Another interesting behavior when investigating the association process between TiO2 and SRHA is the weak exchange energy which is still observed for high [L] over [M] charge ratio. It means that non-electrostatic interactions are involved even if EPN surface sites are no longer available. Such interaction energies, which are more important for high SRHA concentrations, can be linked to the amphiphilic character of SRHA that is known to exhibit significant van der Waals interactions.62
To verify the presence of such van der Waals interactions, the complexation process between TiO2 and SRHA is also investigated at pH 10.4 for the titration of a 5 g L−1 TiO2 dispersion with 1.25 mM SRHA. At pH >pHPCN,TiO2 both compounds are negatively charged (Fig. 2). If only electrostatic interactions are involved during the association processes the real-time thermograms and the respective heat exchange plots for both the titration (1.25 mM SRHA in 5 g L−1) and for the dilution (1.25 mM SRHA in water) should be identical (or at least very similar). This is not the case and an association process is shown to happen between TiO2 and SRHA in this unfavorable electrostatic scenario (Fig. S9 and S10†). van der Waals interactions are shown to be significant with energy exchange in the early titration stage, three times greater than the dilution effect and of the order of a few kJ mol−1. The presence of van der Waals interactions at pH >pHPCN,TiO2 is also in good agreement with a previous study where SRHAs were shown to be adsorbed onto TiO2 ENPs with a decrease in the electrophoretic mobility and an increase in ENP size when negatively charged SRHAs were added to negatively charged TiO2.63
3.2. Effect of TiO2–SRHA agglomeration and surface charge on binding heat of exchange
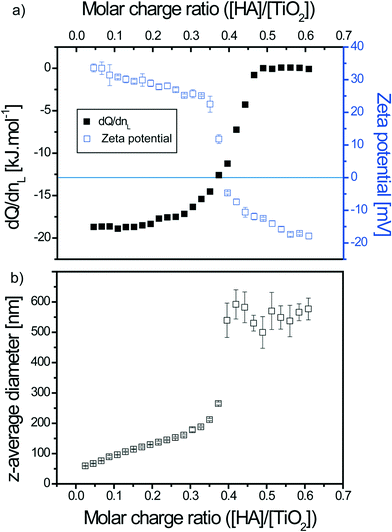
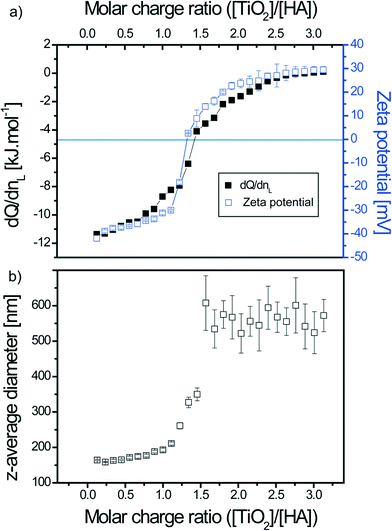
In order to understand the influence of agglomerate formation and surface charge on the heat of exchange between TiO2 and SRHA, electrophoretic mobility measurements and size determination were realized and then comparison was made with the previous heat exchange data plots obtained by ITC. Experiments were realized at pH <pHPCN,TiO2 for 0.25 mM SRHA in 0.1 g L−1 TiO2 (type I) and 0.7 g L−1 TiO2 in 0.0375 mM SRHA (type II) with a 300 s delay between each successive titrant addition (identical to that for ITC experiments). As this delay time was not long enough to perform both ζ potential and z-average diameter determination, triplicates for each of these parameters were measured separately.For both titration types, good agreement is found between the surface charge modification of TiO2–SRHA complexes, the heat of exchange associated to the interaction processes and the size evolution along the titrations. An interesting behavior for the interaction of TiO2 ENPs in the presence of SRHA is that non-negligible binding enthalpy is observed even after charge inversion (and particle precipitation) has occurred. It denotes the role of van der Waals interactions (especially for type I) and change of conformation of SRHA. Such a behavior is not observed when linear natural polysaccharides (alginate) are considered.64 This is due to the alginate chemical properties for which van der Waals interactions are not favored. Dynamic light scattering has also permitted assignment of the real-time thermogram signature to an important precipitation domain in agreement with z-average diameter and ζ potential values.
4. Conclusion
The spontaneous association process between TiO2 nanoparticles and Suwannee River humic acids has been shown to be dependent on concentration and mixing order. All interaction processes were found favorable from an enthalpic and entropic point of view and agglomeration was shown to be promoted by patch and bridging mechanisms.This study shows the high potential of isothermal titration calorimetry (ITC) for the investigation of interactions between engineered nanoparticles (ENPs) and natural organic matter. Indeed ITC, especially when associated with light scattering techniques, not only allows the determination of important thermodynamic (ΔH, ΔG and ΔS) and reaction (Kb and n) parameters but also a better understanding of the mechanism of interactions (and/or agglomeration) and the forces (hydrophobic, electrostatic) involved during association processes. ITC also gives quantitative and accurate information on the adsorption energies and hence potential reversibility of nanoparticle coating processes in various conditions. This novel technique in environmental nanoscience also constitutes a potential promising instrumental method for the investigation of competitive sorption of environmental compounds (natural organic molecules and inorganic colloids) on ENPs. The major limitations of ITC concern not only the time-consuming sample preparation and long analysis time but also the high concentrations needed (especially for the titrant) which can be a problem if working with costly materials or molecules being concentration conformational dependent. Nevertheless, ITC is a non-destructive technique which allow the quantification of the interfacial reactions (and the possible reversibility and stability of the association processes), which is essential fundamental information for a better holistic understanding of the transport and fate of (nano)particles in aquatic systems when exposed to a broad range of molecules of different abundance.
Acknowledgements
The authors are grateful to the financial support received from the Swiss National Foundation (200020_152847 and 200021_135240). The work leading to these results also received funding from the European Union Seventh Framework Programme (FP7/2007-20013) under agreement no. NMP4-LA-2013-310451. L. V. also thanks the CNPq (Conselho Nacional de Desenvolvimento Científico e Tecnológico) 210694/2013-0 in Brazil for a postdoctoral fellowship.References
- S. J. Klaine, P. J. J. Alvarez, G. E. Batley, T. F. Fernandes, R. D. Handy, D. Y. Lyon, S. Mahendra, M. J. McLaughlin and J. R. Lead, Environ. Toxicol. Chem., 2008, 27, 1825–1851 CrossRef CAS PubMed.
- Y. Ju-Nam and J. R. Lead, Sci. Total Environ., 2008, 400, 396–414 CrossRef CAS PubMed.
- P. Biswas and C. Y. Wu, J. Air Waste Manage. Assoc., 2005, 55, 708–746 CAS.
- M. R. Wiesner, G. V. Lowry, P. Alvarez, D. Dionysiou and P. Biswas, Environ. Sci. Technol., 2006, 40, 4336–4345 CrossRef CAS.
- G. V. Lowry, K. B. Gregory, S. C. Apte and J. R. Lead, Environ. Sci. Technol., 2012, 46, 6893–6899 CrossRef CAS PubMed.
- F. Piccinno, F. Gottschalk, S. Seeger and B. Nowack, J. Nanopart. Res., 2012, 14, 1109 CrossRef.
- M. Auffan, J. Rose, J.-Y. Bottero, G. V. Lowry, J.-P. Jolivet and M. R. Wiesner, Nat. Nanotechnol., 2009, 4, 634–641 CrossRef CAS PubMed.
- G. E. Batley, J. K. Kirby and M. J. McLaughlin, Acc. Chem. Res., 2013, 46, 854–862 CrossRef CAS PubMed.
- N. Sani-Kast, M. Scheringer, D. Slomberg, J. Labille, A. Praetorius, P. Ollivier and K. Hungerbühler, Sci. Total Environ., 2015, 535, 150–159 CrossRef CAS PubMed.
- F. Gottschalk, T. Sonderer, R. W. Scholz and B. Nowack, Environ. Sci. Technol., 2009, 43, 9216–9222 CrossRef CAS PubMed.
- R. A. French, A. R. Jacobson, B. Kim, S. L. Isley, R. L. Penn and P. C. Baveye, Environ. Sci. Technol., 2009, 43, 1354–1359 CrossRef CAS.
- J. Labille and J. Brant, Nanomedicine, 2010, 5, 985–998 CrossRef CAS PubMed.
- B. Mukherjee and J. W. Weaver, Environ. Sci. Technol., 2010, 44, 3332–3338 CrossRef CAS PubMed.
- I. Chowdhury, S. L. Walker and S. E. Mylon, Environ. Sci.: Processes Impacts, 2013, 15, 275–282 CAS.
- M. J. Mulvihill, S. E. Habas, I. Jen-La Plante, J. Wan and T. Mokari, Chem. Mater., 2010, 22, 5251–5257 CrossRef CAS.
- C. Levard, E. M. Hotze, G. V. Lowry and G. E. Brown Jr., Environ. Sci. Technol., 2012, 46, 6900–6914 CrossRef CAS PubMed.
- A. A. Keller, H. Wang, D. Zhou, H. S. Lenihan, G. Cherr, B. J. Cardinale, R. Miller and Z. Ji, Environ. Sci. Technol., 2010, 44, 1962–1967 CrossRef CAS PubMed.
- B. Collin, M. Auffan, A. C. Johnson, I. Kaur, A. A. Keller, A. Lazareva, J. R. Lead, X. Ma, R. C. Merrifield, C. Svendsen, J. C. White and J. M. Unrine, Environ. Sci.: Nano, 2014, 1, 533–548 RSC.
- N. von Moos, P. Bowen and V. I. Slaveykova, Environ. Sci.: Nano, 2014, 1, 214–232 RSC.
- E. M. Thurman and R. L. Malcolm, Environ. Sci. Technol., 1981, 15, 463–466 CrossRef CAS PubMed.
- M. N. Jones and N. D. Bryan, Adv. Colloid Interface Sci., 1998, 78, 1–48 CrossRef CAS.
- M. Belen Romanello and M. M. Fidalgo de Cortalezzi, Water Res., 2013, 47, 3887–3898 CrossRef PubMed.
- M. Erhayem and M. Sohn, Sci. Total Environ., 2014, 468–469, 249–257 CrossRef CAS PubMed.
- J. A. Gallego-Urrea, J. Perez Holmberg and M. Hassellov, Environ. Sci.: Nano, 2014, 1, 181–189 RSC.
- S. M. Louie, R. D. Tilton and G. V. Lowry, Environ. Sci. Technol., 2013, 47, 4245–4254 CrossRef CAS PubMed.
- X. Liu, M. Wazne, Y. Han, C. Christodoulatos and K. L. Jasinkiewicz, J. Colloid Interface Sci., 2010, 348, 101–107 CrossRef CAS PubMed.
- M.-H. Shen, Y.-G. Yin, A. Booth and J.-F. Liu, Water Res., 2015, 71, 11–20 CrossRef CAS PubMed.
- F. Mohd Omar, H. Abdul Aziz and S. Stoll, Sci. Total Environ., 2014, 468–469, 195–201 CrossRef CAS PubMed.
- F. Loosli, P. Le Coustumer and S. Stoll, Environ. Sci.: Nano, 2014, 1, 154–160 RSC.
- M. Baalousha, Sci. Total Environ., 2009, 407, 2093–2101 CrossRef CAS PubMed.
- L. Vitorazi, N. Ould-Moussa, S. Sekar, J. Fresnais, W. Loh, J. P. Chapel and J. F. Berret, Soft Matter, 2014, 10, 9496–9505 RSC.
- I. Jelesarov and H. R. Bosshard, J. Mol. Recognit., 1999, 12, 3–18 CrossRef CAS.
- W. Kim, Y. Yamasaki, W.-D. Jang and K. Kataoka, Biomacromolecules, 2010, 11, 1180–1186 CrossRef CAS PubMed.
- J. E. Ladbury, Thermochim. Acta, 2001, 380, 209–215 CrossRef CAS.
- C. O. Hendren, X. Mesnard, J. Droege and M. R. Wiesner, Environ. Sci. Technol., 2011, 45, 2562–2569 CrossRef CAS PubMed.
- K. Schmid and M. Riediker, Environ. Sci. Technol., 2008, 42, 2253–2260 CrossRef CAS.
- J. Labille, J. Feng, C. Botta, D. Borschneck, M. Sammut, M. Cabie, M. Auffan, J. Rose and J.-Y. Bottero, Environ. Pollut., 2010, 158, 3482–3489 CrossRef CAS PubMed.
- X. Chen and S. S. Mao, Chem. Rev., 2007, 107, 2891–2959 CrossRef CAS PubMed.
- A. Weir, P. Westerhoff, L. Fabricius, K. Hristovski and N. von Goetz, Environ. Sci. Technol., 2012, 46, 2242–2250 CrossRef CAS PubMed.
- F. Gottschalk, T. Sun and B. Nowack, Environ. Pollut., 2013, 181, 287–300 CrossRef CAS PubMed.
- X. Liu, G. Chen, A. A. Keller and C. Su, Environ. Sci.: Processes Impacts, 2013, 15, 169–189 CAS.
- B. J. R. Thio, D. Zhou and A. A. Keller, J. Hazard. Mater., 2011, 189, 556–563 CrossRef CAS PubMed.
- C. Guéguen and C. W. Cuss, J. Chromatogr. A, 2011, 1218, 4188–4198 CrossRef PubMed.
- J. Courtois and J. F. Berret, Langmuir, 2010, 26, 11750–11758 CrossRef CAS PubMed.
- http://www.humicsubstances.org/elements.html - Accessed May 3, 2015.
- J. D. Ritchie and E. M. Perdue, Geochim. Cosmochim. Acta, 2003, 67, 85–96 CrossRef CAS.
- H. Kominami, M. Itonaga, A. Shinonaga, K. Kagawa, S. Konishi and Y. Kera, in Preparation of vanadium-based catalysts for selective catalytic reduction of nitrogen oxides using titania supports chemically modified with organosilanes, ed. S.i. S. S. a. Catalysis, Elsevier, 2000, vol. 143, pp. 1089–1096 Search PubMed.
- J. A. Leenheer and J. P. Croue, Environ. Sci. Technol., 2003, 37, 18A–26A CrossRef CAS.
- P. Conte and A. Piccolo, Environ. Sci. Technol., 1999, 33, 1682–1690 CrossRef CAS.
- D. Smejkalova and A. Piccolo, Environ. Sci. Technol., 2008, 42, 699–706 CrossRef CAS.
- J. Buffle, Complexation reactions in aquatic systems: an analytical approach, Ellis Horwood, Chichester, 1988 Search PubMed.
- J. Buffle, K. J. Wilkinson, S. Stoll, M. Filella and J. W. Zhang, Environ. Sci. Technol., 1998, 32, 2887–2899 CrossRef CAS.
- H.-R. Schulten, P. Leinweber and M. Schnitzer, Structure and Surface Reactions of Soil Particles, ed. M. Huang, N. Senesi and J. Buffle, Wiley, New York, 1998, pp. 281–324 Search PubMed.
- V. Ravi, J. M. Binz and R. M. Rioux, Nano Lett., 2013, 13, 4442–4448 CrossRef CAS PubMed.
- M. S. Searle and D. H. Williams, J. Am. Chem. Soc., 1992, 114, 10690–10697 CrossRef CAS.
- T. Chatterjee, S. Chakraborti, P. Joshi, S. P. Singh, V. Gupta and P. Chakrabarti, FEBS J., 2010, 277, 4184–4194 CrossRef CAS PubMed.
- S. Chakraborti, T. Chatterjee, P. Joshi, A. Poddar, B. Bhattacharyya, S. P. Singh, V. Gupta and P. Chakrabarti, Langmuir, 2010, 26, 3506–3513 CrossRef CAS PubMed.
- M. De, C.-C. You, S. Srivastava and V. M. Rotello, J. Am. Chem. Soc., 2007, 129, 10747–10753 CrossRef CAS PubMed.
- J. Gregory, Flocculation by polymers and polyelectrolytes, Solid/liquid dispersions, Academic Press, London, 1987 Search PubMed.
- M. Elimelech, J. Gregory, X. Jia and R. A. Williams, Particle deposition and aggregation: Measurement, modeling, and simulation, Butterworth-Heinemann Ltd, Oxford, 1995 Search PubMed.
- J. Gregory, J. Colloid Interface Sci., 1973, 42, 448–456 CrossRef CAS.
- E. Tombacz, Soil Sci., 1999, 164, 814–824 CrossRef CAS.
- F. Loosli, P. Le Coustumer and S. Stoll, Water Res., 2013, 47, 6052–6063 CrossRef CAS PubMed.
- F. Loosli, L. Vitorazi, J.-F. Berret and S. Stoll, Water Res., 2015, 80, 139–148 CrossRef CAS PubMed.
Footnote |
| † Electronic supplementary information (ESI) available. See DOI: 10.1039/c5en00139k |
| This journal is © The Royal Society of Chemistry 2015 |

