Biological and environmental media control oxide nanoparticle surface composition: the roles of biological components (proteins and amino acids), inorganic oxyanions and humic acid†
Imali A.
Mudunkotuwa
and
Vicki H.
Grassian
*
Department of Chemistry, University of Iowa, Iowa City, USA. E-mail: vicki-grassian@uiowa.edu
First published on 18th August 2015
Abstract
Current practices of initial nanoparticle characterization with respect to particle size, shape, surface and bulk composition prior to experiments to test, for example, cellular interaction or toxicity, will not accurately describe nanomaterials in a given medium. The use of initial characterization data in subsequent analyses inherently assumes that nanoparticles are static entities. However, nanoparticle characterization, which is crucial in all studies related to their applications and implications, should also include information about the dynamics of the interfacial region between the nanomaterial surface and the surrounding medium. The objective of this tutorial review is to highlight the importance of in situ characterization of metal oxide nanoparticle surfaces in complex media. In particular, several examples of TiO2 (5 nm) and α-Fe2O3 (2 nm) nanoparticles, in different environmental and biological media, are presented so as to show the importance of the milieu to oxide surface composition. The surface composition is shown to be controlled by the adsorption of biological components (proteins and amino acids), inorganic oxyanions (phosphates and carbonates) and environmental ligands (humic acid). The extent of surface adsorption depends on the solution phase composition and the affinity of different components to adsorb to the nanoparticle surface. The examples presented here show that there is a range of possible surface interactions, adsorption energetics and adsorption modes including reversible adsorption, irreversible adsorption and co-adsorption.
Nano impactSurfaces play an important role in the toxicity and fate of nanomaterials. However, what exactly is adsorbed on the surface of nanomaterials in different biological and environmental media is often unknown. Examples of surface composition and speciation of oxide nanoparticles, TiO2 and α-Fe2O3, in a range of different media are presented. The extent of surface adsorption depends on the solution phase composition and the affinity of different components to adsorb to the nanoparticle surface. It is shown that there is a range of possible surface interactions and adsorption energetics. |
Introduction
Development of sustainable nanotechnology includes understanding the environmental health and safety of engineered nanomaterials. Recognition of this fact has led to numerous studies focused on the interactions of engineered nanomaterials with environmental and biological systems. Experimental studies focused on these interactions are often done by placing nanoparticles in a variety of biological and environmental matrices with different ligand types of varying concentrations at different pH, ionic strength and relative humidity conditions.1–3 However, since nanoparticle surfaces have high free energy, thermodynamic driving forces will act to minimize the surface energy, and nanoparticles will undergo different chemical and physical transformations including dissolution, aggregation, surface reconstruction and surface ligand adsorption. Therefore it is important to consider nanoparticles as dynamic entities that undergo transformations that depend on the solution pH, ionic strength and composition. In environmental or biological systems, the surrounding milieu will drive these interactions. Therefore, there can be significant changes in the composition and properties of the nanomaterial surface under a range of conditions.2,4,5 Several types of transformations and changes in the physicochemical properties of nanomaterial surfaces are shown pictorially in Fig. 1. These processes include surface adsorption, ligand displacement, dissolution, re-precipitation and reaction chemistry. One or more of these may play a role in the behavior of nanoparticles in solution. In addition, which processes occur will depend on the details of the solution properties, e.g. pH, ionic strength and presence of solutes.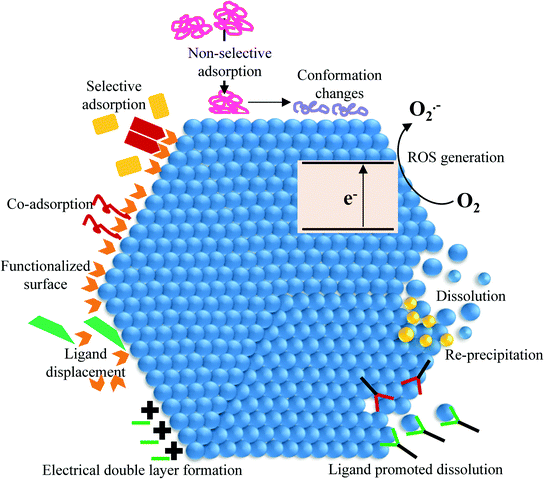 | ||
| Fig. 1 Pictorial diagram showing different physicochemical processes that can occur on nanoparticle surfaces. | ||
In particular, surface modification of nanoparticles occurs when nanoparticles are placed in biological and environmental media. These modifications depend on a number of important variables. One of the key variables controlling surface modifications of nanomaterials is surface charge.6–9 If the surface is positively charged, negatively charged ligands will have a higher affinity towards the surface – in these cases electrostatic interactions dominate. In cases where the surface is negatively charged, electrostatic interactions prevail again but now with positively charged ligands showing preferential binding. These interactions with negatively or positively charged ligands can potentially reverse the surface charge of the nanoparticles in the media. Since surface charge has been shown to play an important role in cellular uptake, toxicity and immune responses, these surface interactions clearly need to be fully understood. Bozich and co-workers have demonstrated in a recent study on the toxicity of functionalized Au nanoparticles to Daphnia magna that the positively charged Au nanoparticles having higher affinity towards the negatively charged surface of the cellular membranes caused more damage than their negatively charged counterparts.6 Similar results have been reported by Liu and co-workers as well using Au nanoparticles and phagocytic/non-phagocytic cell lines.10 Furthermore, surface charge is very much dependent on the pH and the ionic strength of the medium.9 For a given medium the same nanoparticle has the potential to have different behaviors depending upon on the solution pH and the ionic strength resulting in different levels of uptake and toxicity.
In addition, nanoparticles are often deliberately functionalized for different desired properties including enabling the formation of stable suspensions.11,12 The general conjugation strategies used for biomedical applications can be broadly categorized as covalent/dative, non-covalent and encapsulation.13 Some of these strategies result in the presence of labile functional groups on the surface whereas others do not. These labile functional groups can be easily displaced by the components in the biological medium, especially proteins.14 This can have both favorable and unfavorable implications for the intended use of the engineered nanoparticle of interest.15 For nanoparticles used in targeted drug delivery systems with antibody-functionalization, the displacement of its surface functional groups can be problematic. When functional groups are strongly and irreversibly bound then displacement is not possible. However, environmental transformations can still occur and biological components may co-adsorb onto the surface yielding a change in surface charge, size and hydrophobicity.
Fig. 2 gives a summary of some examples of different transformations that have been observed to occur with metal and metal oxide nanomaterials in atmospheric or aquatic environments.14,16–20 These transformations can potentially affect the nanomaterial atmospheric and solution phase behavior by altering transport properties, and the state of the nanoparticle (whether isolated, aggregated or dissolved into ions), which will ultimately affect their uptake and toxicity.21 Although atmospheric transformations can be mapped by characterization techniques that can be used under vacuum conditions, transformations in aqueous media are more difficult to follow.22,23 Therefore, in this tutorial review we show and discuss transformations of oxide nanoparticle surfaces, α-Fe2O3 and TiO2 (ESI† Fig. S1 shows initial characterization data), due to the adsorption of ligands in different biological and environmental media (ESI† Table S1 gives compositions of media used). The tutorial review focuses on several case studies including new results recently conducted in our laboratory. Additionally, this review also suggests that surface charge and functionality imparted on the nanoparticle surface through engineered functionalization may be significantly altered in complex mixtures.
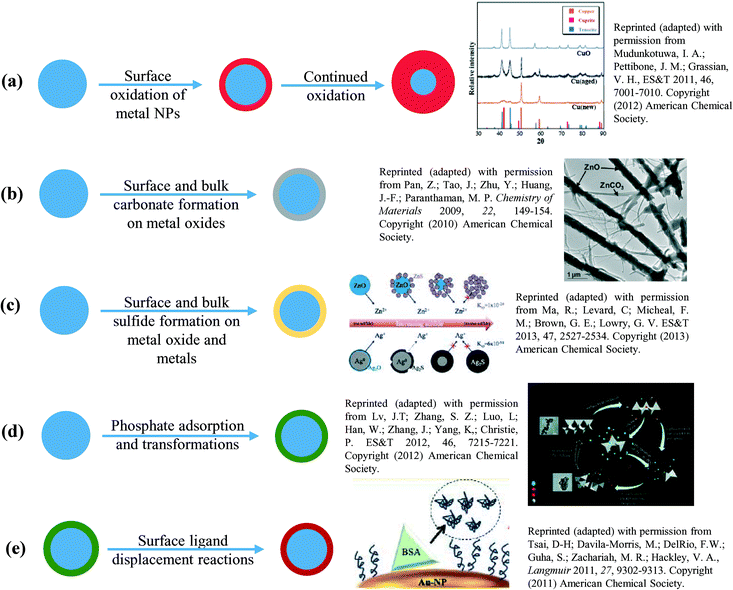 | ||
| Fig. 2 Environmental transformations of metal and metal oxide nanomaterials. Here (a) and (b) are generally observed in atmospheric environments while (c)–(e) are more commonly observed in aqueous environments. See ref. 14 and 16–19. | ||
Surface transformations of nanomaterials in different biological media
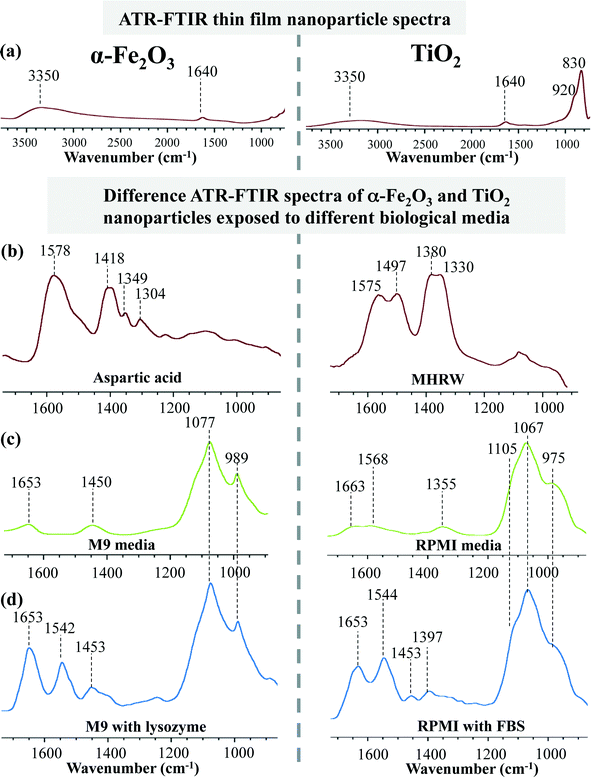
As already noted, a key limitation in our ability to predict nanomaterial fate and transformation in complex biological and environmental media is often directly connected with the lack of understanding of the dynamics at the surface, i.e. the complexity of the interfacial region between the nanoparticle surface and the aqueous phase surrounding it.24 While extensive nanoparticle characterization is now conducted as a standard protocol prior to proceeding with any form of application/implication study, this information fails to capture surface processes that take place when nanoparticles are placed into different media.5 Often these media formulations are prepared to simulate and/or be compatible with different types of biological and environmental systems and consist of a variety of inorganic and organic ligands that include, but are not limited to, chlorides, phosphates, carbonates, organic acids, natural organic matter (NOMs), steroids, amino acids, proteins and lipids. Once nanoparticles are exposed to these complex matrices depending on the nature of interaction there can be either surface or bulk transformations taking place. In any event, the biological/environmental identity of the nanomaterial is subject to change thus yielding information gleaned from initial characterization data to be of potential limited use.Fig. 3 demonstrates how ligand adsorption from different media impacts nanoparticle surface composition. Two different nanoparticles, 2 nm iron oxide (Fig. 3a – left panel) and 5 nm titanium dioxide (Fig. 3a – right panel), when exposed to different biological and environmental media for a variety of different experiments conducted in our laboratory give very different surface spectra as measured by ATR-FTIR spectroscopy.24,25 These studies start with a thin film of hydrated nanoparticles placed onto an ATR crystal. Oxide nanoparticles surfaces are truncated by hydroxyl groups which readily adsorb water as seen by the broad O–H stretching mode centered at 3350 cm−1 as well as the water bending mode at 1640 cm−1. There is no readily apparent organic contamination on these surfaces. Additionally, metal oxide lattice vibrations are observed at lower frequency, in the 800–1000 cm−1 wavenumber region.
As these nanoparticles are exposed to different biological and environmental media, i.e. aqueous solutions of differing composition containing biological components and inorganic salts, there are large changes observed in these spectra, which can be easily seen in the difference spectra plotted in Fig. 3b–d. The difference spectra subtract out the water absorption and lattice vibration. The remaining absorption bands arise from the vibrations of new surface species. These changes show quite conclusively that in each medium these nanoparticles have a unique surface composition. This unique surface identity is determined by the ligands that interact with the nanoparticle surface with the highest affinity for adsorption. The layer of surface ligands giving the unique identity to the nanoparticle is commonly referred to as the “corona”. Studies have shown the corona to be retained upon cellular uptake.26 However, once inside the cells, nanoparticles can then be taken into the lysosome where the corona is degraded and bare nanoparticles are exposed.27 The mechanism of corona degradation is not yet fully understood. However, at lower pH, different inorganic salts and different ligands within the lysosome are considered to play a role in this process.26,27 Thus investigating the interactions between surface ligands and nanoparticle surfaces takes a step towards elucidating these degradation mechanisms.
For single component solution systems it can be assumed that the surface coating is fairly uniform, e.g. when nanoparticles are deliberately surface functionalized with one adsorbate. Fig. 3b – left panel shows an example of the adsorption of L-aspartic acid on 2 nm α-Fe2O3 nanoparticles. Aspartic acid is adsorbed onto the particle surface and there is nothing else to compete with its adsorption except for water molecules. However, with increasing complexity other components can easily adsorb and provide a competitive adsorption process. In several of the other spectra shown in Fig. 3, the spectra consist of broad absorption bands, which may correspond to multiple adsorbed species and/or different environments on the nanoparticle surface. For example, M9 media, a well-known buffered solution used for cell and embryo nanotoxicity studies, are composed of Na2HPO4, KH2PO4, NaCl, NH4Cl, MgSO4, CaCl2 and glucose.25,28 When 2 nm α-Fe2O3 nanoparticles are exposed to this medium the vibrational bands corresponding to adsorbed phosphates (HPO42− and H2PO4−) dominate the ATR-FTIR spectrum indicating preferential binding of the phosphates to the particle surface (Fig. 3c – left panel).29,30 However, this does not prevent lysozyme from adsorbing to the surface when it is also introduced to the medium as observed by absorption bands at 1653 and 1542 cm−1 (Fig. 3d – left panel).25 While these data highlight the fact that both phosphates and lysozymes have high affinity towards the nanoparticle surface, they also raise further questions about competitive adsorption, strength of the adsorption and the overall role of ligand adsorption in nanoparticle interactions with cells and/or organisms.
TiO2 nanoparticles (Fig. 3 – right panel) also show similar behavior in terms of ligand adsorption from the surrounding medium. As discussed previously, when these particles are exposed to moderately hard reconstituted water (MHRW) which contains mainly sodium bicarbonate, the surface is immediately covered by adsorbed carbonate as seen by the spectrum shown in Fig. 3b – right panel.24 MHRW is commonly used for culture and testing of various invertebrates and vertebrates, including Daphnia magna, Ceriodaphnia dubia, Pimephales promelas and Daphnia pulex31–33 (MHRW supplied by Professor Rebecca Klaper University of Wisconsin-Milwaukee as noted in ref. 24). These are in vivo models that are commonly used in many nanotoxicology studies. The main point here is that upon exposure to this medium, the initial surface characterization of nanomaterials being studied may not accurately describe the surface properties as the carbonate adsorption can result in changes in surface charge that will govern nanoparticle solution phase behavior. Not only does MHRW impact surface composition, but so does Roswell Park Memorial Institute medium (RPMI) used as a tissue and cell culture medium.24 Similar to the M9 solution, RPMI contains a high level of phosphates in addition to amino acids, vitamins, 4-(2-hydroxyethyl)-1-piperazineethanesulfonic acid (HEPES) and several other inorganic salts. All these components have the potential to adsorb onto the nanoparticle surface (Fig. 3c – right panel).24 However, with the addition of fetal bovine serum (FBS), which contains BSA protein, there is preferential protein binding observed which is similar to what was observed with lysozyme adsorbed in M9 medium (Fig. 3d – right panel). A general trend observed in both the cases is the high affinity of proteins toward the nanoparticle surfaces as has been discussed in several other studies.34–36
Relative affinities of surface adsorbed ligands
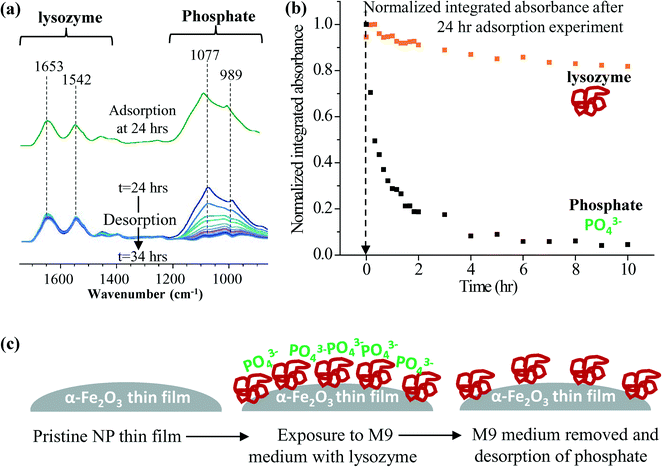
The ultimate surface identity of nanomaterials in biological media with a number of different components is determined by the relative affinities of each component towards the nanoparticle surface.37 Depending on the initial surface ligand affinity the nanoparticle surfaces may or may not undergo further changes. Surface ligands with relatively low affinity are easily displaced by those with higher affinity. Tsai and co-workers have shown in their investigations that when low molecular weight thiolated poly(ethylene glycol) (SH-PEG) functionalized gold nanoparticles are exposed to bovine serum albumin (BSA) the functional groups get displaced.14 However, when high molecular weight SH-PEG is on the surface, the incoming BSA molecules co-adsorb and the existing functional groups only rearrange on the surface. Bagaria and co-workers have shown in their investigations of FePt nanoparticles functionalized with oleic acid and oleyl amine that mercaptoalkanoic acid displaces both functional groups.38 The knowledge gained by similar studies can be extensively used in tailoring the nanoparticle surface functionalities. Additionally, these occur under strictly controlled experimental conditions. Few studies have measured such processes that take place spontaneously in biological and environmental media on nanomaterial surfaces in environmental health and safety studies. Such transformations can have a significant impact on the experimental outcomes related to nanoparticles.A rapid approach for assessing the surface ligand affinity is to conduct desorption experiments following the adsorption. In our work ATR-FTIR spectroscopy is used (see ESI† for additional details of experimental methods). An example study investigating relative affinities of the surface adsorbed species on 2 nm α-Fe2O3 nanoparticles exposed to M9 solution with lysozyme is given in Fig. 4a. These spectra clearly show decreasing peak intensities (1077 and 989 cm−1) corresponding to the surface phosphate desorption and constant peaks for adsorbed lysozymes (1653 and 1542 cm−1). With further analysis of these two regions as given in Fig. 4b it is evident that the normalized integrated absorbance corresponding to lysozymes is constant while for phosphate it decreases and approaches zero. Therefore, this inorganic oxyanion, phosphate, shows reversible adsorption suggesting that it can be considered as a labile surface ligand potentially associated with adsorbed BSA as depicted in the cartoon representation (Fig. 4c). Since the phosphate is charged, its adsorption will impact the surface charge of the nanoparticle. In contrast, lysozyme irreversibly adsorbs to the surface. Interestingly, this bound lysozyme has been proposed to lead to the impairment of antimicrobial function.25 This irreversible binding may contribute towards the lowered antimicrobial activity by lowering the “free” lysozyme concentration in the medium.
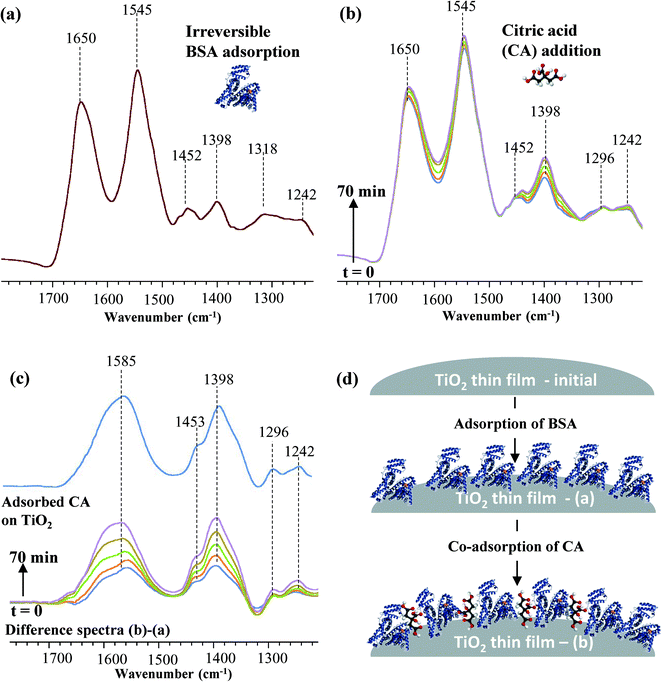
In another study in our laboratory with BSA adsorption on TiO2 nanoparticles, it was observed that BSA protein binds irreversibly to the TiO2 NP surface (Fig. 5a) and is not displaced upon exposure to citric acid solution (1 mM). In fact, ATR-FTIR spectroscopy demonstrated that citric acid co-adsorbs onto the BSA coated TiO2 NP surface. Sequential introduction of citric acid to the BSA coated TiO2 NP surface results in an overall increase in the IR spectral intensity with time (Fig. 5b). This was further confirmed by the difference spectra obtained as illustrated in Fig. 5c. The difference spectra show no negative features upon citric acid adsorption which would be the case if any displacement of BSA is taking place. We hypothesize that the smaller size of the citric acid molecule relative to the BSA enables it to diffuse onto the surface of the nanoparticles without displacing the BSA protein (Fig. 5d). The corresponding vibrational band assignments for the adsorbed BSA and citric acid are given in Table 1. Interestingly, co-adsorbed citric acid was found to irreversibly adsorb to the surface as desorption studies in pure Optima™ water did not result in any decrease in the intensity of the peaks. Co-adsorption can confer multiple functionalities upon a particular nanomaterial system, which in terms of toxicity studies can result in uncontrolled uptake and distribution within a given biological system. According to the extensive review on nanoparticle functionalization with biological molecules to facilitate bionanotechnology, this field is still in its development stage although considerable progress has been made over time.13 One of the challenges stated here is the controlled and triggered delivery/release at the target location. This requires thorough understanding of these bio-conjugated nanoparticle dynamics in their local environments.
| Species | Vibrational mode | Wavenumber (cm−1) |
|---|---|---|
| BSA – amide I |
ν
s(C![[double bond, length as m-dash]](https://www.rsc.org/images/entities/char_e001.gif) O)major + νs(C–N)minor O)major + νs(C–N)minor |
1600–1700 |
| BSA – amide II | ν s(C–N) + δ(N–H)out of phase | 1510–1580 |
| BSA – amide III | ν s(C–N) + δ(N–H)in phase | 1200–1400 |
| CA | ν as(COO−) | 1585 |
| CA | ν s(COO−) | 1398 |
| CA | δ(CH) | 1453 |
Interaction of natural organic matter with engineered metal oxide nanomaterials
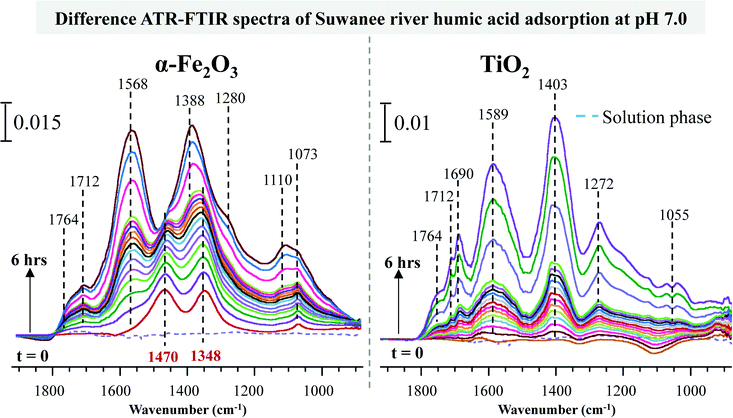
Investigations conducted with nanomaterials in environmental media must assume there will be an interaction with natural organic matter (NOM). Many studies in the literature have provided evidence of altered aggregation behavior in the presence of NOM, which is a key indicator of changing surface properties in the presence of NOM.39–42 NOM adsorption in many of these cases has been shown to promote aggregation but at the same time reduce the uptake and toxicity to test species such as soil organisms.Fig. 6 is an illustration of some initial studies conducted in our laboratories investigating Suwanee river humic acid (SRHA). These spectra were collected over a period of 6 hours as the humic acid solution (20 μg mL−1, pH 4.4) was introduced over the respective nanoparticle thin film. The resulting spectra have been recorded and analyzed. The corresponding vibrational modes are assigned and compared to literature values (Table 2). SRHA readily adsorbs to both metal oxide surfaces with α-Fe2O3 nanoparticles showing a relatively stronger adsorption. In particular, the ATR-FTIR spectra of α-Fe2O3 adsorbed SRHA show two new bands at 1348 and 1470 cm−1 during initial time points, which correspond to carboxylate groups strongly adsorbed to the surface iron atoms.43,44 Spectral evolution as a function of time shows clear differences between the two metal oxide nanoparticles. As time increases, additional bands grow in and overlap with these two initially observed bands at 1348 and 1470 cm−1. This suggests that SRHA adsorbed directly on the α-Fe2O3 surface has a different mode of adsorption to the ones in subsequent layers. Desorption experiments conducted showed no decrease in the band intensities suggesting both adsorption modes are irreversible. Although TiO2 nanoparticles showed a single mode of adsorption it was also observed to be irreversible. Such irreversible surface modifications in actual environmental media containing SRHA can result in the formation of NP embedded NOMs. The properties of these new entities can potentially impact the underlying experimental design by changing transport properties and uptake. No investigations have been conducted so far on the long-term effects of NP embedded NOMs. Additionally, much work is still needed to determine the effects exerted by similar nanomaterials on the structure of NOMs under ambient environmental conditions. In fact there is evidence of photocatalytic degradation of NOMs in the presence of TiO2 nanoparticles.45,46 However, in order to have a key understanding about these modes of interactions a hyphenated set of tools and techniques are required due to the extremely complex structure of humic acid.
| Functional groups | Vibrational mode | Wavenumber (cm−1) | ||
|---|---|---|---|---|
| Literature (solution) | This study | |||
| TiO2 | α-Fe2O3 | |||
| Ketones, carboxylic acid, saturated ethers |
ν
s(C![[double bond, length as m-dash]](https://www.rsc.org/images/entities/char_e001.gif) O) O) |
1730 | 1712, 1764 | 1712, 1764 |
| Quinones and conjugated ketones |
ν
s(C![[double bond, length as m-dash]](https://www.rsc.org/images/entities/char_e001.gif) O) O) |
1640 | 1690 | — |
| Aromatic alkenes |
ν
s(C![[double bond, length as m-dash]](https://www.rsc.org/images/entities/char_e001.gif) C) C) |
1580–1620 | 1589 | 1568 |
| Aliphatic carbons | δ(CH2), δ(CH3) | 1378–1460 | 1403 | 1388 |
| Phenolic alcohols | ν s(Ph–O–H) | 1270–1285 | 1272 | 1280 |
| Carbohydrates and polysaccharide-like substances | ν s(C–O) | 950–1125 | 1055 | 1073, 1110 |
Conclusions and some recommendations
The dynamic nature of the nanomaterial surfaces makes in situ characterization in biological media quite challenging. There are no standards reported in terms of post characterization as there are with initial characterization methods that can be done prior to toxicity experiments. Therefore, it is unclear which physicochemical characterizations are important. Nevertheless in the literature there are several studies that provide helpful indications of important physicochemical parameters that need to be measured either in situ or post experiments.The most likely change that can occur with nanomaterials in biological media is surface functionality. The components of the biological media adsorb onto these surfaces and change the surface identity as discussed in the previous section. The composition of this adsorbed layer is one important parameter that needs to be determined. This is important as it can be a “Trojan horse” effect whereby contaminant molecules will be carried in and cause undesirable effects within biological systems.47,48 It also has the ability to adsorb and remove components from the biological media.25 In terms of toxicity studies this can interfere and/or mask any effects due to nanoparticles themselves and in terms of applications can cause uncontrolled functionality at the surface. Surface ligand adsorption can also cause nanomaterial dissolution and generate ions, and even smaller nanoparticles with enhanced mobility and uptake properties.16 Many techniques including, but not limited to, ATR-FTIR spectroscopy, mass spectrometry, and surface enhanced Raman spectroscopy are capable of providing information on the composition of the surface adsorbed layers.25,49,50
Not only the composition but also the thickness of this surface layer and the surface coverage are important characteristic features that can facilitate better interpretation of experimental data.51 Pease and co-workers have used electrospray-differential mobility analysis (ES-DMA) to determine the DNA surface coverage on Au nanoparticles by measuring the size before and after surface functionalization. A similar approach can be used to obtain the coating thickness for nanoparticles during their post characterization. The thickness of the surface adsorbed layer will determine the overall size of nanoparticles and therefore will directly affect their uptake by cells.52 Not only that, in applications where the functionality stems from the nanomaterial core, the surface coverage and the thickness of the surface adsorbed layer will be critical parameters that need to be controlled. For an example, where surface enhanced Raman spectroscopy (SERS) is used as the method of detection, the surface coating thickness plays a key role.53–55
Nanoparticle aggregation can vary between different biological media as a result of their surface functionality, pH and ionic strength. Thus another key characterization that needs to be conducted in situ and after experiments is determination of the aggregate size. This has proved to be significantly different from the initially characterized primary particle size in almost all the occasions. The aggregation also plays a key role in nanoparticle uptake and masking the size dependent properties of nanomaterials.56,57 There is always the possibility of particle dissolution, which will have the opposite effect of aggregation and therefore post analysis of the particle size and shape is also important to better understand the experimental observations. A comparison between the initial characterization and post characterization will provide invaluable information as to how the surface transformations proceeded during a given experimental set up. Dynamic light scattering (DLS) and nanoparticle tracking analysis (NTA) are examples of techniques providing ensemble measurements while electron microscopy can provide useful information on the particle size post exposure.
There are also instances where even the nanoparticle core can get modified subsequent to these surface modifications. For example, in one of our recent studies it was found that Cu nanoparticles upon exposure to citric and oxalic acid undergo complete surface and core oxidation into Cu2O within 24 hours.16 Thus, if these Cu nanoparticles are used in chronic toxicity studies, the results will reflect the toxicity of Cu2O nanoparticles rather than Cu nanoparticles themselves. This example also emphasizes the need for in situ characterization, which is a grand challenge that has been difficult to overcome, or, at the very least, post characterization of nanomaterials in nanotoxicology studies.
Many investigations use primary characterization data in explaining the toxicity data and size dependent properties. With such an approach, nanomaterials are assumed to be static entities. As highlighted here, it is clear that initial characterization data for nanomaterials is just a starting point and may not be sufficient, especially in biological and environmental systems. Therefore, new standards and protocols for in situ and post characterization of nanomaterials are needed. In addition, it is crucial to report the composition and the concentrations at which the laboratory experiments are conducted especially to enable comparison across studies.58 Furthermore, in situ and post characterization of nanomaterials will provide additional insight into nanomaterial risk assessment. Although it would be more advantageous to have techniques that probe suspended nanoparticles in aqueous media compared to nanoparticle thin films, this tutorial review demonstrates two important concepts. First, the surface composition is controlled by certain biological, inorganic and organic acid components of the medium. Second, ATR-FTIR spectroscopy is a technique capable of probing the dynamic nature of oxide nanoparticle surfaces in increasingly complex milieu thus providing insights into nano–biological and nano–environmental interfaces.
Acknowledgements
This material is based on the work supported by the National Science Foundation under grant CBET1424502. Any opinions, findings and conclusions or recommendations expressed in this material are those of the authors and do not necessarily reflect the views of the National Science Foundation. The authors would like to thank Matt Burian for conducting ATR-FTIR experiments on aspartic acid adsorption on α-Fe2O3. A portion of this tutorial review was presented at the 9th International Conference on the Environmental Effects of Nanoparticles and Nanomaterials, South Carolina, USA, September 2014.References
- P. Luo, I. Morrison, A. Dudkiewicz, K. Tiede, E. Boyes, P. O'Toole, S. Park and A. B. Boxall, J. Microsc., 2013, 250, 32–41 CrossRef CAS PubMed
.
- L. R. Pokhrel, B. Dubey and P. R. Scheuerman, Environ. Sci.: Nano, 2014, 1, 45–54 RSC
.
- R. E. Ozel, K. N. Wallace and S. Andreescu, Environ. Sci.: Nano, 2014, 1, 27–36 RSC
.
- A. R. Petosa, D. P. Jaisi, I. R. Quevedo, M. Elimelech and N. Tufenkji, Environ. Sci. Technol., 2010, 44, 6532–6549 CrossRef CAS PubMed
.
- G. V. Lowry, K. B. Gregory, S. C. Apte and J. R. Lead, Environ. Sci. Technol., 2012, 46, 6893–6899 CrossRef CAS PubMed
.
- J. S. Bozich, S. E. Lohse, M. D. Torelli, C. J. Murphy, R. J. Hamers and R. D. Klaper, Environ. Sci.: Nano, 2014, 1, 260–270 RSC
.
- A. Verma and F. Stellacci, Small, 2010, 6, 12–21 CrossRef CAS PubMed
.
- A. K. Murthy, R. J. Stover, W. G. Hardin, R. Schramm, G. D. Nie, S. Gourisankar, T. M. Truskett, K. V. Sokolov and K. P. Johnston, J. Am. Chem. Soc., 2013, 135, 7799–7802 CrossRef CAS PubMed
.
- I. A. Mudunkotuwa and V. H. Grassian, J. Am. Chem. Soc., 2010, 132, 14986–14994 CrossRef CAS PubMed
.
- X. Liu, N. Huang, H. Li, Q. Jin and J. Ji, Langmuir, 2013, 29, 9138–9148 CrossRef CAS PubMed
.
- R. A. Sperling and W. J. Parak, Philos. Trans. R. Soc., A, 2010, 368, 1333–1383 CrossRef CAS PubMed
.
- E. Amstad, M. Textor and E. Reimhult, Nanoscale, 2011, 3, 2819–2843 RSC
.
- K. E. Sapsford, W. R. Algar, L. Berti, K. B. Gemmill, B. J. Casey, E. Oh, M. H. Stewart and I. L. Medintz, Chem. Rev., 2013, 113, 1904–2074 CrossRef CAS PubMed
.
- D.-H. Tsai, M. Davila-Morris, F. W. DelRio, S. Guha, M. R. Zachariah and V. A. Hackley, Langmuir, 2011, 27, 9302–9313 CrossRef CAS PubMed
.
- I. Lokteva, N. Radychev, F. Witt, H. Borchert, J. R. Parisi and J. Kolny-Olesiak, J. Phys. Chem. C, 2010, 114, 12784–12791 CrossRef CAS
.
- I. A. Mudunkotuwa, J. M. Pettibone and V. H. Grassian, Environ. Sci. Technol., 2012, 46, 7001–7010 CrossRef CAS PubMed
.
- Z. Pan, J. Tao, Y. Zhu, J.-F. Huang and M. P. Paranthaman, Chem. Mater., 2009, 22, 149–154 CrossRef
.
- R. Ma, C. Levard, F. M. Michel, G. E. Brown and G. V. Lowry, Environ. Sci. Technol., 2013, 47, 2527–2534 CrossRef CAS PubMed
.
- J. Lv, S. Zhang, L. Luo, W. Han, J. Zhang, K. Yang and P. Christie, Environ. Sci. Technol., 2012, 46, 7215–7221 CrossRef CAS PubMed
.
- C. Levard, E. M. Hotze, G. V. Lowry and G. E. Brown, Environ. Sci. Technol., 2012, 46, 6900–6914 CrossRef CAS PubMed
.
-
S. Elzey, R. G. Larsen, C. Howe and V. H. Grassian, Nanoscience and Nanotechnology:Environmental
and Health Impacts, in Nanoscale Materials in Chemistry, John Wiley & Sons, Inc., 2009, pp. 681–727 Search PubMed
.
- A. J. Tiwari and L. C. Marr, J. Environ. Qual., 2010, 39, 1883–1895 CrossRef CAS PubMed
.
- G. E. Batley, J. K. Kirby and M. J. McLaughlin, Acc. Chem. Res., 2013, 46, 854–862 CrossRef CAS PubMed
.
- I. A. Mudunkotuwa, A. A. Minshid and V. H. Grassian, Analyst, 2014, 139, 870–881 RSC
.
- J. Borcherding, J. Baltrusaitis, H. Chen, L. Stebounova, C.-M. Wu, G. Rubasinghege, I. A. Mudunkotuwa, J. C. Caraballo, J. Zabner, V. H. Grassian and A. P. Comellas, Environ. Sci.: Nano, 2014, 1, 123–132 RSC
.
- F. Wang, L. Yu, M. P. Monopoli, P. Sandin, E. Mahon, A. Salvati and K. A. Dawson, Nanomed.: Nanotechnol., Biol. Med., 2013, 9, 1159–1168 CrossRef CAS PubMed
.
- M. Chanana, P. Rivera_Gil, M. A. Correa-Duarte, L. M. Liz-Marzán and W. J. Parak, Angew. Chem., Int. Ed., 2013, 52, 4179–4183 CrossRef CAS PubMed
.
- M. Ghoul, S. A. West, S. P. Diggle and A. S. Griffin, J. Evol. Biol., 2014, 27, 551–556 CrossRef CAS PubMed
.
- P. A. Connor and A. J. McQuillan, Langmuir, 1999, 15, 2916–2921 CrossRef CAS
.
- E. J. Elzinga and D. L. Sparks, J. Colloid Interface Sci., 2007, 308, 53–70 CrossRef CAS PubMed
.
- S. B. Lovern and R. Klaper, Environ. Toxicol. Chem., 2006, 25, 1132–1137 CrossRef CAS PubMed
.
- D. J. Soucek and A. J. Kennedy, Environ. Toxicol. Chem., 2005, 24, 1204–1210 CrossRef CAS PubMed
.
- S. Tang, Y. Wu, C. N. Ryan, S. Yu, G. Qin, D. S. Edwards and G. D. Mayer, Chemosphere, 2015, 120, 92–99 CrossRef CAS PubMed
.
- M. P. Monopoli, C. Aberg, A. Salvati and K. A. Dawson, Nat. Nanotechnol., 2012, 7, 779–786 CrossRef CAS PubMed
.
- A. Salvati, A. S. Pitek, M. P. Monopoli, K. Prapainop, F. B. Bombelli, D. R. Hristov, P. M. Kelly, C. Aberg, E. Mahon and K. A. Dawson, Nat. Nanotechnol., 2013, 8, 137–143 CrossRef CAS PubMed
.
- L. K. Braydich-Stolle, E. K. Breitner, K. K. Comfort, J. J. Schlager and S. M. Hussain, Langmuir, 2014, 30, 15309–15316 CrossRef CAS PubMed
.
- B. Pelaz, G. Charron, C. Pfeiffer, Y. Zhao, J. M. de la Fuente, X.-J. Liang, W. J. Parak and P. del Pino, Small, 2013, 9, 1573–1584 CrossRef CAS PubMed
.
- H. G. Bagaria, E. T. Ada, M. Shamsuzzoha, D. E. Nikles and D. T. Johnson, Langmuir, 2006, 22, 7732–7737 CrossRef CAS PubMed
.
- M. Baalousha, A. Manciulea, S. Cumberland, K. Kendall and J. R. Lead, Environ. Toxicol. Chem., 2008, 27, 1875–1882 CrossRef CAS PubMed
.
- B. Collin, E. Oostveen, O. V. Tsyusko and J. M. Unrine, Environ. Sci. Technol., 2014, 48, 1280–1289 CrossRef CAS PubMed
.
- A. Quigg, W.-C. Chin, C.-S. Chen, S. Zhang, Y. Jiang, A.-J. Miao, K. A. Schwehr, C. Xu and P. H. Santschi, ACS Sustainable Chem. Eng., 2013, 1, 686–702 CrossRef CAS
.
- G. R. Aiken, H. Hsu-Kim and J. N. Ryan, Environ. Sci. Technol., 2011, 45, 3196–3201 CrossRef CAS PubMed
.
- B. Gu, J. Schmitt, Z. Chen, L. Liang and J. F. McCarthy, Environ. Sci. Technol., 1994, 28, 38–46 CrossRef CAS PubMed
.
- K. Yang, D. Lin and B. Xing, Langmuir, 2009, 25, 3571–3576 CrossRef CAS PubMed
.
- Z. Yigit and H. Inan, Water, Air, Soil Pollut.: Focus, 2009, 9, 237–243 CrossRef CAS
.
- T. I. Nkambule, A. T. Kuvarega, R. W. M. Krause, J. Haarhoff and B. B. Mamba, Environ. Sci. Pollut. Res., 2012, 19, 4120–4132 CrossRef CAS PubMed
.
- E.-J. Park, J. Yi, Y. Kim, K. Choi and K. Park, Toxicol. In Vitro, 2010, 24, 872–878 CrossRef CAS PubMed
.
- V. Matranga and I. Corsi, Mar. Environ. Res., 2012, 76, 32–40 CrossRef CAS PubMed
.
- R. Eigenheer, E. R. Castellanos, M. Y. Nakamoto, K. T. Gerner, A. M. Lampe and K. E. Wheeler, Environ. Sci.: Nano, 2014, 1, 238–247 RSC
.
- D. Cialla, A. März, R. Böhme, F. Theil, K. Weber, M. Schmitt and J. Popp, Anal. Bioanal. Chem., 2012, 403, 27–54 CrossRef CAS PubMed
.
- L. F. Pease, D.-H. Tsai, R. A. Zangmeister, M. R. Zachariah and M. J. Tarlov, J. Phys. Chem. C, 2007, 111, 17155–17157 CrossRef CAS
.
- R. Yokel and R. MacPhail, J. Occup. Med. Toxicol., 2011, 6, 7 CrossRef CAS PubMed
.
- M. C. S. Pierre, P. M. Mackie, M. Roca and A. J. Haes, J. Phys. Chem. C, 2011, 115, 18511–18517 CrossRef CAS
.
- M. Vendrell, K. K. Maiti, K. Dhaliwal and Y.-T. Chang, Trends Biotechnol., 2013, 31, 249–257 CrossRef CAS PubMed
.
- L. Rodriguez-Lorenzo, L. Fabris and R. A. Alvarez-Puebla, Anal. Chim. Acta, 2012, 745, 10–23 CrossRef CAS PubMed
.
- A. Albanese and W. C. W. Chan, ACS Nano, 2011, 5, 5478–5489 CrossRef CAS PubMed
.
- W. Zhang, Y. Yao, N. Sullivan and Y. Chen, Environ. Sci. Technol., 2011, 45, 4422–4428 CrossRef CAS PubMed
.
- J. A. Kim, A. Salvati, C. Aberg and K. A. Dawson, Nanoscale, 2014, 6, 14180–14184 RSC
.
Footnote |
| † Electronic supplementary information (ESI) available. See DOI: 10.1039/c4en00215f |
| This journal is © The Royal Society of Chemistry 2015 |


