DOI:
10.1039/C4DT02323D
(Paper)
Dalton Trans., 2015,
44, 2554-2566
The strength of actinide–element bonds from the quantum theory of atoms-in-molecules†
Received
31st July 2014
, Accepted 17th September 2014
First published on 17th September 2014
Abstract
[AnX3]2(μ–η2:η2-N2) (An = Th–Pu; X = F, Cl, Br, Me, H, OPh) have been studied using relativistic density functional theory. Geometric and vibrational data suggest that metal→N2 charge transfer maximises at the protactinium systems, which feature the longest N–N bonds and the smallest σ(N–N), as a result of partial population of the N–N π* orbitals. There is very strong correlation of the standard quantum theory of atoms-in-molecules (QTAIM) metrics – bond critical point ρ, ∇2ρ and H and delocalisation indices – with An–N and N–N bond lengths and σ(N–N), but the correlation with An–N interaction energies is very poor. A similar situation exists for the other systems studied; neutral and cationic actinide monoxide and dioxides, and AnL3+ and AnL33+ (L = pyridine (Py), pyrazine (Pz) and triazine (Tz)) with the exception of some of the ∇2ρ data, for which moderate to good correlations with energy data are sometimes seen. By contrast, in almost all cases there is very strong correlation of interaction and bond energies with |ΔQQTAIMAn|, a simple QTAIM metric which measures the amount of charge transferred to or from the actinide on compound formation.
Introduction
The need to remove the minor actinides (MAs, i.e. americium and curium) from nuclear waste remaining after uranium and plutonium have been removed via the PUREX process1 is well documented.2 A possible approach for achieving such separations is to employ liquid extraction using ligands designed to selectively complex the MAs, but the relatively high concentration of lanthanide fission products in nuclear wastes hinders this process. The presence of the lanthanides is highly undesirable as they have high neutron capture cross sections and thus prevent the transmutation of the MAs to less hazardous isotopes in fast neutron reactors (one of the possible fates of the separated MAs). Unfortunately, the chemical similarity of the predominant Ln and MA oxidation state (+3) means that many potential extractants fail to adequately separate the MAs from the Ln(III). The design of suitable ligands for MA extraction is therefore a non-trivial problem, and there is much effort currently being devoted to it. In the United States, research continues to focus on the TALSPEAK process (Trivalent Actinide–Lanthanide Separation by Phosphorus reagent Extraction from Aqueous Komplexes), in which selective extraction of lanthanides is achieved by contacting a water-soluble aminopolycarboxylate complexant in a concentrated carboxylic acid buffer with a liquid cation exchanging extractant in an immiscible organic diluent.3,4 Sulphur-based ligands have also been shown to selectively bind An(III) to Ln(III).5,6 In Europe, research has centred on the synthesis of nitrogen-donor MA extractant ligands for use in the SANEX (Selective ActiNide EXtraction) process;7–16 BTPs (Fig. 1),17 BTBPs15 and, most recently, BTPhen18 ligands have all shown an impressive ability to effect the separation of MA(III) from Ln(III).
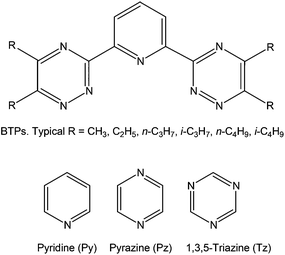 |
| | Fig. 1 2,6-Bis(triazinyl)-pyridines (BTPs, upper) and the three L type nitrogen-donor ligands (lower). | |
Computational quantum chemistry has been used to assess the extent of covalency in the f element–nitrogen bond, and in particular to determine whether there are differences between the MA and lanthanide compounds which would account for the observed separation factors. These studies employed the traditional tools of quantum chemistry such as charge, population and molecular orbital analysis, but no clear consensus emerged.12,16,19 Indeed, in 2010, Girnt et al. stated “the level of understanding of BTPs’ selectivity on a molecular level is insufficient to target the design of new, more efficient and selective partitioning reagents or fine-tune partitioning process conditions. Such advances are presently empirical, on a trial and error basis”.20 We suggest that this assessment remains true.
By contrast to the more traditional methods of assessing covalency, the Quantum Theory of Atoms-in-Molecules (QTAIM),21 pioneered by the late Richard Bader, focuses on the properties of the electron density rather than orbital structure. We first employed the QTAIM to assess trends in covalency as a function of actinide in AnCp422 and AnCp3 (An = Th–Cm; Cp = η5-C5H5).2,23 These studies were motivated partly by our own previous work,24 and also by that of Prodan et al.,25 which showed increasing metal–ligand orbital mixings and spin density transfers as the centre of the 5f series is approached. Curious to find out if such traditional indicators of covalency were accompanied by a build-up of charge density in the internuclear region, we were reassured to discover via the QTAIM that they were not; the actinide–carbon bond critical point (BCP) metrics indicated that compounds of americium and curium were the most ionic of the series. We have subsequently applied the technique to probe the bonding in a range of other actinide compounds, including Aracnac systems (Aracnac = ArNC(Ph)CHC(Ph)O),26 compounds featuring bidentate sulphur and selenium donor ligands,27,28 sulphur and selenium analogues of the uranyl ion,29 and small-cavity macrocyclic uranium complexes.30 Other research workers have also begun to use the QTAIM in molecular actinide chemistry, from both a computational31–34 and an experimental35,36 perspective, and there are also several solid state applications of the theory to the 5f elements (although these have tended to use the technique only to obtain atomic partial charges).37–41
Useful though the QTAIM is in assessing the relative extent of ionicity and covalency in heavy metal–ligand bonding, it would be equally if not more valuable if it could provide reliable measures of bond strength. It is highly likely that the strength of the MA–nitrogen bond in comparison with lanthanide analogues plays a role in the MA/Ln separation factors achieved by SANEX extractant ligands, and hence quantum chemical evaluation of bond strengths would be welcome both here and elsewhere in heavy element chemistry. To this end, we recently reported our first attempts to use the QTAIM to calculate actinide–element interaction energies.42 Our targets were M2X6 dimers (M = Mo, W, U; X = Cl, F, OH, NH2, CH3),43 (CO)5M–imidazole tautomers (M = Cr, Mo, W)44 and uranyl phosphinimine and phosphine oxide compounds,45 systems which we, and others, had previously studied using the energy decomposition approach (EDA) of Ziegler and Rauk.46,47 Comparison of the QTAIM and EDA data yielded some interesting conclusions; in particular we observed strong correlation between the QTAIM BCP electron density and metal–ligand interaction energies in systems where the latter is dominated by the orbital interaction term of the EDA. In the present contribution we extend our previous study to other actinide systems, with particular emphasis on compounds containing actinide–nitrogen bonds, with their clear relevance to MA separation technologies.
Computational details
All density functional theory calculations have been performed with the Gaussian 09 code, Revisions C.01 and D.01.48 For [AnX3]2(μ–η2:η2-N2) (An = Th–Pu; X = OPh, F, Cl, Br, Me, H) (14s 13p 10d 8f)/[10s 9p 5d 4f] segmented valence basis sets with Stuttgart–Bonn variety relativistic pseudopotentials were used for the actinides,49,50 with the cc-pVDZ basis set of Dunning for the other elements. The B3LYP51 functional was employed, in conjunction with the ultrafine integration grid. The standard SCF convergence criterion (10−8) was used, except for calculations on the Pa(OPh)3 and PaBr3 fragments, which were converged at the 10−6 level. All geometry optimisations of the high spin ground states of [AnX3]2(μ–η2:η2-N2) were performed with the Ci symmetry constraint, using the default convergence criteria, and the resulting structures were verified as true minima via harmonic vibrational frequency analysis. For two structures ([PaCl3]2(μ–η2:η2-N2) and [Pa(OPh)3)]2(μ–η2:η2-N2)) very small imaginary modes (<3i cm−1) were found; it is assumed that these arise from incompleteness in the integration grid, and do not represent genuine transition state structures. For [NpH3]2(μ–η2:η2-N2), a somewhat larger (88.2i cm−1) imaginary mode was found, which could not be eliminated.
The calculations on AnOn+, AnO2n+ (n = 0, 1, 2), AnL3+ and AnL33+ (L = Py, Pz, Tz – Fig. 1) employed the same pseudopotentials as those for the [AnX3]2(μ–η2:η2-N2) studies, but with g functions included in the valence space, and the basis sets for the non-actinide elements improved to the cc-pVTZ level. All of these calculations were subjected to wavefunction stability checks. In addition to B3LYP, the TPSS52 and TPSSh53 functionals were employed in the benchmarking studies of the actinide oxides, with TPSSh being chosen for the heterocycle calculations, as discussed in the main text. In order to simplify the analysis of the An–N bond in AnL33+, we constrained these systems to D3 symmetry. Harmonic frequency analysis subsequently revealed low frequency imaginary modes associated with symmetry breaking.
As part of the benchmarking studies on AnOn+ and AnO2n+, single-point calculations were performed at the pseudopotential optimised geometries using segmented all-electron relativistic basis sets with polarisation functions (SARCP) for the actinide elements.54 Point charge nuclei were used, as recommended for the SARCP basis set, rather than the default Gaussian form. Relativistic effects were included via the Douglas–Kroll–Hess Hamiltonian (both with and without spin–orbit corrections).
QTAIM analyses have been performed using the AIMALL program package,55 with .wfx and .fchk files generated in Gaussian used as the input.
Cartesian atomic coordinates of all the converged nitrogen-containing structures are shown in the ESI.†
Results and discussion
A brief recap of the QTAIM
The QTAIM has been described many times previously. For a full treatment, the reader is directed to Bader's seminal book21 and, for a more digestible introduction, to the excellent review by Matta and Boyd.56 Given the central role of the QTAIM in our current study, however, a brief recap of some of its features, and in particular the metrics we will make use of, is warranted. The QTAIM tells us that there is one BCP between each pair of atoms that are bonded to one another, the BCP being the point of lowest electron density along the bond path – the line of maximum electron density between two bonded atoms. Chemical bonding interactions may be characterised and classified according to the properties of the electron density ρ, its Laplacian ∇2ρ and the energy density H (the sum of the kinetic and potential energy densities) at these BCPs.56 Values of ρ greater than ca. 0.2 atomic unit (e per Bohr3) are typical of covalent (shared shell) interactions. By contrast, values of ρ < ca. 0.1 e per Bohr3 indicate closed shell interactions. ∇2ρ is generally significantly less than zero for covalent bonds,56 reflecting the concentration of electron density along the bond path linking the bonded atoms. H is negative for interactions with significant sharing of electrons, its magnitude reflecting the “covalence” of the interaction.57
As its name suggests, the QTAIM provides us with a rigorous definition of an atom in a molecule; the region of space around a nucleus (more correctly, a nuclear critical point in the electron density) bounded by the nearest zero flux surface in the gradient vector field of the electron density. The difference between the nuclear charge and the integral of the electron density within this atomic basin yields the QTAIM atomic partial charge. The magnitude of the exchange of electrons in the basin of atom A with those in the basin of atom B is termed the delocalization index between them, δ(A,B). It may be calculated between any pair of atoms, whether bonded or not, but when it is calculated between bonded atoms it yields a measure of the bond order between them.
[AnX3]2(μ–η2:η2-N2) (An = Th–Pu; X = OPh, F, Cl, Br, Me, H)
In 2011, we reported a density functional theory computational analysis of the uranium–dinitrogen bonding in [U(OPh)3]2(μ–η2:η2-N2), a model for Mansell and Arnold's [U(OAr3)]2(μ–η2:η2-N2) (Ar = 2,6-tBu2C6H3 or 2,4,6-tBu3C6H2).58 A ball and stick image of the optimised geometry of [U(OPh)3]2(μ–η2:η2-N2) is shown in Fig. 2. PBE and B3LYP calculations indicated that the only covalent U→N2 interaction in the high spin quintet ground state is backbonding, leading to a formal (UIV)2(N2)2− description of the electronic structure, as we had proposed previously for related systems.59–61 We also concluded that the N–N stretching wavenumber is a better metric of N2 reduction than is the N–N bond length, as we found excellent agreement between theory and experiment for the former but poorer agreement for the latter due to X-ray crystallographic underestimation of r(N–N).‡ One of the computational tools employed in this study was the QTAIM; the N–N BCP properties (ρ, ∇2ρ and H) were found to be typical of covalent bonds, and it was noticeable that the magnitude of these three BCP metrics were all smaller in complexed N2 than in free N2, consistent with the lengthening and weakening of the N–N bond on complex formation.
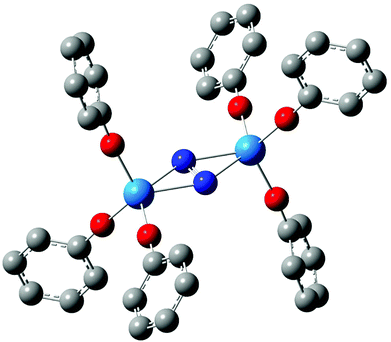 |
| | Fig. 2 Ball and stick image of the optimised geometry of [U(OPh)3]2(μ–η2:η2-N2).58 Hydrogen atoms are omitted for clarity. | |
We here report the extension of our previous calculations of [U(OPh)3]2(μ–η2:η2-N2) to the other actinides with well-established +4 oxidation states in molecular chemistry, i.e. thorium, protactinium, neptunium and plutonium. We explore the changes in geometric and electronic structures as a function of actinide, and in particular, employ the QTAIM to assess trends in actinide–dinitrogen binding. We also probe the effects of changing the ancillary ligand from OPh to F, Cl, Br, Me or H. As we found in ref. 58 that B3LYP provided a better match with experiment than did PBE, we report only B3LYP data here.
Table 1 shows selected structural and N–N vibrational data from the optimised geometries of [An(OPh)3]2(μ–η2:η2-N2) (An = Th–Pu), calculated in their high spin ground states (S = 0, 2, 4, 6 and 8 for An = Th, Pa, U, Np and Pu respectively), with the trends in the N–N stretching wavenumber and N–N and An–N bond lengths across the series plotted in Fig. 3. The average An–O distance decreases by 0.075 Å from [Th(OPh)3]2(μ–η2:η2-N2) to [Pu(OPh)3]2(μ–η2:η2-N2), in broad agreement with the reduction in An4+ ionic radius as a result of the actinide contraction (rTh4+ = 0.99 Å, rPu4+ = 0.93 Å).62 There is a pronounced maximum in the N–N bond length at protactinium, and a correspondingly low N–N stretching wavenumber. All complexes show significant N–N bond lengthening compared with free N2 (1.104 Å, B3LYP) along with a decrease in N–N stretching wavenumber (2454 cm−1, B3LYP). This suggests that, as we concluded for [U(OPh)3]2(μ–η2:η2-N2),58 there is donation of electron density to dinitrogen from all of the actinides considered, resulting in a lengthened and weakened N–N bond. The changes in N–N bond length are reflected in the bond angles, with the complex with the shortest N–N distance ([Pu(OPh)3]2(μ–η2:η2-N2)) having the largest An–N–An angle and the smallest N–An–N angle. There is also a clear correspondence between N–N and An–N bond lengths, with the longest N–N bond length found in the complex with the shortest An–N bond length (and An–An distance).
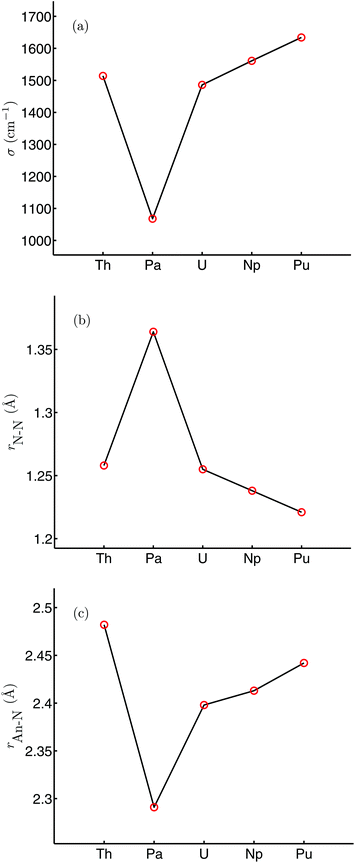 |
| | Fig. 3 N–N stretching wavenumber (a), r(N–N) (b) and r(An–N) (c) for [An(OPh)3]2(μ–η2:η2-N2) (An = Th–Pu). | |
Table 1 Selected bond length (Å), bond angle (degrees) and stretching vibration (cm−1) data for [An(OPh)3]2(μ–η2:η2-N2) (An = Th–Pu). Data for [U(OPh)3]2(μ–η2:η2-N2) are from ref. 58
| |
Th |
Pa |
U |
Np |
Pu |
|
R(N–N) |
1.258 |
1.364 |
1.255 |
1.238 |
1.221 |
|
r(An–An) |
4.803 |
4.374 |
4.628 |
4.665 |
4.728 |
|
r(An–N) av. |
2.482 |
2.291 |
2.398 |
2.413 |
2.442 |
|
r(An–O) av. |
2.177 |
2.128 |
2.119 |
2.104 |
2.102 |
| ∠N–An–N |
29.4 |
34.6 |
30.3 |
29.7 |
29.0 |
| ∠An–N–An |
150.6 |
145.4 |
149.7 |
150.3 |
151.1 |
|
σ(N–N) |
1514 |
1068 |
1486 |
1561 |
1634 |
The partial charges of the actinide and nitrogen atoms, calculated using the Hirshfeld and QTAIM approaches, are shown in Table 2. Although the absolute values are significantly different between the two approaches, the trends are the same; in both cases the protactinium complex has the most positive metal charge and the most negative nitrogen, consistent with the extent of metal→N2 charge transfer (and hence N2 reduction) being largest in this system. This is in agreement with the structural and vibrational data discussed above. In ref. 58, we noted that two of the four highest occupied α spin molecular orbitals of the 5Ag ground state of [U(OPh)3]2(μ–η2:η2-N2) had significant U→N2 backbonding character. In all the four additional systems studied here, MOs of similar character can be identified; a representative example is shown for [Pa(OPh)3]2(μ–η2:η2-N2) in Fig. 4(a) (α HOMO−8), and this system also features a second strongly backbonding orbital (α HOMO−1) shown in Fig. 4(b). A population analysis of the An→N2 backbonding MOs of all five target systems indicates that the protactinium orbitals are the most localised on the metal/N2 core and have the largest contribution from nitrogen, providing an explanation for this system displaying the largest backbonding effects (and having the most negative nitrogen charges).
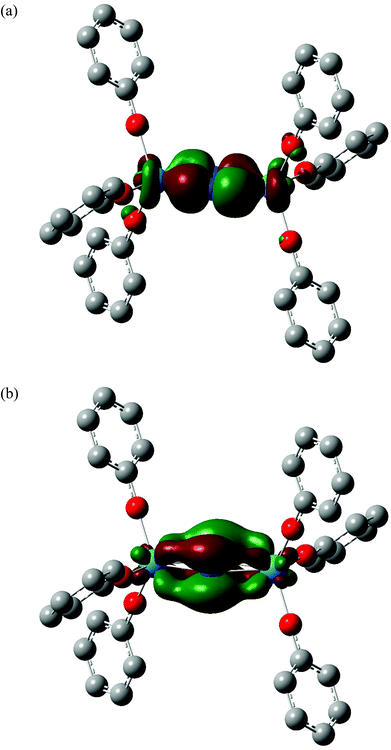 |
| | Fig. 4 Three dimensional representations of the α HOMO−8 (a) and α HOMO−1 (b) molecular orbitals of [Pa(OPh)3]2(μ–η2:η2-N2). Isovalue = 0.04. Hydrogen atoms are omitted for clarity. Orbital compositions (Mulliken analysis, %) are 18% Pa f, 12% Pa d, 50% N p and 22% Pa f, 8% Pa d, 68% N p respectively. | |
Table 2 Atomic partial charges in [An(OPh)3]2(μ–η2:η2-N2) (An = Th–Pu)
| |
|
Th |
Pa |
U |
Np |
Pu |
| Hirshfeld |
An |
0.67 |
0.94 |
0.88 |
0.81 |
0.75 |
| N |
−0.14 |
−0.33 |
−0.22 |
−0.19 |
−0.17 |
| QTAIM |
An |
2.68 |
2.72 |
2.49 |
2.38 |
2.26 |
| N |
−0.61 |
−0.79 |
−0.57 |
−0.52 |
−0.47 |
QTAIM data (BCP ρ, ∇2ρ and H, and N–N and An–N delocalisation indices) for the N–N and An–N bonds of all five target systems are shown in Tables 3 and 4. The N–N bonds have QTAIM BCP properties characteristic of very covalent bonds, i.e. significantly positive ρ and significantly negative ∇2ρ and H, although all values are reduced (in an absolute sense) from those for free N2 (0.661, −2.021 and −1.057 respectively at the B3LYP level).58 These reductions are consistent with the lengthening and weakening of the N2 bond as a result of actinide→N2 charge transfer, and are particularly significant for the protactinium system. The delocalisation index data also fit well into the overall picture. Recall that δ(N,N) may be interpreted as the QTAIM measure of N–N bond order; all five N–N bond orders are much reduced from 3, particularly so in [Pa(OPh)3]2(μ–η2:η2-N2). In integer terms, all N–N delocalisation indices are closest to 2, consistent with the (N2)2− formalism.
Table 3 QTAIM data (atomic units) for the N–N bond in [An(OPh)3]2(μ–η2:η2-N2) (An = Th–Pu). ρ, ∇2ρ and H data at the bond critical point. Correlation coefficients (R2) are from linear regression of the QTAIM metrics with N–N bond length and, in italics, stretching wavenumber
| |
Th |
Pa |
U |
Np |
Pu |
R
2
|
|
ρ
|
0.455 |
0.352 |
0.459 |
0.479 |
0.500 |
0.998, 0.991 |
| ∇2ρ |
−0.937 |
−0.543 |
−0.945 |
−1.033 |
−1.129 |
0.992, 0.986 |
|
H
|
−0.542 |
−0.364 |
−0.550 |
−0.589 |
−0.632 |
0.993, 0.984 |
|
δ(N,N) |
2.166 |
1.661 |
2.085 |
2.149 |
2.223 |
0.966, 0.986 |
Table 4 Averaged QTAIM data (atomic units) for the An–N bonds in [An(OPh)3]2(μ–η2:η2-N2) (An = Th–Pu). ρ, ∇2ρ and H data at the bond critical point. Correlation coefficients (R2) are from linear regression of the QTAIM metrics with An–N bond length
| |
Th |
Pa |
U |
Np |
Pu |
R
2
|
|
ρ
|
0.062 |
0.095 |
0.072 |
0.068 |
0.061 |
0.933 |
| ∇2ρ |
0.173 |
0.251 |
0.217 |
0.219 |
0.209 |
0.899 |
|
H
|
−0.008 |
−0.025 |
−0.011 |
−0.009 |
−0.006 |
0.876 |
|
δ(An,N) |
0.426 |
0.684 |
0.518 |
0.493 |
0.454 |
0.982 |
All of the QTAIM metrics for the An–N bonds are significantly smaller (absolutely) in comparison with the N–N values, though the trends are in keeping with the structural and charge data. The Pa–N bonds have the largest BCP ρ, ∇2ρ and H, and the biggest delocalisation index, in agreement with these bonds being the shortest of the five, and with the protactinium system having the largest metal→N2 charge transfer. The magnitude of the BCP data places the An–N bonds in the QTAIM closed shell category,56 suggesting that, actinide→N2 backdonation notwithstanding, these bonds are substantially ionic (or, at the very least, strongly polar).
Table 3 indicates that the correlation of all four QTAIM metrics with the calculated N–N bond length and stretching wavenumbers is excellent, with R2 values being larger than 0.966 in all cases. The correlation of An–N QTAIM data with bond length is slightly less good (Table 4) though it remains excellent for the delocalisation indices.
In order to explore the generality of these correlations, we have optimised the geometries of a further 25 related molecules, i.e. [AnX3]2(μ–η2:η2-N2) (An = Th–Pu; X = F, Cl, Br, Me, H), key structural and vibrational data for which are shown in the ESI (Table S1).† In general, the trends in these as a function of actinide are similar to those noted for the OPh variants, with the protactinium systems showing the longest N–N bonds and the smallest An–N distances and N–N stretching wavenumbers. R2 values for the correlation of these data with ρ, ∇2ρ and H, and the delocalisation indices, are presented in Table 5 for all 30 molecules. As for the five OPh systems, the correlations are very strong, particularly for the N–N data. We can therefore conclude that, for this family of molecules at least, there is very good correlation of our QTAIM metrics with (in principle) experimentally observable bond length and vibrational parameters.
Table 5
R
2 values (linear regression) for the correlation of the N–N and An–N bond lengths, and the N–N stretching wavenumbers with ρ, ∇2ρ and H, and the delocalisation indices, for [AnX3]2(μ–η2:η2-N2) (An = Th–Pu; X = F, Cl, Br, Me, H, OPh)
| |
ρ
|
∇2ρ |
H
|
δ(N,N) or δ(An,N) |
|
r(N–N) |
0.997 |
0.989 |
0.989 |
0.937 |
|
σ(N–N) |
0.980 |
0.981 |
0.977 |
0.982 |
|
r(An–N) av. |
0.948 |
0.833 |
0.898 |
0.972 |
As discussed in the Introduction, we have recently begun to explore the possibility that the QTAIM can be used as an indicator of actinide–ligand interaction energies.42 We have therefore calculated the An–N interaction energy in the present 30 systems as
| |  | (1) |
where
E[AnX3]2N2 is the SCF energy of the complex, and
EAnX3 and
EN2 are the energies of the AnX
3 and N
2 fragments at their geometries in the optimised complexes. These are shown in
Table 6. The trend across the actinide series is essentially the same for all ancillary ligands bar X = H,
§ with an increase in interaction energy from thorium to protactinium, followed by a reduction to plutonium. The An–N interaction energies in the latter systems are very small, and actually very slightly positive for X = Cl and Br, suggesting that plutonium dinitrogen chemistry may be inaccessible, even in principle, in systems of this type. That the protactinium compounds have the largest An–N interaction energies is in keeping with all the structural, vibrational, Hirshfeld charge, molecular orbital and QTAIM data.
Table 6 An–N interaction energies (kJ mol−1) for [AnX3]2(μ–η2:η2-N2) (An = Th–Pu; X = F, Cl, Br, Me, H, OPh) calculated using eqn (1)
| X |
Th |
Pa |
U |
Np |
Pu |
| F |
−110.9 |
−139.0 |
−61.8 |
−39.6 |
−5.4 |
| Cl |
−117.2 |
−134.9 |
−37.7 |
−21.5 |
9.0 |
| Br |
−118.6 |
−135.2 |
−36.6 |
−19.0 |
9.8 |
| OPh |
−110.7 |
−147.7 |
−77.0 |
−208.4 |
−21.9 |
| H |
−120.7 |
−155.7 |
−75.7 |
−12.9 |
−16.7 |
| Me |
−114.0 |
−150.4 |
−77.5 |
−71.9 |
−33.0 |
Given the excellent correlations between our QTAIM parameters and the present bond length and stretching vibration data, and the rather promising correlations discussed in ref. 42, we were disappointed to discover that there is very little correlation between our QTAIM metrics and the An–N interaction energies; R2 values (linear regression) for, respectively, ρ, ∇2ρ, H and δ(An,N) with the data in Table 6 (bar [Np(OPh)3]2(μ–η2:η2-N2)) are 0.297, 0.001, 0.369 and 0.204. As discussed in ref. 42, we have previously observed very strong positive correlation of BCP ρ with metal–ligand interaction energies, but noted that this was the case only for systems in which the interaction energy was dominated by the orbital mixing term of the Ziegler–Rauk EDA. Such situations are rare, and hence it is likely that the present lack of correlation between interaction energies and QTAIM BCP and delocalisation index metrics is more the rule than the exception. However, on the grounds that the bonding in actinide complexes is predominantly ionic, we wondered if there might be correlations between interaction energies and atomic partial charges. Table 7 reveals that there are indeed very strong correlations between the QTAIM partial charge on the actinide atom QQTAIMAn and the An–N interaction energies. For a given ligand the lowest value of R2 is 0.872 (for X = Me) although the correlation over all 29 systems is rather poorer, at just 0.565. Nevertheless, we decided that the QQTAIMAn charge correlations are sufficiently strong to warrant further investigation. Given that the actinide–dinitrogen interaction involves transfer of charge from metal to ligand, formally reducing N2 to N22−, we have correlated the An–N interaction energies with the difference between the QTAIM partial charge on the actinide in the AnX3 fragment and in the final complex. In all cases the latter is the more positive (see Table S2 of the ESI†), in keeping with the donation of electron density to the N2 unit. Table 7 indicates that the correlations of this |ΔQQTAIMAn| charge metric¶ are comparable with those of QQTAIMAn for the individual ligand families, and appreciably better for the dataset as a whole (R2 = 0.882, as shown in Fig. 5).
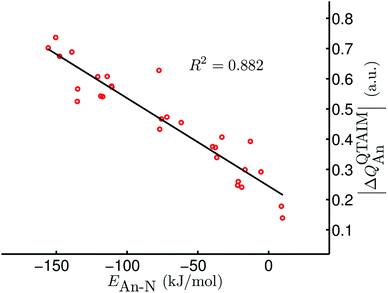 |
| | Fig. 5 |ΔQQTAIMAn| vs. EAn–N for [AnX3]2(μ–η2:η2-N2) (An = Th–Pu; X = F, Cl, Br, Me, H). Data for [Np(OPh)3]2(μ–η2:η2-N2) are not included. | |
Table 7
R
2 values (linear regression) for the correlation of the An–N interaction energies (Table 6) with the QTAIM partial actinide charge (QQTAIMAn), and the difference between the QTAIM partial charge on the actinide atom in the full complex and in the AnX3 fragment (|ΔQQTAIMAn|) for [AnX3]2(μ–η2:η2-N2) (An = Th–Pu; X = F, Cl, Br, Me, H, OPh). Data for [Np(OPh)3]2(μ–η2:η2-N2) are not included
| |
X = F |
X = Cl |
X = Br |
X = H |
X = Me |
X = OPh |
All X |
|
Q
QTAIMAn
|
0.992 |
0.951 |
0.954 |
0.951 |
0.872 |
0.952 |
0.565 |
| |ΔQQTAIMAn| |
0.994 |
0.969 |
0.960 |
0.942 |
0.832 |
0.996 |
0.882 |
AnO and AnO2 (An = Th–Cm)
The results presented in the previous section suggest that the correlation between QTAIM metrics (in particular those based on atomic partial charges) and energetic data warrants further investigation. Before doing so, however, we took the opportunity to benchmark our methodology against experimental and previous theoretical studies of An, AnO and AnO2. The B3LYP/pseudopotential approach used for the [AnX3]2(μ–η2:η2-N2) system was chosen as our original study of [U(OPh3)]2(μ–η2:η2-N2) had been performed using it, but we felt it important to assess its more general applicability to the strength of actinide–element interactions. An, AnO and AnO2 were chosen as there are extensive experimental63 and theoretical64,65 data available for these systems, a rarity in the 5f series.
We began by optimising the geometries of AnOn+ and AnO2n+ (An = Th–Cm; n = 0, 1, 2) using three different exchange–correlation functionals – B3LYP (hybrid), TPSS (meta-GGA) and TPSSh (meta-hybrid). The results are presented in Table S3 of the ESI,† and compared with previous calculations at the CASPT2 level.63 The geometries from the TPSSh functional best match the ab initio data (the sum of the mean absolute deviations from the CASPT2 results is, respectively, 0.1, 0.097 and 0.092 for B3LYP, TPSS and TPSSh), and subsequent calculations use these geometries. We then calculated the first and second ionisation energies of An, AnO and AnO2 (An = Th–Cm) as well as the bond energies (both from the molecule/fragment electronic energy difference De and the bond dissociation energies D0 (i.e. including zero point energy (ZPE) corrections), using eqn (2) and (3) given below) of AnOn+ and AnO2n+ (An = Th–Cm; n = 0, 1, 2) using each of our chosen functionals in conjunction with either the Stuttgart pseudopotentials and associated valence basis sets, or all-electron SARCP basis sets with the DKH Hamiltonian, the latter both with and without spin–orbit coupling. All of these data are presented in Tables S4–S14 of the ESI,† and the mean absolute deviations of the data from the experimental values are shown in Tables 8 and 9.
| | | DAnOn+ = EAnn+ + EO − EAnOn+ | (2) |
| |  | (3) |
Table 8 Mean absolute deviation from experiment63 (kJ mol−1) of the calculated first and second ionisation energies of An, AnO and AnO2 (An = Th–Cm)
| Method |
An IE1 |
An IE2 |
AnO IE1 |
AnO IE2 |
AnO2 IE1 |
AnO2 IE2 |
| B3LYP |
19.1 |
16.2 |
23.0 |
30.8 |
37.0 |
88.2 |
| B3LYP + ZPE + BSSE |
— |
— |
43.9 |
36.6 |
36.5 |
80.0 |
| B3LYP + DKH |
23.1 |
33.5 |
24.1 |
31.5 |
37.5 |
82.6 |
| B3LYP + DKH + ZPE + BSSE |
— |
— |
40.3 |
37.2 |
35.9 |
77.6 |
| B3LYP + DKHSO |
32.0 |
37.5 |
28.9 |
23.1 |
36.5 |
85.5 |
| B3LYP + DKHSO + ZPE + BSSE |
— |
— |
52.1 |
22.8 |
35.0 |
79.0 |
| TPSS |
38.2 |
21.4 |
11.7 |
19.0 |
43.5 |
76.5 |
| TPSS + ZPE + BSSE |
— |
— |
11.7 |
33.2 |
40.9 |
89.7 |
| TPSS + DKH |
85.3 |
86.7 |
12.1 |
21.7 |
156.8 |
84.8 |
| TPSS + DKH + ZPE + BSSE |
— |
— |
13.4 |
31.4 |
155.6 |
101.1 |
| TPSS + DKHSO |
73.4 |
75.7 |
11.7 |
20.1 |
147.7 |
87.8 |
| TPSS + DKHSO + ZPE + BSSE |
— |
— |
14.4 |
29.5 |
146.5 |
104.2 |
| TPSSh |
36.1 |
24.7 |
13.1 |
20.8 |
40.8 |
76.7 |
| TPSSh + ZPE + BSSE |
— |
— |
14.9 |
28.1 |
123.3 |
116.0 |
| TPSSh + DKH |
39.0 |
28.5 |
13.9 |
21.8 |
44.6 |
83.5 |
| TPSSh + DKH + ZPE + BSSE |
— |
— |
15.7 |
24.9 |
39.8 |
88.5 |
| TPSSh + DKHSO |
39.1 |
29.1 |
18.2 |
24.3 |
42.6 |
86.3 |
| TPSSh + DKHSO + ZPE + BSSE |
— |
— |
20.0 |
28.1 |
37.9 |
90.6 |
Table 9 Mean absolute deviation from experiment63 (kJ mol−1) of the calculated bond energies (De or D0) of AnOn+ and AnO2n+ (An = Th–Cm; n = 0, 1, 2), calculated using eqn (2) and (3). Note that the experimental data are quoted as bond dissociation enthalpies at 298.15 K, but we do not include the 3/2RT (ca. 3.7 kJ mol−1) correction factor in our data
| Method |
D(AnO) |
D(AnO+) |
D(AnO2+) |
D(AnO2) |
D(AnO2+) |
D(AnO22+) |
| B3LYP |
45.6 |
65.1 |
97.6 |
25.1 |
31.0 |
59.4 |
| B3LYP + ZPE + BSSE |
62.7 |
66.5 |
90.3 |
36.4 |
24.5 |
65.1 |
| B3LYP + DKH |
38.9 |
72.5 |
85.4 |
23.0 |
44.3 |
51.9 |
| B3LYP + DKH + ZPE + BSSE |
62.3 |
72.7 |
75.2 |
41.5 |
33.9 |
57.2 |
| B3LYP + DKHSO |
55.6 |
73.2 |
96.0 |
21.5 |
40.6 |
57.1 |
| B3LYP + DKHSO + ZPE + BSSE |
79.0 |
73.7 |
85.7 |
40.7 |
36.0 |
57.2 |
| TPSS |
39.2 |
48.6 |
66.9 |
51.4 |
89.2 |
61.1 |
| TPSS + ZPE + BSSE |
31.4 |
42.2 |
78.4 |
43.4 |
82.0 |
40.4 |
| TPSS + DKH |
44.9 |
112.1 |
67.0 |
309.2 |
369.8 |
418.7 |
| TPSS + DKH + ZPE + BSSE |
34.5 |
102.6 |
67.4 |
313.3 |
377.0 |
444.8 |
| TPSS + DKHSO |
44.9 |
102.8 |
69.7 |
287.4 |
343.9 |
394.8 |
| TPSS + DKHSO + ZPE + BSSE |
37.4 |
93.2 |
72.0 |
291.4 |
351.1 |
421.0 |
| TPSSh |
30.7 |
50.3 |
88.7 |
28.7 |
57.6 |
45.3 |
| TPSSh + ZPE + BSSE |
29.3 |
47.5 |
106.6 |
25.5 |
128.0 |
49.7 |
| TPSSh + DKH |
30.9 |
46.6 |
74.0 |
35.0 |
69.4 |
59.1 |
| TPSSh + DKH + ZPE + BSSE |
28.9 |
43.8 |
90.8 |
28.9 |
56.3 |
74.8 |
| TPSSh + DKHSO |
33.2 |
49.8 |
81.7 |
34.6 |
71.8 |
58.6 |
| TPSSh + DKHSO + ZPE + BSSE |
32.3 |
52.6 |
99.6 |
29.8 |
60.1 |
74.4 |
As Tables 8 and 9 show, the calculations with the TPSSh exchange correlation functional, Stuttgart pseudopotentials and associated basis sets usually have the smallest mean absolute deviations (MADs); calculations with B3LYP and TPSS normally give good results, too. The inclusion of ZPE and basis set superposition error (BSSE) corrections does not improve the results and, as the magnitude of these corrections is typically very small, we chose not to include them in subsequent calculations. Calculations with the SARCP basis sets and DKH/DKHSO Hamiltonians usually lead to larger MADs since they produce some outlier data; e.g. the first ionization energy of thorium calculated with the TPSS functional and SARC-DKH method is 1039 kJ mol−1, which is almost twice the value calculated with other methods.
In summary, we find that the three exchange correlation functionals give good results in both geometry optimization and in the evaluation of ionization energies and bond energies, comparable to results from the CASPT2 method,64 which is much more time-consuming. The TPSSh functional usually gives slightly better results than the other two functionals tested; in addition, the pseudopotential approach generally gives smaller MADs than the all-electron DKH/DKHSO method. We therefore use the TPSSh exchange correlation functional with the Stuttgart small core pseudopotentials and associated basis sets for all of the calculations reported in the rest of this paper, and do not include ZPE or BSSE corrections.
Tables 10 and 11 show QTAIM data for AnOn+ and AnO2n+ (An = Th–Cm; n = 0, 1, 2). All of the BCP ρ values are larger than 0.2 e per Bohr3, and the H data are all significantly negative. Both of these metrics clearly indicate shared shell interactions, and the delocalisation indices all show multiple bonding. ∇2ρ are all positive, which is not uncommon in strongly polar bonding.56Tables 10 and 11 also give the values of R2 for linear correlation of the QTAIM metrics with De, calculated using eqn (4).|| As for the An–N interaction energies discussed in section (ii), there is poor correlation of the energy data with ρ, H and δ(An,O), though in the present case there are improved (albeit still moderate) correlations with ∇2ρ. R2 is low for the correlation of |ΔQQTAIMAn| with De for AnO and AnO2, but is much higher (≥0.901) for that with De of the cationic systems. Overall, then, the conclusions from the QTAIM analysis of the actinide oxides are similar to those for the dinitrogen systems: poor/moderate correlation of BCP metrics and delocalisation indices with De but, for the cationic species at least, excellent correlation with |ΔQQTAIMAn|.
| |  | (4) |
Table 10 QTAIM data (atomic units) for the An–O bond in AnOn+ (An = Th–Cm; n = 0, 1, 2). ρ, ∇2ρ and H data at the bond critical point. Correlation coefficients (R2) are from linear regression of the QTAIM metrics with De (calculated using eqn (2))
| |
ThO |
PaO |
UO |
NpO |
PuO |
AmO |
CmO |
R
2
|
|
ρ
|
0.262 |
0.284 |
0.259 |
0.259 |
0.257 |
0.242 |
0.241 |
0.454 |
| ∇2ρ |
0.323 |
0.298 |
0.411 |
0.488 |
0.504 |
0.548 |
0.673 |
0.506 |
|
H
|
−0.228 |
−0.256 |
−0.206 |
−0.199 |
−0.191 |
−0.163 |
−0.158 |
0.615 |
|
δ(An,O) |
2.044 |
2.157 |
2.005 |
2.042 |
2.061 |
2.011 |
2.029 |
0.152 |
| |ΔQQTAIMAn| |
1.122 |
1.052 |
1.106 |
1.106 |
1.049 |
1.066 |
1.061 |
0.283 |
| |
ThO+ |
PaO+ |
UO+ |
NpO+ |
PuO+ |
AmO+ |
CmO+ |
R
2
|
|
ρ
|
0.283 |
0.287 |
0.284 |
0.286 |
0.285 |
0.283 |
0.269 |
0.086 |
| ∇2ρ |
0.323 |
0.321 |
0.424 |
0.498 |
0.512 |
0.499 |
0.710 |
0.477 |
|
H
|
−0.263 |
−0.264 |
−0.245 |
−0.240 |
−0.234 |
−0.220 |
−0.195 |
0.606 |
|
δ(An,O) |
2.041 |
2.031 |
2.023 |
2.074 |
2.097 |
2.079 |
2.081 |
0.687 |
| |ΔQQTAIMAn| |
1.019 |
0.988 |
0.988 |
0.948 |
0.905 |
0.877 |
0.913 |
0.986 |
| |
ThO2+ |
PaO2+ |
UO2+ |
NpO2+ |
PuO2+ |
AmO2+ |
CmO2+ |
R
2
|
|
ρ
|
0.314 |
0.336 |
0.346 |
0.346 |
0.335 |
0.282 |
0.232 |
0.256 |
| ∇2ρ |
0.314 |
0.272 |
0.282 |
0.349 |
0.443 |
0.583 |
0.707 |
0.664 |
|
H
|
−0.315 |
−0.346 |
−0.352 |
−0.339 |
−0.309 |
−0.212 |
−0.145 |
0.462 |
|
δ(An,O) |
2.116 |
2.228 |
2.315 |
2.372 |
2.417 |
2.248 |
1.827 |
0.001 |
| |ΔQQTAIMAn| |
0.885 |
0.794 |
0.700 |
0.622 |
0.537 |
0.436 |
0.427 |
0.964 |
Table 11 QTAIM data (atomic units) for the An–O bond in AnO2n+ (An = Th–Cm; n = 0, 1, 2). ρ, ∇2ρ and H data at the bond critical point. Correlation coefficients (R2) are from linear regression of the QTAIM metrics with De (calculated using eqn (4))
| |
ThO2 |
PaO2 |
UO2 |
NpO2 |
PuO2 |
AmO2 |
CmO2 |
R
2
|
|
ρ
|
0.224 |
0.288 |
0.290 |
0.273 |
0.270 |
0.254 |
0.245 |
0.071 |
| ∇2ρ |
0.328 |
0.237 |
0.254 |
0.255 |
0.308 |
0.433 |
0.449 |
0.658 |
|
H
|
−0.173 |
−0.261 |
−0.257 |
−0.226 |
−0.212 |
−0.179 |
−0.164 |
0.369 |
|
δ(An,O) |
1.738 |
2.053 |
2.067 |
1.942 |
1.921 |
1.864 |
1.745 |
0.170 |
| |ΔQQTAIMAn| |
2.364 |
2.130 |
2.035 |
2.097 |
2.009 |
1.986 |
1.993 |
0.480 |
| |
ThO2+ |
PaO2+ |
UO2+ |
NpO2+ |
PuO2+ |
AmO2+ |
CmO2+ |
R
2
|
|
ρ
|
0.228 |
0.314 |
0.325 |
0.338 |
0.347 |
0.339 |
0.307 |
0.042 |
| ∇2ρ |
0.370 |
0.224 |
0.241 |
0.249 |
0.278 |
0.383 |
0.477 |
0.662 |
|
H
|
−0.178 |
−0.308 |
−0.315 |
−0.330 |
−0.335 |
−0.304 |
−0.247 |
0.011 |
|
δ(An,O) |
1.704 |
2.031 |
2.084 |
2.143 |
2.182 |
2.175 |
2.026 |
0.075 |
| |ΔQQTAIMAn| |
1.785 |
1.885 |
1.726 |
1.604 |
1.487 |
1.363 |
1.300 |
0.931 |
| |
ThO22+ |
PaO22+ |
UO22+ |
NpO22+ |
PuO22+ |
AmO22+ |
CmO22+ |
R
2
|
|
ρ
|
0.195 |
0.288 |
0.377 |
0.380 |
0.387 |
0.385 |
0.359 |
0.149 |
| ∇2ρ |
0.516 |
0.473 |
0.314 |
0.346 |
0.379 |
0.447 |
0.512 |
0.120 |
|
H
|
−0.129 |
−0.265 |
−0.406 |
−0.402 |
−0.404 |
−0.385 |
−0.331 |
0.063 |
|
δ(An,O) |
1.598 |
2.046 |
2.305 |
2.336 |
2.363 |
2.360 |
2.266 |
0.139 |
| |ΔQQTAIMAn| |
1.030 |
1.203 |
1.219 |
1.048 |
0.920 |
0.804 |
0.621 |
0.901 |
AnL3+ and AnL33+ (An = Th–Cm; L = Py, Pz, Tz)
As discussed in the Introduction, the favoured extractant ligands for the SANEX process are neutral nitrogen-donors, which are designed to selectively complex the trivalent MAs. These ligands are large and feature several nitrogen-containing heterocycles, and hence are computationally expensive to model, so in this section we focus on the interactions of An3+ with much smaller nitrogen-based heterocycles: pyridine (Py), pyrazine (Pz) and triazine (Tz), shown schematically in Fig. 1.
Geometry optimisations of AnL3+ in the gas phase proved problematic. A number of complexes did not converge or failed the wavefunction stability checks, and several systems converged to very long An–L distances (almost 3 Å in some cases, particularly for the MAs). We therefore decided to reoptimise these targets in aqueous solution, as approximated by the PCM approach. This led to more sensible geometries, with fewer and less pronounced variations in An–N bond length, which we present in Table 12 together with the (gas-phase) interaction energies (calculated as the SCF energy difference between AnL3+ and An3+ and L in their AnL3+ geometries) and QTAIM metrics at the PCM structures. (It is well established that continuum solvation models suffer from significantly larger solvation energy errors for charged species vs. neutral systems,66–68 and we have therefore chosen to report the interaction energies using gas-phase electronic structures at geometries obtained with PCM.) With three exceptions (∇2ρ for AnPy3+ and AnPz3+, and δ(An,N) for AnPy3+) the correlation of the critical point metrics and delocalisation indices with the interaction energies is poor, continuing the trends observed in the [AnX3]2(μ–η2:η2-N2) and oxide data. Also as before, we find strong correlation of EAn3+–L with |ΔQQTAIMAn| (≥0.856) for all three sets of data.
Table 12 An–N bond lengths (Å, PCM), An3+–L interaction energies (EAn3+–L, kJ mol−1, gas phase//PCM) and QTAIM data (atomic units, gas phase//PCM) for AnL3+ (An = Th–Cm; L = Py, Pz, Tz). ρ, ∇2ρ and H data at the bond critical point. Correlation coefficients (R2) are from linear regression of the QTAIM metrics with An3+–L interaction energies
| |
ThPy3+ |
PaPy3+ |
UPy3+ |
NpPy3+ |
PuPy3+ |
AmPy3+ |
CmPy3+ |
R
2
|
|
r
An–N
|
2.450 |
2.562 |
2.584 |
2.575 |
2.519 |
2.501 |
2.535 |
|
|
E
An3+–L
|
−698.8 |
−696.0 |
−711.5 |
−766.1 |
−865.7 |
−963.8 |
−810.2 |
|
|
ρ
|
0.082 |
0.068 |
0.061 |
0.057 |
0.060 |
0.060 |
0.059 |
0.270 |
| ∇2ρ |
0.102 |
0.075 |
0.094 |
0.116 |
0.141 |
0.160 |
0.125 |
0.913 |
|
H
|
−0.025 |
−0.017 |
−0.013 |
−0.010 |
−0.011 |
−0.011 |
−0.011 |
0.352 |
|
δ(An,N) |
0.689 |
0.661 |
0.596 |
0.536 |
0.507 |
0.448 |
0.522 |
0.833 |
| |ΔQQTAIMAn| |
0.419 |
0.451 |
0.562 |
0.696 |
0.847 |
0.979 |
0.751 |
0.934 |
| |
ThPz3+ |
PaPz3+ |
UPz3+ |
NpPz3+ |
PuPz3+ |
AmPz3+ |
CmPz3+ |
R
2
|
|
r
An–N
|
2.451 |
2.546 |
2.744 |
2.579 |
2.551 |
2.541 |
2.576 |
|
|
E
An3+–L
|
−593.6 |
−618.3 |
−629.4 |
−709.8 |
−818.9 |
−935.9 |
−737.8 |
|
|
ρ
|
0.082 |
0.068 |
0.044 |
0.056 |
0.055 |
0.055 |
0.053 |
0.173 |
| ∇2ρ |
0.099 |
0.085 |
0.074 |
0.121 |
0.138 |
0.144 |
0.121 |
0.787 |
|
H
|
−0.025 |
−0.016 |
−0.006 |
−0.010 |
−0.008 |
−0.009 |
−0.009 |
0.282 |
|
δ(An,N) |
0.639 |
0.542 |
0.407 |
0.461 |
0.426 |
0.387 |
0.430 |
0.478 |
| |ΔQQTAIMAn| |
0.397 |
0.533 |
0.688 |
0.743 |
0.892 |
0.999 |
0.804 |
0.856 |
| |
ThTz3+ |
PaTz3+ |
UTz3+ |
NpTz3+ |
PuTz3+ |
AmTz3+ |
CmTz3+ |
R
2
|
|
r
An–N
|
2.574 |
2.470 |
2.351 |
2.725 |
2.569 |
2.558 |
2.746 |
|
|
E
An3+–L
|
−548.0 |
−552.5 |
−631.5 |
−629.5 |
−743.5 |
−853.2 |
−674.4 |
|
|
ρ
|
0.061 |
0.077 |
0.089 |
0.040 |
0.051 |
0.051 |
0.037 |
0.159 |
| ∇2ρ |
0.100 |
0.107 |
0.183 |
0.096 |
0.140 |
0.153 |
0.091 |
0.200 |
|
H
|
−0.013 |
−0.022 |
−0.027 |
−0.004 |
−0.006 |
−0.007 |
−0.003 |
0.235 |
|
δ(An,N) |
0.539 |
0.637 |
0.674 |
0.399 |
0.430 |
0.384 |
0.360 |
0.379 |
| |ΔQQTAIMAn| |
0.386 |
0.514 |
0.566 |
0.751 |
0.870 |
1.000 |
0.812 |
0.858 |
Table 12 shows that, for all three ligands, |ΔQQTAIMAn| becomes larger from thorium to americium and falls back slightly at curium. In all cases this corresponds to an increasing charge transfer from L to An3+. At the molecular orbital level, this can be traced to a significant change in the character of the lowest unoccupied orbital, which has an increasing contribution from the heterocycle as the actinide series is crossed, as illustrated for ThPy3+, UPy3+ and AmPy3+ in Fig. 6. We have observed similar intramolecular charge transfers on several previous occasions, and have traced them to the increasing energetic proximity of metal and ligand valence orbitals toward the centre of the actinide series.22,23,26,28 Here we show, for the first time, that such charge transfers are accompanied by increasing actinide–ligand interaction energies.
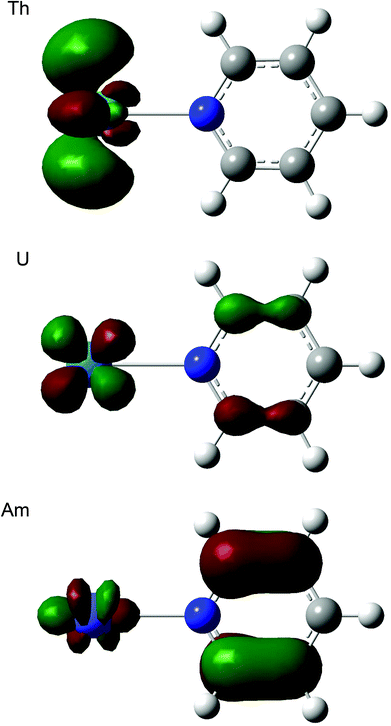 |
| | Fig. 6 Three dimensional representations of the lowest unoccupied molecular orbitals of AnPy3+ (An = Th, U, Am). Isovalue = 0.05. | |
Table 13 presents data analogous to those presented in Table 12, but for systems with three heterocyclic ligands. The actinide–ligand gas-phase interaction energies have been calculated according to eqn (5), i.e. the SCF energy difference between AnL33+ and An3+ and L3 in their AnL33+ (PCM) geometries. As for the single ligand systems, we have correlated our chosen QTAIM metrics with EAn3+–L3. The results are rather similar to those for AnL3+: poor correlation for all the QTAIM metrics bar ∇2ρ and |ΔQQTAIMAn|, although the correlation of the latter for AnPy33+ (0.579) is a little worse than we have typically found.
| |  | (5) |
Table 13 An–N bond lengths (Å, PCM), An3+–L3 interaction energies (EAn3+–L3, kJ mol−1, gas phase//PCM, calculated according to eqn (5)) and QTAIM data (atomic units, gas phase//PCM) for AnL33+ (An = Th–Cm; L = Py, Pz, Tz). ρ, ∇2ρ and H data at the bond critical point. Correlation coefficients (R2) are from linear regression of the QTAIM metrics with An3+–L3 interaction energies. No geometric minimum could be located for AmTz33+
| |
ThPy33+ |
PaPy33+ |
UPy33+ |
NpPy33+ |
PuPy33+ |
AmPy33+ |
CmPy33+ |
R
2
|
|
r
An–N
|
2.605 |
2.651 |
2.654 |
2.608 |
2.590 |
2.581 |
2.587 |
|
|
E
An3+–L3
|
−517.0 |
−513.5 |
−519.4 |
−535.1 |
−550.9 |
−562.7 |
−552.5 |
|
|
ρ
|
0.061 |
0.052 |
0.051 |
0.054 |
0.055 |
0.052 |
0.054 |
0.037 |
| ∇2ρ |
0.084 |
0.104 |
0.097 |
0.111 |
0.113 |
0.130 |
0.111 |
0.711 |
|
H
|
−0.013 |
−0.008 |
−0.008 |
−0.009 |
−0.010 |
−0.008 |
−0.010 |
0.022 |
|
δ(An,N) |
0.513 |
0.449 |
0.454 |
0.471 |
0.481 |
0.413 |
0.463 |
0.183 |
| |ΔQQTAIMAn| |
0.788 |
0.668 |
0.697 |
0.729 |
0.804 |
0.994 |
0.768 |
0.579 |
| |
ThPz33+ |
PaPz33+ |
UPz33+ |
NpPz33+ |
PuPz33+ |
AmPz33+ |
CmPz33+ |
R
2
|
|
r
An–N
|
2.619 |
2.679 |
2.724 |
2.638 |
2.621 |
2.617 |
2.625 |
|
|
E
An3+–L3
|
−440.9 |
−438.6 |
−441.3 |
−464.9 |
−490.3 |
−518.9 |
−481.5 |
|
|
ρ
|
0.059 |
0.049 |
0.045 |
0.050 |
0.050 |
0.048 |
0.050 |
0.054 |
| ∇2ρ |
0.081 |
0.090 |
0.082 |
0.107 |
0.120 |
0.125 |
0.105 |
0.892 |
|
H
|
−0.012 |
−0.007 |
−0.006 |
−0.008 |
−0.007 |
−0.006 |
−0.008 |
0.157 |
|
δ(An,N) |
0.486 |
0.431 |
0.416 |
0.433 |
0.399 |
0.364 |
0.417 |
0.634 |
| |ΔQQTAIMAn| |
0.769 |
0.664 |
0.714 |
0.796 |
0.974 |
1.148 |
0.843 |
0.922 |
| |
ThTz33+ |
PaTz33+ |
UTz33+ |
NpTz33+ |
PuTz33+ |
AmTz33+ |
CmTz33+ |
R
2
|
|
r
An–N
|
2.691 |
2.753 |
2.783 |
2.704 |
2.648 |
N/A |
2.672 |
|
|
E
An3+–L3
|
−390.3 |
−388.8 |
−389.7 |
−411.3 |
−434.2 |
N/A |
−431.5 |
|
|
ρ
|
0.051 |
0.043 |
0.040 |
0.044 |
0.048 |
N/A |
0.044 |
0.033 |
| ∇2ρ |
0.077 |
0.083 |
0.072 |
0.094 |
0.100 |
N/A |
0.100 |
0.875 |
|
H
|
−0.009 |
−0.005 |
−0.005 |
−0.006 |
−0.007 |
N/A |
−0.006 |
0.005 |
|
δ(An,N) |
0.449 |
0.410 |
0.405 |
0.410 |
0.432 |
N/A |
0.394 |
0.032 |
| |ΔQQTAIMAn| |
0.704 |
0.643 |
0.678 |
0.774 |
0.852 |
N/A |
0.847 |
0.958 |
Conclusions
In this contribution we have extended our previous study of [U(OPh)3]2(μ–η2:η2-N2)58 to 29 related dinitrogen complexes of An(IV): [AnX3]2(μ–η2:η2-N2) (An = Th–Pu; X = F, Cl, Br, Me, H, OPh). Geometric and vibrational data suggest that metal→N2 charge transfer maximises at the protactinium systems, which feature much the longest N–N bonds and the smallest σ(N–N), as a result of partial population of the N–N π* orbitals. There is very strong correlation of standard QTAIM metrics – bond critical point ρ, ∇2ρ and H, and delocalisation indices – with An–N and N–N bond lengths, and σ(N–N), though the correlation with An–N interaction energies is very poor. A similar situation exists for the other target systems (neutral and cationic actinide monoxide and dioxides, and the actinide–nitrogen bond in complexes with heterocyclic ligands of relevance to minor actinide separations technologies) with the exception of some of the ∇2ρ data, for which moderate to good correlations with energy data are sometimes seen. We have previously also found good correlation of ∇2ρ with metal–metal bond strengths in actinide and transition metal dimers,42 but further analysis indicates that caution is warranted; in our previous study and in the present actinide oxide data, there is an anticorrelation of ∇2ρ with bond energy whereas the present actinide–heterocyclic results show a positive correlation. Thus the Laplacian is by no means always well correlated with energy data (e.g. in all of our N2 systems, AnO22+ and AnTz3+) and, where there are reasonable correlations, they can be of opposite sign.
By contrast, we find in almost all cases that there is very strong correlation of interaction and bond energies with |ΔQQTAIMAn|, a simple metric which measures the amount of charge transferred to or from the actinide fragment on compound formation. Importantly, these correlations are always positive in the sense that as more charge is transferred from (e.g. [AnX3]2(μ–η2:η2-N2)) or to (e.g. in the oxides and AnL3+ and AnL33+) the actinide, the greater is the interaction/bond energy. Work is currently in progress to establish whether this simple metric can successfully predict trends in metal–ligand interaction energies in BTP complexes of An3+.
Acknowledgements
We thank University College London for a Overseas Research Scholarship (to QRH) and for computing resources via the Research Computing “Legion” cluster (Legion@UCL) and associated services. We also thank the EPSRC for computing resources via its National Service for Computational Chemistry Software (http://www.nsccs.ac.uk).
References
-
The Nuclear Fuel Cycle: From Ore to Waste, ed. P. D. Wilson, Oxford University Press, 1996 Search PubMed
 .
.
- N. Kaltsoyannis, Inorg. Chem., 2013, 52, 3407 CrossRef CAS PubMed .
- J. C. Braley, T. S. Grimes and K. L. Nash, Ind. Eng. Chem. Res., 2012, 51, 629 CrossRef .
- M. Nilsson and K. L. Nash, Solvent Extr. Ion Exch., 2007, 25, 665 CrossRef CAS .
- M. P. Jensen and A. H. Bond, Radiochim. Acta, 2002, 90, 205 CAS .
- M. P. Jensen and A. H. Bond, J. Am. Chem. Soc., 2002, 124, 9870 CrossRef CAS PubMed .
- G. Benay, R. Schurhammer, J. Desaphy and G. Wipff, New J. Chem., 2011, 35, 184 RSC .
- G. Benay, R. Schurhammer and G. Wipff, Phys. Chem. Chem. Phys., 2010, 12, 11089 RSC .
- M. A. Denecke, A. Rossberg, P. J. Panak, M. Weigl, B. Schimmelpfennig and A. Geist, Inorg. Chem., 2005, 44, 8418 CrossRef CAS PubMed .
- M. G. B. Drew, D. Guillaneux, M. J. Hudson, P. B. Iveson, M. L. Russell and C. Madic, Inorg. Chem. Commun., 2001, 4, 12 CrossRef CAS .
- M. R. S. J. Foreman, M. J. Hudson, M. G. B. Drew, C. Hill and C. Madic, Dalton Trans., 2006, 1645 RSC .
- D. Guillaumont, J. Phys. Chem. A, 2004, 108, 6893 CrossRef CAS .
- C. Hill, D. Guillaneux, L. Berthon and C. Madic, J. Nucl. Sci. Technol., 2002,(Suppl. 3), 309 CrossRef CAS .
- P. B. Iveson, C. Rivière, D. Guillaneux, M. Nierlich, P. Thuéry, M. Ephritikine and C. Madic, Chem. Commun., 2001, 1512 RSC .
- F. W. Lewis, L. M. Harwood, M. J. Hudson, M. G. B. Drew, G. Modolo, M. Syupla, J. F. Desreux, N. Bouslimani and G. Vidick, Dalton Trans., 2010, 39, 5172 RSC .
- M. Miguirditchian, D. Guillaneux, D. Guillaumont, P. Moisy, C. Madic, M. P. Jensen and K. L. Nash, Inorg. Chem., 2005, 44, 1404 CrossRef CAS PubMed .
- M. Weigl, A. Geist, U. Mullich and K. Gompper, Solvent Extr. Ion Exch., 2006, 24, 845 CrossRef CAS .
- A. Afsar, D. M. Laventine, L. M. Harwood, M. J. Hudson and A. Geist, Chem. Commun., 2013, 49, 8534 RSC .
- L. Petit, C. Adamo and P. Maldivi, Inorg. Chem., 2006, 45, 8517 CrossRef CAS PubMed .
- D. Girnt, P. W. Roesky, A. Geist, C. M. Ruff, P. J. Panak and M. A. Denecke, Inorg. Chem., 2010, 49, 9627 CrossRef CAS PubMed .
-
R. F. W. Bader, Atoms in Molecules: A Quantum Theory, OUP, Oxford, 1990 Search PubMed .
- M. J. Tassell and N. Kaltsoyannis, Dalton Trans., 2010, 39, 6719 RSC .
- I. Kirker and N. Kaltsoyannis, Dalton Trans., 2011, 40, 124 RSC .
- K. I. M. Ingram, M. J. Tassell, A. J. Gaunt and N. Kaltsoyannis, Inorg. Chem., 2008, 47, 7824 CrossRef CAS PubMed .
- I. D. Prodan, G. E. Scuseria and R. L. Martin, Phys. Rev. B: Condens. Matter, 2007, 76, 033101 CrossRef .
- D. D. Schnaars, A. J. Gaunt, T. W. Hayton, M. B. Jones, I. Kirker, N. Kaltsoyannis, I. May, S. D. Reilly, B. L. Scott and G. Wu, Inorg. Chem., 2012, 51, 8557 CrossRef CAS PubMed .
- A. C. Behrle, C. L. Barnes, N. Kaltsoyannis and J. R. Walensky, Inorg. Chem., 2013, 52, 10623 CrossRef CAS PubMed .
- M. B. Jones, A. J. Gaunt, J. C. Gordon, N. Kaltsoyannis, M. P. Neu and B. L. Scott, Chem. Sci., 2013, 4, 1189 RSC .
- J. L. Brown, S. Fortier, N. Kaltsoyannis and T. W. Hayton, J. Am. Chem. Soc., 2013, 135, 5352 CrossRef CAS PubMed .
- P. L. Arnold, J. H. Farnaby, R. C. White, N. Kaltsoyannis, M. G. Gardiner and J. B. Love, Chem. Sci., 2014, 5, 756 RSC .
- E. Hashem, A. N. Swinburne, C. Schulzke, R. C. Evans, J. A. Platts, A. Kerridge, L. S. Natrajan and R. J. Baker, RSC Adv., 2013, 3, 4350 RSC .
- H. D. Li, H. Feng, W. G. Sun, R. B. King and H. F. Schaefer, Inorg. Chem., 2013, 52, 6893 CrossRef CAS PubMed .
- V. Vallet, U. Wahlgren and I. Grenthe, J. Phys. Chem. A, 2012, 116, 12373 CrossRef CAS PubMed .
- B. Vidjayacoumar, S. Ilango, M. J. Ray, T. Chu, K. B. Kolpin, N. R. Andreychuk, C. A. Cruz, D. J. H. Emslie, H. A. Jenkins and J. F. Britten, Dalton Trans., 2012, 41, 8175 RSC .
- V. V. Zhurov, E. A. Zhurova and A. A. Pinkerton, Inorg. Chem., 2011, 50, 6330 CrossRef CAS PubMed .
- V. V. Zhurov, E. A. Zhurova, A. I. Stash and A. A. Pinkerton, J. Phys. Chem. A, 2011, 115, 13016 CrossRef CAS PubMed .
- M. K. Hong, B. P. Uberuaga, D. A. Andersson, C. R. Stanek, S. R. Phillpot and S. B. Sinnott, Comput. Mater. Sci., 2013, 78, 29 CrossRef CAS .
- J. L. Nie, H. Y. Xiao, F. Gao and X. T. Zu, J. Alloys Compd., 2009, 476, 675 CrossRef CAS .
- H. Wang and K. Konashi, J. Alloys Compd., 2012, 533, 53 CrossRef CAS .
- Y. Lu, D. F. Li, B. T. Wang, R. W. Li and P. Zhang, J. Nucl. Mater., 2011, 408, 136 CrossRef CAS .
- Y. Lu, B. T. Wang, R. W. Li, H. L. Shi and P. Zhang, J. Nucl. Mater., 2011, 410, 46 CrossRef CAS .
- A. R. E. Mountain and N. Kaltsoyannis, Dalton Trans., 2013, 42, 13477 RSC .
- G. Cavigliasso and N. Kaltsoyannis, Inorg. Chem., 2006, 45, 6828 CrossRef CAS PubMed .
- R. Tonner, G. Heydenrych and G. Frenking, Chem. – Asian J., 2007, 2, 1555 CrossRef CAS PubMed .
- J. Haller, N. Kaltsoyannis, M. J. Sarsfield, I. May, S. Cornet, M. Redmond and M. Helliwell, Inorg. Chem., 2007, 46, 4868 CrossRef PubMed .
- T. Ziegler and A. Rauk, Theor. Chim. Acta, 1977, 46, 1 CrossRef CAS .
- T. Ziegler and A. Rauk, Inorg. Chem., 1979, 18, 1558 CrossRef CAS .
-
M. J. Frisch, G. W. Trucks, H. B. Schlegel, G. E. Scuseria, M. A. Robb, J. R. Cheeseman, G. Scalmani, V. Barone, B. Mennucci, G. A. Petersson, H. Nakatsuji, M. Caricato, X. Li, H. P. Hratchian, A. F. Izmaylov, J. Bloino, G. Zheng, J. L. Sonnenberg, M. Hada, M. Ehara, K. Toyota, R. Fukuda, J. Hasegawa, M. Ishida, T. Nakajima, Y. Honda, O. Kitao, H. Nakai, T. Vreven, J. Montgomery, Jr., J. E. Peralta, F. Ogliaro, M. Bearpark, J. J. Heyd, E. Brothers, K. N. Kudin, V. N. Staroverov, R. Kobayashi, J. Normand, K. Raghavachari, A. Rendell, J. C. Burant, S. S. Iyengar, J. Tomasi, M. Cossi, M. Rega, N. J. Millam, M. Klene, J. E. Knox, J. B. Cross, V. Bakken, C. Adamo, J. Jaramillo, R. E. Gomperts, O. Stratmann, A. J. Yazyev, R. Austin, C. Cammi, J. W. Pomelli, R. Ochterski, R. L. Martin, K. Morokuma, V. G. Zakrzewski, G. A. Voth, P. Salvador, J. J. Dannenberg, S. Dapprich, A. D. Daniels, O. Farkas, J. B. Foresman, J. V. Ortiz, J. Cioslowski and D. J. Fox, Gaussian, Inc., Wallingford, CT, 2009 .
- X. Y. Cao and M. Dolg, J. Mol. Struct. (THEOCHEM), 2004, 673, 203 CrossRef CAS .
- X. Y. Cao, M. Dolg and H. Stoll, J. Chem. Phys., 2003, 118, 487 CrossRef CAS .
- A. Becke, Phys. Rev. A, 1988, 38, 3098 CrossRef CAS .
- J. M. Tao, J. P. Perdew, V. N. Staroverov and G. E. Scuseria, Phys. Rev. Lett., 2003, 91, 146401 CrossRef PubMed .
- V. N. Staroverov, G. E. Scuseria, J. M. Tao and J. P. Perdew, J. Chem. Phys., 2003, 119, 12129 CrossRef CAS .
- D. A. Pantazis and F. Neese, J. Chem. Theory Comput., 2011, 7, 677 CrossRef CAS .
-
T. A. Keith, TK Gristmill Software, 2013 Search PubMed .
-
C. F. Matta and R. J. Boyd, in The quantum theory of atoms in molecules, ed. C. F. Matta and R. J. Boyd, Wiley-VCH, Weinheim, 2007, pp. 1–34 Search PubMed .
- D. Cremer and E. Kraka, Angew. Chem., Int. Ed. Engl., 1984, 23, 627 CrossRef .
- S. M. Mansell, N. Kaltsoyannis and P. L. Arnold, J. Am. Chem. Soc., 2011, 133, 9036 CrossRef CAS PubMed .
- F. G. N. Cloke, J. C. Green and N. Kaltsoyannis, Organometallics, 2004, 23, 832 CrossRef CAS .
- N. Kaltsoyannis and P. Scott, Chem. Commun., 1998, 1665 RSC .
- P. Roussel, W. B. Errington, N. Kaltsoyannis and P. Scott, J. Organomet. Chem., 2001, 635, 69 CrossRef CAS .
-
J. Emsley, The Elements, Oxford University Press, Oxford, 2nd edn, 1991 Search PubMed .
- J. Marcalo and J. K. Gibson, J. Phys. Chem. A, 2009, 113, 12599 CrossRef CAS PubMed .
- I. Infante, A. Kovacs, G. La Macchia, A. R. M. Shahi, J. K. Gibson and L. Gagliardi, J. Phys. Chem. A, 2010, 114, 6007 CrossRef CAS PubMed .
- C. C. L. Pereira, C. J. Marsden, J. Marcalo and J. K. Gibson, Phys. Chem. Chem. Phys., 2011, 13, 12940 RSC .
- K. Hassomal Birjkumar, N. D. Bryan and N. Kaltsoyannis, Dalton Trans., 2011, 40, 11248 RSC .
- K. Hassomal Birjkumar, N. D. Bryan and N. Kaltsoyannis, Dalton Trans., 2012, 41, 5542 RSC .
- Y. Takano and K. N. Houk, J. Chem. Theory Comput., 2004, 1, 70 CrossRef .
Footnotes |
| † Electronic supplementary information (ESI) available. See DOI: 10.1039/c4dt02323d |
| ‡ Such bond length underestimation is, most likely, a common problem in systems of this type. |
| § The result for [Np(OPh)3]2(μ–η2:η2-N2) is clearly at odds with the other data in Table 6. We have not been able to identify the reason for this, and have excluded this compound from subsequent analysis. |
| ¶ We take the modulus of the charge difference on the grounds that if the metric is to have general applicability it should not matter whether the bond is formed by transfer of charge from the metal or to it. |
| || The dissociation energies measured experimentally correspond to the process described by eqn (3); hence we used this approach in our benchmarking studies. The QTAIM calculations, however, provide data for both An–O bonds in AnO2n+ simultaneously, and hence we felt that eqn (4) would provide better energies with which to compare the QTAIM metrics. |
|
| This journal is © The Royal Society of Chemistry 2015 |

 Open Access Article
 This Open Access Article is licensed under a


