 Open Access Article
What type of nanoscopic environment does a cationic fluorophore experience in room temperature ionic liquids?†
Anup
Ghosh
,
Chayan K.
De
,
Tanmay
Chatterjee
and
Prasun K.
Mandal
*
Department of Chemical Sciences, Indian Institute of Science Education and Research (IISER) – Kolkata, Mohanpur, West-Bengal 741246, India. E-mail: prasunchem@iiserkol.ac.in
First published on 26th May 2015
Abstract
In the presence of a cationic fluorophore (rhodamine 6G) whose absorption has a significant spectral overlap with the emission of a room temperature ionic liquid (RTIL), the emission of the latter gets quenched, and the quenching has been shown to be dynamic in nature. It has been shown that resonance energy transfer (RET) indeed happens between the RTIL (donor) and rhodamine 6G (cationic acceptor), and RET is the reason for the quenching of the RTIL emission. The spectral and temporal aspects of the RET (between neat RTILs as the donors and rhodamine 6G as the acceptor) were closely studied by steady-state and picosecond time-resolved fluorescence spectroscopy. The influence of the alkyl chain length of the cation, size of the anion, excitation wavelength and concentration of the acceptor on the RET dynamics were also investigated. The energy transfer time (obtained from the rise time of the acceptor) was noted to vary from 2.5 ns to 4.1 ns. By employing the Förster formulation, the donor–acceptor distance was obtained, and its magnitude was found to vary between 31.8 and 37.1 Å. The magnitude of the donor–acceptor distance was shown to be independent of the alkyl chain length of the cation but dependent on the size of the anion of the RTIL. Moreover, the donor–acceptor distance was observed to be independent of the excitation wavelength or concentration of the acceptor. It was shown that the Förster formulation can possibly account for the mechanism and hence can explain the experimental observables in the RET phenomenon. Following the detailed experiments and rigorous analysis, a model has been put forward, which can successfully explain the nanoscopic environment that a cationic fluorophore experiences in an RTIL. Moreover, the nanoscopic environment experienced by the cationic probe has been noted to be different from that experienced by a neutral fluorophore.
Introduction
The versatility of a solvent depends on its ability to adjust its nanoscopic environment so as to incorporate the incoming solute.1 In this regard, room temperature ionic liquids (RTILs) are quite special as they can dissolve a range of compounds ranging from nonpolar hexane to highly polar water, as well as from neutral to cationic to anionic probes.1,2 Thus, remarkable interest in RTILs as a class of non-volatile environmentally-green benign solvents has been generated. Moreover, RTILs have other interesting properties like very low vapor pressure, low melting point, high thermal stability, inflammability, recyclability, high ionic conductivity, etc.3–9 Thus, RTILs have been actively used in synthesis, (bio)catalysis, material science, and chemical engineering specially in energy-related applications, such as batteries, fuel cell photovoltaics, super-capacitors, etc.3–9 However, what kind of nanoscopic environment a dissolved solute (be it nonpolar/polar/neutral/cationic/anionic) experiences in an RTIL is still not known in detail.RTILs are special in the sense that, unlike conventional organic solvents, they possess structural nano-domains both in the solid and liquid state.10–26 From crystal structure studies it has been shown that nanostructural heterogeneities in neat RTILs can range up to a few nanometers, with the actual magnitude depending on the alkyl chain length of the imidazolium ring. The existence of π–π interactions and intermolecular hydrogen bonding between imidazolium rings have been reported.10,13,14 The existence of local mesoscopic heterogeneities, i.e. in the nanoscale segregation of local structures, has been shown to prevail in RTILs by neutron scattering studies, as well as by simulation studies, and the size of the nonpolar domain has been shown to increase with increases in the alkyl chain length of the imidazolium ring.15–29
The unusual steady-state excitation wavelength dependent emission behaviour (known as the red edge effect (REE)) exhibited by neat RTILs has been assigned to the existence of the different energetically associated forms and to the lack of solvation/energy transfer between those species.30,31 Recently, it has been shown that neat RTILs exhibit excitation, as well as monitoring, wavelength dependent fluorescence decay behaviour.32 No rise time in picoseconds or longer time regimes could be observed.32 This proves that no energy transfer among different nano-domains takes place in picoseconds or longer timescales. Thus, the reason for the observation of REE in neat RTILs can be understood. It has also been shown that some dipolar solutes show REE in an RTIL perhaps because of incomplete solvation or the existence of specific interactions (like H-bonding) between the dipolar probe and RTIL.33–35 Fluorescence dynamical studies have shown that probe-dependent solvation in RTILs is biphasic in nature, where one component is typically of a few hundred picoseconds and the other component is in the range of a few nanoseconds.35–38 However, because of the complex structural aspect of RTILs, the nature of the solvation structure is still not fully understood. Hence, it is very much necessary to understand the nanoscopic environment a probe experiences while being dissolved in an RTIL.
Resonance energy transfer studies in RTILs have been reported earlier.39–42 Very recently a modest but significant effort has been made towards understanding the nanoscopic environment a fluorophore experiences while being dissolved in an RTIL by exploring this with the resonance energy transfer (RET) technique.43 The probe chosen was a neutral one.43 Förster formulation44 has been shown to explain the fluorescence dynamical parameters related to the RET phenomenon with reasonable accuracy. The rise time (varying from 3.00 to 4.00 ns) or rate constant of energy transfer has been shown to be independent of the excitation wavelength and the concentration of the acceptor. However, the magnitude of the rise time has been shown to vary with the nature of the cation (alkyl chain length) and with the size of the anion. By employing Förster formulation, the donor–acceptor distance inside nanostructural RTIL media could be obtained, and were seen to vary from 30.35 to 36.48 Å.43 The size of the nanostructural cage has been shown to be dependent on the size of the alkyl chain length of the cation, as well as on the size of the anion of the RTILs.43 It was shown that the size of the nanoscopic cages does not depend on the excitation wavelength or concentration of the acceptor. Following detailed experiments and rigorous analysis, a model has been put forward that can successfully explain the nanoscopic environment that a neutral fluorophore experiences in an RTIL.43
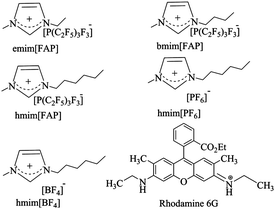
RTILs are composed of cations and anions. Hence the kind of environment an ionic probe will experience should be different from the environment experienced by a neutral probe. In order to gain an insight in this direction, we used rhodamine 6G as a reference cationic probe to help us explore the RET phenomenon between RTILs (as a donor) and rhodamine 6G (as an acceptor). We employed RTILs with the same cation but different anion and vice versa in order to understand the effect of the cation and anion on the nanocages that are formed surrounding the cationic probe. We used different concentrations of the reference cationic probe (acceptor) in order to understand the effect of the concentration of the acceptor on the RET dynamics. Moreover, since different fluorescence dynamics in RTILs have been shown to be excitation and monitoring wavelength dependent, we probed different excitation and monitoring wavelengths to probe their effect on RET dynamics. All these rigorous experiments, are helpful in order to understand whether the Förster method44 can account for the experimentally observable RET phenomenon. The chemical structure of the RTILs and rhodamine 6G are depicted in Chart 1.
Experimental
Steady-state absorption and fluorescence spectra were recorded with a UV-vis spectrophotometer (Cary100, Varian) and a spectrofluorimeter (Fluoromax-3), respectively. The experimental temperature was maintained at 298 K. Time resolved fluorescence decay experiments were carried out using a time-correlated single-photon counting (TCSPC) spectrometer (5000, IBH). Two diode lasers (377 nm and 402 nm) were used as the excitation sources, and an MCP photomultiplier was used as the detector. The instrument response function (IRF) was detected by placing a scatterer, and the FWHM of the IRF was ∼70 ps. A nonlinear least-squares iteration procedure using IBH DAS 6 (Version 2.2) decay analysis software was used for the fitting of all the decay curves. χ2 values and the plot of residuals were used as parameters to check the goodness of the fit. The fluorescence quantum yields were calculated using coumarin 153 as a reference.Results and discussion
The RTILs show (see the ESI†) typical broad absorption spectra in UV region, with a long tail extending in to the visible region. The emission behavior of these five RTILs is quite broad in the UV-vis region (see ESI†). A representative plot emission of hmim[BF4] is shown in Fig. 1. Also shown in the same figure is the absorption spectrum of rhodamine 6G. The significant spectral overlap between the emission spectrum of the donor (RTIL) and the absorption spectrum of the acceptor (rhodamine 6G) fulfils the prerequisite condition to observe RET between the donor and the acceptor.45,46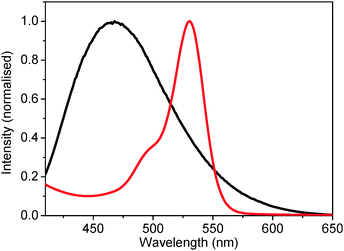 | ||
| Fig. 1 Emission spectrum of the donor (hmim[BF4]) [λex = 377 nm] and the absorption spectrum of the acceptor (rhodamine 6G). | ||
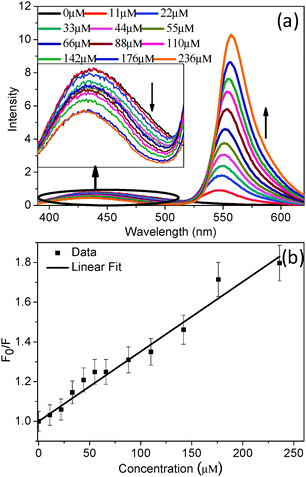
With increasing the concentration of the acceptor (rhodamine 6G), the emission intensity of the donor (hmim[BF4]) decreases gradually (Fig. 2a). This observation indicates that more and more quenching of the donor emission is happening with increase in the concentration of the acceptor. From the steady-state emission of the donor, a Stern–Volmer plot was obtained and is depicted in Fig. 2b. A linear Stern–Volmer plot (Fig. 2b) indicates that the nature of the quenching is either static or dynamic.45,46
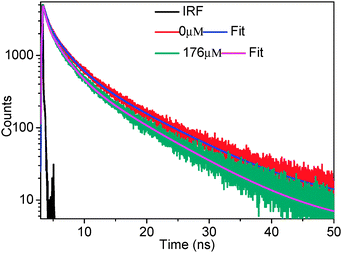
In order to know whether static or dynamic quenching is happening, the time resolved fluorescence decay of the donor was measured. As can be seen from Fig. 3, the donor (hmim[BF4]) decay becomes faster with increasing the concentration of the acceptor (rhodamine 6G). This observation clearly indicates that the nature of the quenching is dynamic.
The excited state time constants of the donor decay are depicted in Table 1. As can be seen from Table 1, for excitation at 377 nm, the excitation average lifetime of the donor (RTIL) decreases from 4.87 ns to 4.08 ns on changing the concentration of the acceptor (rhodamine 6G) from 0 to 236 μM. Thus, a reduction of ∼16% of the average lifetime of the donor was noted. Also, for excitation at 402 nm, the reduction of the average lifetime of the donor was noted to be ∼16% (from 6.14 ns to 5.16 ns). Thus, the reduction of the average lifetime of the donor was noted to be independent of the excitation wavelength.
| λ ex (nm) | λ em (nm) | Conc. (μM) | τ 1 (ns) | B 1 | τ 2 (ns) | B 2 | τ 3 (ns) | B 3 | 〈τ〉 (ns) | χ 2 |
|---|---|---|---|---|---|---|---|---|---|---|
| 377 | 450 | 0 | 0.34 | 9.20 | 2.07 | 39.79 | 7.89 | 51.01 | 4.87 | 1.09 |
| 88 | 0.47 | 12.00 | 2.23 | 36.77 | 7.71 | 51.23 | 4.84 | 1.20 | ||
| 110 | 0.51 | 10.05 | 1.95 | 34.75 | 7.08 | 55.20 | 4.63 | 1.35 | ||
| 142 | 0.50 | 9.69 | 1.90 | 34.34 | 6.94 | 55.97 | 4.58 | 1.36 | ||
| 176 | 0.37 | 10.8 | 2.00 | 43.44 | 7.60 | 45.75 | 4.38 | 1.27 | ||
| 236 | 0.45 | 13.54 | 2.02 | 43.73 | 7.36 | 42.73 | 4.08 | 1.22 | ||
| 402 | 470 | 0 | 0.88 | 13.25 | 3.31 | 43.84 | 10.67 | 42.91 | 6.14 | 1.06 |
| 88 | 0.34 | 7.82 | 2.42 | 39.25 | 9.10 | 52.93 | 5.79 | 1.22 | ||
| 110 | 0.34 | 8.63 | 2.36 | 39.86 | 8.78 | 51.51 | 5.49 | 1.21 | ||
| 142 | 0.26 | 8.37 | 2.20 | 38.73 | 8.45 | 52.90 | 5.34 | 1.21 | ||
| 176 | 0.27 | 7.80 | 2.21 | 38.28 | 8.42 | 53.91 | 5.26 | 1.18 | ||
| 236 | 0.26 | 6.92 | 1.96 | 36.61 | 7.85 | 56.47 | 5.16 | 1.28 | ||
However, that still does not prove that the quenching occurs because of the resonance energy transfer between the RTIL as a donor and rhodamine 6G as an acceptor. It has been documented in literature that it could only be the quenching of the donor fluorescence, without resonance energy transfer to acceptor.45–48 We would like to emphasise that observation of the Stern–Volmer plot or the faster fluorescence decay of the donor in the presence of the acceptor does not necessarily mean that RET is happening. To check whether RET is indeed happening or not we measured the fluorescence decay of the acceptor. The excitation wavelength for the fluorescence decay of the acceptor (following RET) was judiciously chosen in such a way that mostly donors will be excited at the excitation wavelength and the extent of direct excitation of the acceptor is at a minimum. If RET is happening between the RTIL (donor) and rhodamine 6G (acceptor) then we should observe a rise in the fluorescence decay profile of the acceptor in a shorter timescale followed by a decay at the longer timescales.45,46 The fluorescence decay behavior of rhodamine 6G (acceptor) is depicted in Fig. 4.
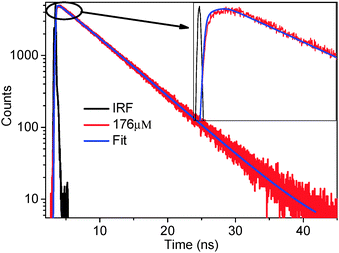 | ||
| Fig. 4 Fluorescence decay curve of the acceptor (rhodamine 6G) (λex = 377 nm, λem = 550 nm, concentration of acceptor = 264 μM). A clear rise is shown in the inset. | ||
The observation of a rise in fluorescence decay means that at the time of excitation the acceptor molecules are not directly excited, rather they are excited because of the RET and the rise time is the time taken for the RET to happen. A clear rise (see inset of Fig. 4) followed by decay of the acceptor proves that RET is indeed happening from the RTIL (hmim[BF4]) (as donor) to the rhodamine 6G (acceptor) (for the other four RTILs see the ESI†). This proves that the reason for the quenching of the donor fluorescence is RET from the donor to the acceptor. To probe whether there is any excitation wavelength dependent RET dynamics, we performed time resolved fluorescence decay measurements of the acceptor monitoring at 560 nm following excitation with 377 nm and 402 nm diode lasers. To probe whether there is any concentration dependent rise time of RET, we chose different concentrations of the acceptor (88, 110, 142, 176, 236 μM). The time constants of the RET phenomenon and that of the acceptor decay are depicted in Table 2 (for the other four RTILs see the ESI†). As can be seen from Table 2, the (rise) time of RET is ∼2.60 ns to 2.68 ns at 377 nm excitation and 2.49 ns to 2.57 ns at 402 nm excitation. Thus, the magnitude of rise time (hence the rate of RET) is noted to be independent of the excitation wavelength. More interestingly, the magnitude of the rise time does not change significantly (2.60 to 2.68 ns) with increase in the acceptor concentration (from 88 to 236 μM). Thus, the magnitude of the rise time (hence the energy transfer time of RET) is noted to be independent of concentration.
| λ ex (nm) | λ em (nm) | Conc. (μM) | τ 1 (ns) | B 1 | τ 2 (ns) | B 2 | χ 2 |
|---|---|---|---|---|---|---|---|
a The decay behaviour has been fitted with a tri-exponential decay function y = y0 + ∑Bi*![[thin space (1/6-em)]](https://www.rsc.org/images/entities/char_2009.gif) exp(−t/τi). (Note that ∑Bi = 100). (A negative value of Bi means a rise and a positive value of Bi means decay). exp(−t/τi). (Note that ∑Bi = 100). (A negative value of Bi means a rise and a positive value of Bi means decay).
|
|||||||
| 377 | 550 | 88 | 2.60 | −1.88 | 4.99 | 101.88 | 1.24 |
| 110 | 2.62 | −2.52 | 5.16 | 102.52 | 1.14 | ||
| 142 | 2.64 | −4.17 | 5.45 | 104.17 | 1.24 | ||
| 176 | 2.68 | −5.23 | 5.53 | 105.23 | 1.27 | ||
| 236 | 2.67 | −1.87 | 5.59 | 101.88 | 1.25 | ||
| 402 | 560 | 88 | 2.50 | −4.79 | 5.19 | 104.79 | 1.07 |
| 110 | 2.49 | −5.56 | 5.34 | 105.56 | 1.08 | ||
| 142 | 2.57 | −3.81 | 5.55 | 103.81 | 0.97 | ||
| 176 | 2.54 | −5.98 | 5.52 | 105.98 | 1.08 | ||
| 236 | 2.49 | −3.69 | 5.84 | 103.69 | 1.02 | ||
The magnitude of spectral overlap J(λ) could be calculated following Förster theory44 using eqn (1):
 | (1) |
| R0 = 0.211[κ2n−4QDJ(λ)]1/6 | (2) |
The distance between the donor and acceptor (RDA) could be calculated following Förster theory44 using the following eqn (3):
 | (3) |
The magnitude of the parameters associated with the Förster formulation are depicted in Table 3. Using the Förster formulation, we calculated the donor–acceptor distance (RDA). The magnitude of RDA was found to be independent on the nature of the cation of the RTIL. With the same anion (FAP), the magnitude of RDA was found to remain unchanged (37.13–37.26 Å) with a change in the alkyl chain length (from ethyl to hexyl). However, for the same cationic chain length (hmim), the magnitude of RDA was found to increase (31.84 Å to 37.26 Å) as the size of the anion increases (from BF4 to PF6 to FAP). Thus, the distance between the donor and the acceptor remains unchanged with changes in the alkyl chain length of the cation but increases with increase in the size of the anion.
| λ ex (nm) | RTILs | τ 0D (ns) | φ | J(λ) (1015) (M−1 cm−1 nm4) | τ rise (ns) | R 0 (Å) | R DA (Å) | k FRET (108 s−1) |
|---|---|---|---|---|---|---|---|---|
| 377 | emim[FAP] | 8.48 | 0.21 | 1.63 | 4.14 | 41.83 | 37.13 | 2.42 |
| bmim[FAP] | 8.61 | 0.24 | 1.81 | 3.34 | 43.54 | 37.19 | 2.99 | |
| hmim[FAP] | 4.82 | 0.23 | 1.11 | 3.28 | 39.72 | 37.26 | 3.04 | |
| hmim[PF6] | 4.33 | 0.08 | 1.83 | 2.64 | 36.15 | 33.28 | 3.78 | |
| hmim[BF4] | 4.87 | 0.09 | 1.36 | 2.62 | 34.79 | 31.84 | 3.82 | |
| 402 | emim[FAP] | 6.37 | 0.13 | 1.98 | 4.14 | 39.81 | 37.17 | 2.41 |
| bmim[FAP] | 7.30 | 0.19 | 2.03 | 3.24 | 42.63 | 37.10 | 3.08 | |
| hmim[FAP] | 4.02 | 0.18 | 1.21 | 3.26 | 38.44 | 37.14 | 3.06 | |
| hmim[PF6] | 5.13 | 0.08 | 2.17 | 2.71 | 37.04 | 33.29 | 3.69 | |
| hmim[BF4] | 6.14 | 0.10 | 1.74 | 2.50 | 36.91 | 31.77 | 4.00 | |
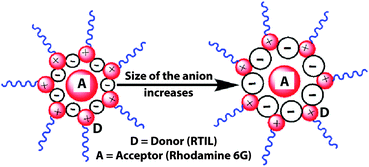
The magnitude of RDA, i.e. the distance between the donor and acceptor, was found to remain unchanged for different excitation wavelengths say for 377 nm and 402 nm (for a particular RTIL, hmim[BF4] the values are 31.84 Å and 31.77 Å, respectively). Different photophysical processes in a particular RTIL have been shown to be dependent on the excitation wavelength.35–37 However, a recent communication has shown that the dynamical fluorescence behaviour of a fluorophore, (dissolved in an RTIL) whose emission is beyond that of the RTIL, is excitation wavelength independent.32 In the present report, we used rhodamine 6G, whose emission is beyond that of the RTIL, and the dynamics of RET process was found to be excitation wavelength independent. A similar excitation wavelength independent magnitude of RDA had been noted earlier using a neutral fluorophore.43 No matter what methodology we use, physically the donor–acceptor distance (RDA) is fixed and independent of the method we employ. For different excitation wavelengths, the magnitude of spectral overlap (J(λ)), and hence the Förster distance (R0), will be different as the emission of these RTILs is excitation wavelength dependent. However, using the Förster formulation, even for different excitation wavelengths the magnitude of the donor–acceptor distance (RDA) was found to be very close for a particular RTIL. This observation points to the fact that perhaps the Förster formulation can account for the mechanism of RET dynamics in RTILs. A similar observation had been noted earlier using a neutral fluorophore.43 However, what is still intriguing is the fact that the dynamics of RET i.e. the risetime of RET is independent of the concentration of the acceptor. In a homogeneous medium, with an increase in concentration of the acceptor, the distance between the donor and acceptor is expected to decrease and hence so will the energy transfer time. However, in the present case, the energy transfer time has been found to be independent of the concentration of acceptor. This means that with increases in the acceptor concentration, the distance between the donor–acceptor pair remains the same. In order to explain these experimental observations we have put forward a model shown in Scheme 1. The concentration dependent change in RET dynamics is true for homogeneous media. However, RTILs are known to be inherently heterogeneous. According to our model (see Scheme 1), the cation and anion of the RTIL remain side by side and the tail of the cation remains outside the cage. It has been shown earlier that the emission of the RTIL is because of the imidazolium moiety.30,31 As the tail of the cation remains outside, the distance between the donor (imidazolium ring) and the acceptor remains unchanged with changes in the alkyl chain length of the cation of the RTIL. Thus, for a particular anion, the distance between the donor and the acceptor should remain unchanged. This is exactly what we observed experimentally. This behavior is exactly opposite what had been observed using a neutral fluorophore.43 Moreover, as the size of the anion increases from BF4 to PF6 to FAP (for the same cation, hmim) the distance between the imidazolium moiety (donor) and the rhodamine 6G (acceptor) should increase (Scheme 1). This is also exactly what we observed experimentally.
According to our model (Scheme 1), the acceptor rhodamine 6G will go to these nanocages and, since the concentration of neat RTIL (∼M) is a few orders higher than the concentration of the fluorophore (∼a few hundred μM), with increase in the acceptor concentration, the fluorophore will go to different nanocages and as a result the distance between the donor and acceptor will remain the same for a particular RTIL–rhodamine 6G pair. Hence, the rise time or rate constant of the RET phenomenon should remain the same, even with increase in the concentration of the acceptor. This is what we observed experimentally. Thus, rigorous experiments and analyses provide evidence that nanocages do form in RTIL surrounding the acceptor. Thus, the optical spectroscopic results mentioned in the manuscript help us understand the nanoscopic environment that a cationic probe (rhodamine 6G) experiences inside an RTIL. However, the nanoscopic environment experienced by a cationic probe (rhodamine 6G) is quite different from the nanoscopic environment experienced by a neutral probe. This observation makes it more interesting to probe the nanoscopic environment experienced by the anionic probe. These experiments are currently underway and soon the results of these investigations will be reported.
It has been shown that fluorescence from an RTIL is inherent and not due to any impurity.30,31,41,43 Earlier, from spectroscopic characterization (NMR and MS), it was clearly shown that RTILs are sufficiently pure and any impurities present, if at all, should be of sub-micromolar concentration.43 Researchers working on RET are well aware that in order to observe RET the distance between the donor and acceptor should be below 200 Å. In order to achieve such a distance (assuming a hard sphere model), the concentration of the donor or acceptor should be ∼100 μM or higher. Moreover, different RET dynamics should be observed for different types of acceptor molecules (neutral and cationic probe) using the same RTILs. Thus, it could be shown beyond any doubt that it is not the impurity but rather the inherent emission of imidazolium that is involved in the RET process.
Conclusions
In conclusion, we have shown that in the presence of a cationic fluorophore (rhodamine 6G) as an acceptor whose absorption has significant spectral overlap with the emission of the RTIL, the emission of the latter can be quenched and the nature of the quenching has been shown to be dynamic. It has been shown that RET is indeed happening between the RTIL (donor) and the rhodamine 6G (cationic acceptor) and RET is the reason for quenching of the RTIL emission. By employing a Förster formulation, we obtained the donor acceptor distance (31.8 Å to 37.1 Å). The magnitude of the donor–acceptor distance was shown to be independent of the alkyl chain length of the cation but dependent on the size of the anion of the RTILs. Moreover, the donor–acceptor distance was noted to be independent of the excitation wavelength or concentration of the acceptor. It has been shown that the Förster formulation can perhaps account for the mechanism and hence can explain the experimental observables in the RET phenomenon. Finally, we put forward a model that can explain the experimental observables with reasonable accuracy. Also, the nanoscopic environment experienced by the cationic probe was noted to be different from that of the neutral probe.Notes
The authors declare no competing financial interests.Acknowledgements
PKM thanks IISER – Kolkata for financial help and instrumental facilities. Support from the Fast-Track Project (SR/FT/CS-52/2011) of DST-India is gratefully acknowledged. AG thanks UGC, CKD thanks IISER – Kolkata, TC thanks CSIR – India for Fellowship.References
- T. Welton, Chem. Rev., 1999, 99, 2071–2083 CrossRef CAS PubMed.
- P. Wasserscheid and W. Keim, Angew. Chem., Int. Ed., 2000, 39, 3772–3789 CrossRef CAS.
- J. Dupont, R. F. D. Souza and P. A. Z. Suarez, Chem. Rev., 2002, 102, 3667–3692 CrossRef CAS PubMed.
- R. D. Rogers and K. R. Seddon, Science, 2003, 302, 792–793 CrossRef PubMed.
- K. R. Seddon, Nat. Mater., 2003, 2, 363–365 CrossRef CAS PubMed.
- H. Weingaertner, Angew. Chem., Int. Ed., 2008, 47, 654–670 CrossRef CAS PubMed.
- J. P. Hallet and T. Welton, Chem. Rev., 2011, 111, 3508–3576 CrossRef PubMed.
- J. D. Holbrey, W. M. Reichert and R. D. Rogers, Dalton Trans., 2004, 2267–2271 RSC.
- S.-H. Chen, F.-R. Yang, M.-T. Wang and N.-N. Wang, C. R. Chim., 2010, 13, 1391–1396 CrossRef CAS PubMed.
- W. A. Henderson, P. Fylstra, H. C. D. Long, P. C. Trulove and S. Parsons, Phys. Chem. Chem. Phys., 2012, 14, 16041–16046 RSC.
- A. Triolo, O. Russina, H.-J. Bleif and E. Di Cola, J. Phys. Chem. B, 2007, 111, 4641–4644 CrossRef CAS PubMed.
- C. Hardacre, J. D. Holbrey, C. L. Mullan, M. Nieuwenhuyzen, T. G. A. Youngs and D. T. Bowron, J. Phys. Chem. B, 2008, 112, 8049–8056 CrossRef CAS PubMed.
- C. Hardacre, J. D. Holbrey, C. L. Mullan, T. G. A. Youngs and D. T. Bowron, J. Chem. Phys., 2010, 133, 074510 CrossRef PubMed.
- A. Mele, C. D. Tran and S. H. D. P. Lacerda, Angew. Chem., Int. Ed., 2003, 42, 4364–4366 CrossRef CAS PubMed.
- A. Mele, G. Romano, M. Giannone, E. Ragg, G. Fronza, G. Raos and V. Marcon, Angew. Chem., Int. Ed., 2006, 45, 1123–1126 CrossRef CAS PubMed.
- S. M. Urahata and M. C. C. Ribeiro, J. Chem. Phys., 2004, 120, 1855–1863 CrossRef PubMed.
- Y. Wang and G. A. Voth, J. Am. Chem. Soc., 2005, 127, 12192–12193 CrossRef CAS PubMed.
- J. N. C. Lopes, M. F. C. Gomes and A. A. H Padua, J. Phys. Chem. B, 2006, 110, 16816–16818 CrossRef CAS PubMed.
- O. Borodin and G. D. Smith, J. Phys. Chem. B, 2006, 110, 11481–11490 CrossRef CAS PubMed.
- W. Jiang, Y. Wang and G. A. Voth, J. Phys. Chem. B, 2007, 111, 4812–4818 CrossRef CAS PubMed.
- Z. Hu and C. J. Margulis, Acc. Chem. Res., 2007, 40, 1097–1105 CrossRef CAS PubMed.
- G. Raabea and J. Köhler, J. Chem. Phys., 2008, 128, 154509 CrossRef PubMed.
- J. D. Andrade, E. S. Böes and H. Stassen, J. Phys. Chem. B, 2008, 112, 8966–8974 CrossRef PubMed.
- T. Yan, Y. Wang and C. Knox, J. Phys. Chem. B, 2010, 114, 6905–6921 CrossRef CAS PubMed.
- S. N. V. K. Aki, J. F. Brennecke and A. Samanta, Chem. Commun., 2001, 413–414 RSC.
- P. K. Mandal and A. Samanta, J. Phys. Chem. B, 2005, 109, 15172–15177 CrossRef CAS PubMed.
- C. Wakai, A. Oleinikova and H. Weingaertner, J. Phys. Chem. Lett., 2005, 109, 17028–17030 CrossRef CAS PubMed.
- F. V. Bright and G. A. Baker, J. Phys. Chem. B, 2006, 110, 5822–5823 CrossRef CAS PubMed.
- C. Wakai, A. Oleinikova and H. Weingaertner, J. Phys. Chem. B, 2006, 110, 5824 CrossRef CAS.
- A. Paul, P. K. Mandal and A. Samanta, Chem. Phys. Lett., 2005, 402, 375–379 CrossRef CAS PubMed.
- A. Paul, P. K. Mandal and A. Samanta, J. Phys. Chem. B, 2005, 109, 9148–9153 CrossRef CAS PubMed.
- P. K. Mandal, M. Sarkar and A. Samanta, J. Phys. Chem. A, 2004, 108, 9048–9053 CrossRef CAS.
- P. K. Mandal, A. Paul and A. Samanta, J. Photochem. Photobiol., A, 2006, 182, 113–120 CrossRef CAS PubMed.
- A. Samanta, J. Phys. Chem. B, 2006, 110, 13704–13716 CrossRef CAS PubMed.
- P. K. Mandal, S. Saha, R. Karmakar and A. Samanta, Curr. Sci., 2006, 90, 301–310 CAS.
- A. Samanta, J. Phys. Chem. Lett., 2010, 1, 1557–1562 CrossRef CAS.
- X.-X. Zhang, M. Liang and N. P. Ernsting, J. Phys. Chem. B, 2013, 117, 4291–4304 CrossRef CAS PubMed.
- A. Ghosh, T. Chatterjee and P. K. Mandal, Chem. Commun., 2012, 48, 6250–6252 RSC.
- A. Adhikari, D. K. Das, D. K. Sasmal and K. Bhattacharyya, J. Phys. Chem. B, 2009, 113, 3737–3743 CrossRef CAS PubMed.
- D. K. Das, A. K. Das, T. Mondal, A. K. Mandal and K. Bhattacharyya, J. Phys. Chem. B, 2010, 114, 13159–13166 CrossRef CAS PubMed.
- H. Izawa, S. Wakizono and J. Kadokawa, Chem. Commun., 2010, 46, 6359–6361 RSC.
- V. G. Rao, S. Mandal, S. Ghosh, C. Banerjee and N. Sarkar, J. Phys. Chem. B, 2012, 121, 12021–12029 CrossRef PubMed.
- A. Ghosh, T. Chatterjee, D. Roy and A. Das, J. Phys. Chem. C, 2014, 118, 5051–5057 CAS.
- Th. Förster, Ann. Phys., 1948, 2, 55–75 CrossRef PubMed.
- B. Valeur, Molecular Fluorescence Principles and Applications, Wiley-VCH Verlag GmbH, Weinheim, 2002 Search PubMed.
- J. R. Lakowicz, Principles of Fluorescence Spectroscopy, Plenum Press, New York, 3rd edn, 1999 Search PubMed.
- S. Saha and A. Samanta, J. Phys. Chem. A, 1998, 102, 7903–7912 CrossRef CAS.
- K. Santhosh, S. Patra, S. Soumya, D. C. Khara and A. Samanta, ChemPhysChem, 2011, 12, 2735–2741 CrossRef CAS PubMed.
Footnote |
| † Electronic supplementary information (ESI) available: Steady state absorption, fluorescence, time resolved fluorescence decay, time constants of fluorescence decay, Stern–Volmer plot, etc. See DOI: 10.1039/c5cp02036k |
| This journal is © the Owner Societies 2015 |

