 Open Access Article
Creative Commons Attribution 3.0 Unported Licence
Photoluminescence of a single quantum emitter in a strongly inhomogeneous chemical environment†
Anna M.
Chizhik
a,
Luigi
Tarpani
b,
Loredana
Latterini
b,
Ingo
Gregor
a,
Jörg
Enderlein
*a and
Alexey I.
Chizhik
*a
aIII. Institute of Physics, Georg August University, 37077 Göttingen, Germany. E-mail: jenderl@gwdg.de; alexey.chizhik@phys.uni-goettingen.de
bDipartimento di Chimica, Biologia e Biotecnologie, Università di Perugia and Centro di Eccellenza sui Materiali Innovativi Nanostrutturati, Via Elce di Sotto 8, 06123 Perugia, Italy
First published on 11th May 2015
Abstract
We present the results of a comprehensive photoluminescence study of defect centres in single SiO2 nanoparticles. We show that the photo-physical properties of the luminescent centres strongly resemble those of single dye molecules. However, these properties exhibit a large variability from particle to particle due to the different local chemical environment around each centre of each particle. This variability provides new insight into the complex photo-physics of single quantum emitters embedded into a random chemical environment. Moreover, a better understanding of the fundamental mechanism of the photoluminescence of defect centres in SiO2 structure is paramount for their application as white-light sources, non-toxic labels for bio-imaging, or for combining them with metallic and semiconductor nanostructures.
Introduction
One of the key parameters that determines the luminescence properties of any quantum emitter is its local chemical environment. Its inhomogeneity obliterates the distinctive features of an individual quantum emitter and broadens the distribution of its property values in an ensemble. It has been shown that individual fluorophores can exhibit a strongly heterogeneous distribution of their fluorescence quantum yield (QY) when embedded into a thin crystalline1 or amorphous2,3 dielectric matrix. In contrast to physical adsorption of fluorophores onto the surface or embedding them within a large homogeneous matrix, which is typically the case for the majority of single molecule fluorescence studies, the photo-physical properties of single quantum emitters that are chemically bound to a host matrix are poorly understood. At the same time, fundamental photo-physical aspects of interaction of a chemically bound chromophore with its local environment may provide a way towards easy and fast characterization of the surface chemistry for a wide range of applications in catalysis, photovoltaics, gas sensing, degradation of pollutants, and others.4–6A typical example of an emitter that is chemically bound to a matrix is a luminescent centre in a SiO2 nanoparticle (NP).7,8 It has been shown that the PL from SiO2 structures in the visible spectral range arises from non-bridging oxygen centres,9–11 neutral oxygen vacancies,11,12 and hydrogen-related species.13 Measurements of single SiO2 nanoparticle (NP) photoluminescence revealed a strong coupling between the electronic transition and collective vibrations in the SiO2 network due to a relaxation mechanism involving charge transfer.7,8 In particular, the PL spectra of a single SiO2 NP exhibit, besides a narrow zero-phonon line, one or even two satellite peaks at the lower-energy end, which are related to the excitation of one or two longitudinal optical phonons in the particle. Furthermore, it has been shown that like single dye molecules, SiO2 NPs possess both linear excitation and linear emission transition dipole moments.7 In contrast to luminescent centres in nanodiamonds that possess a regular crystal structure, defect centres in SiO2 NPs are embedded inside an amorphous matrix.14 This makes the defect centres a perfect model for studying photo-physical properties of individual dipole emitters within a highly inhomogeneous chemical environment. Moreover, unraveling the highly complex photo-physical properties of luminescent centres in SiO2 NPs will advance our understanding for using nanostructured SiO2 in electronics,15 drug delivery,16,17 synthesis of metallic18–21 and semiconductor22 nanoparticles with reduced toxicity, or for increasing their thermal stability and photoluminescence yield.23
Here, we present a comprehensive photoluminescence study of defect centres in single SiO2 NPs, which combines emission and excitation spectroscopy, fluorescence lifetime imaging, azimuthally polarized excitation dipole scanning, nanocavity-based QY measurements, and transmission electron microscopy. Because of the random variation of the local chemical environment around luminescent centres in SiO2 nanostructure, all the parameters of their photoluminescence are not readily accessible in ensemble measurements.
Results and discussion
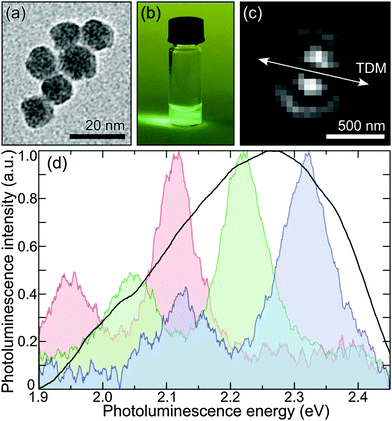
For our experiments, we synthesized SiO2 NPs of 11 ± 1 nm diameter size by a modified Stöber method in a biphasic system using an amino acid as a base catalyst.24,25Fig. 1(a) shows a transmission electron microscopy image of these NPs. For room temperature PL measurements, a droplet of SiO2 NPs in water suspension (Fig. 1(b)) was spin-coated on the surface of a glass cover slide. The particles were excited with an azimuthally polarized laser beam of 485 nm wavelength, focused into a diffraction-limited spot using a 1.49 numerical aperture objective lens. The azimuthal polarization of the excitation light allowed us to verify that every measured SiO2 NP behaves indeed as a single dipole emitter (Fig. 1(c)).26 Further details of the SiO2 NP synthesis and PL measurements can be found in the ESI.†Fig. 1(d) shows three examples of a single SiO2 particle's PL spectra together with an ensemble spectrum. The single particle spectra exhibit two narrow bands: a main emission maximum and a lower satellite at longer wavelength, which are attributed to the zero-phonon and phonon-assisted charge recombination on a defect centre, respectively.7 The striking similarity of the single particle spectra suggests that the observed PL originates from the defects with chemically identical structure, shifted by strong interaction with the inhomogeneous local environment. As a result of the individual shift of each of the single particle spectra, the two-band structure is smeared out in the ensemble measurement (black solid line in Fig. 1(d)).In total, we recorded 87 PL spectra of individual SiO2 NPs. The average full width at half-maximum (FWHM) for the zero-phonon line is 80 ± 5 meV. The separation between the zero-phonon and phonon-assisted bands for all the measured single particle spectra is 170 ± 20 meV, which can be attributed to the longitudinal optical mode of SiO2.27 As the particles were not embedded into a polymer matrix during PL measurements, the emission energy and the phonon energy are solely related to the structure of the NPs and are not affected by any external local chemical environment. Moreover, in contrast to ref. 7, here, the particles were obtained not by oxidation of silicon nanocrystals, but initially synthesized as SiO2 nanostructure. This allows us to exclusively attribute the observed PL to the defect centres in SiO2 structure.
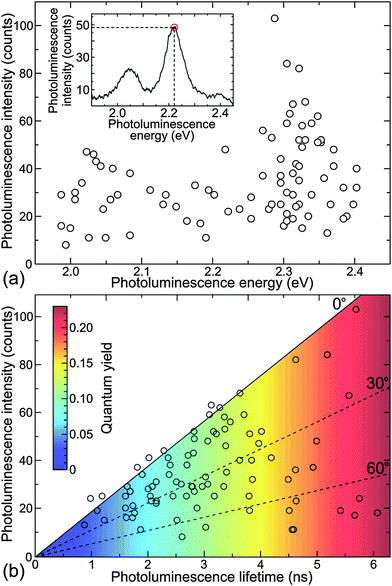
For each recorded emission spectrum, we determined the maximum emission wavelength and the peak intensity at this wavelength. Fig. 2(a) shows the resulting distribution for the measured 87 NPs. The homogenous, wavelength-unspecific dispersion of the emission intensity at each wavelength indicates the randomness of NP orientation, total extinction, and QY. The single particle spectroscopic measurements were combined with the FLIM imaging, which allowed us to determine single particle PL lifetimes. The single particle PL lifetime values were obtained by calculating an average photon arrival time, as it is typically the most reliable algorithm in the case of moderate fluorescence intensities. However, all the single particle decay curves exhibited a mono-exponential character, which confirms that they originate from a single quantum emitter. We show several typical examples of the single SiO2 NP decay curves in Fig. S7 of the ESI.† Open circles in Fig. 2(b) show the distribution of PL lifetime versus intensity for the same SiO2 NPs as had been used for measuring single particle emission spectra. The histograms of the single particle lifetime and emission energy distributions are shown in Fig. S8 of the ESI.†
At first we would like to discuss the results of single particle PL lifetime measurements. The distribution of the single particle PL lifetime versus intensity, which is shown in Fig. 2(b), allows us to estimate the QY value for all the measured SiO2 NPs. For this purpose we first measured the QY of an ensemble of NPs. The random spectral shift of single SiO2 NPs' emission makes it difficult to use standard methods for measuring their QY. However, our recently developed nanocavity-based method of QY determination measures only the cavity modulated radiative decay rate of an emitter, which makes it also applicable for complex systems such as SiO2 NPs.28,29 Placing SiO2 NPs between the metal mirrors of a nanocavity changes their emission behavior due to a cavity-modified electromagnetic field mode density.8,30,31 Because the cavity changes only the radiative rate of the embedded emitters, measuring the modulation of the PL lifetime as a function of the cavity length allows for determining an absolute value of an emitters' QY.32 Moreover, as the method is based on the cavity-induced lifetime modulation, it excludes the non-emitting (dark-state) species from the measurement. Thus, it provides the QY of only the optically active NPs.
Open circles in Fig. S6 of the ESI† show the results of PL lifetime measurements of SiO2 NPs in a droplet of water placed into a metallic nanocavity as a function of cavity length. The solid curve shows a fit of a theoretical model to the experimental data, where the free fit parameters are the QY value Φ and the free space PL lifetime τ0 (i.e., lifetime in aqueous solution without a cavity). The calculated free space lifetime value of 2.9 ns is in good agreement with the average free space lifetime measured for single SiO2 NPs (3.1 ns, see Fig. 2(b)). The QY of an emitter can be written as
 | (1) |
 | (2) |
Along with a change in the PL lifetime, the particles exhibit a strong variation of the emission intensity. The latter, however, is dependent on the particle's transition dipole orientation with respect to the excitation field polarization, and hence, cannot be used as an absolute parameter for QY estimation. The orientation-dependent brightness of the particles manifests itself by the wedge-like shape of the distribution of the experimental data in Fig. 2(b) with a clearly defined upper edge, where intensity increases linearly with the lifetime (and hence, the QY). The upper edge of the plot (solid line) corresponds to the highest excitation efficiency of a particle, when its transition dipole lies within the horizontal plane. Because single particles were excited with an azimuthally polarized laser beam, which excites all particles with horizontally dipole orientation with the same efficiency, the decrease of the PL intensity is caused by an out-of-plane inclination of the particle's transition dipole. The dashed lines indicate the transition dipole inclination angles of 30° and 60° with respect to the horizontal plane.
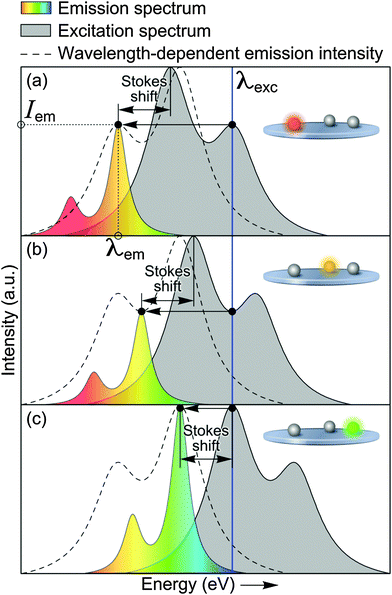
Next, we discuss the results of the spectroscopic study. By employing the random nature of the spectral shifts of the SiO2 particles' PL, we reconstruct the shape of a single particle's excitation spectrum. Fig. 3 depicts the core principle used to reconstruct the excitation spectrum from emission spectra measurements. The two core initial assumptions are (i) that the shape of the excitation spectra and (ii) the Stokes shift are the same for all the emission centres observed. These assumptions are supported by the fact that despite varying spectral shift and emission intensity, the shape of the PL spectra of all the measured SiO2 NPs does not exhibit a noticeable variation.
If the excitation spectra as well as the excitation peculiarities (orientation of an excitation electric field vector relative to dipole orientation, emission QY, etc.) would be identical for all NPs, then a plot of the emission intensity at maximum emission wavelength (Iem) versus this maximum emission wavelength (λem) for different particles will trace the excitation spectrum of a single NP. The grey shaded area in Fig. 3(a)–(c) represents the single particle excitation spectrum, which is initially unknown. The dashed line in Fig. 3(a)–(c) shows the mirror image of the excitation spectrum. The three single particle emission spectra (color shaded areas in Fig. 3) demonstrate how the emission maxima are modulated at different spectral shifts, which allows for reconstructing the mirror image of the excitation spectrum. Since the maximum of the reconstructed spectrum corresponds to the highest possible single particle emission intensity (Fig. 3(c)), the separation between the excitation energy and maximum of the reconstructed spectrum corresponds to the Stokes shift. In reality, each NP has a different orientation with respect to the exciting light polarization and QY of emission. However, these parameters are randomly distributed (Fig. 2(b)). Therefore, if the shape of the excitation spectra of all NPs is the same, then the envelope of the resulting histogram of the PL intensities versus maximum emission wavelength will be proportional to the excitation spectrum.
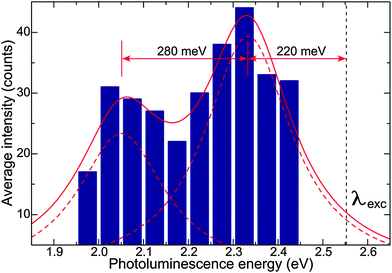
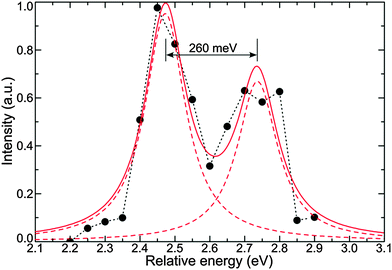
Fig. 4 shows a histogram of measured single NP PL intensity versus energy. The histogram exhibits two maxima, which can be well fitted with two Lorentzian functions (red curves in Fig. 3). This fit represents the reconstructed, horizontally inverted excitation spectrum of a single SiO2 NP, while the energy separation between its maximum and the excitation wavelength is the Stokes shift (220 meV). The relatively large Stokes shift can be possibly attributed to the strong chemical binding of the luminescence centre to the surrounding SiO2 matrix, which can potentially strengthen vibrational dissipation of energy. Despite the similarity between the shapes of the SiO2 NP emission spectra and the reconstructed excitation spectrum, the latter is broadened. In particular, the separation of the bands in the excitation spectrum is 280 meV and their FWHM is 230 meV, against 170 and 80 meV for the emission spectrum, respectively.
We attribute the observed broadening of the excitation spectrum to spectral diffusion, as commonly observed for single molecule spectra.33,34 This effect can be also related to a redistribution of defect states within a particle, which has been recently observed as a reversible flipping of the transition dipole moment, while the particle orientation itself was fixed.7 This can happen if another defect in a NP becomes energetically more favorable and then serves as the energy trap from which luminescence occurs. Similar cases of several co-existing conformations of a fluorophore have also been observed for various fluorescent proteins, which typically results in a broadening of the excitation and absorption spectra.35 Alternatively, the observed spectral broadening can be attributed to a Frank–Condon type overlap between the ground and excited state with different curvatures.
The distribution of the emission maxima partitions into two groups at roughly 2.0–2.05 and 2.3–2.35 eV, as has been observed in recent studies on luminescent defects in SiO2 nanoparticles and Si/SiO2 core–shell nanocrystals.7,41,42 There, several controversial hypotheses have been proposed. In particular, different mechanisms of the exciton recombination in a Si/SiO2 nanocrystal, or emission of a photon from different types of defects in a SiO2 structure was discussed.
To determine whether the measured distribution of the emission maxima is related to the shape of the excitation spectrum of a single defect, or to the emission from different luminescent centres, we measured excitation spectra of single particles directly, by scanning the excitation wavelength from 465 to 561 nm. The emission was recorded within a spectral range of 570–615 nm, limited by a band pass filter. The measured PL intensity was normalized by the laser power at each excitation wavelength. The measurements were combined with the FLIM images, which allowed us to determine the single particle's PL lifetime. Fig. S4 (ESI†) shows examples of the collected PL intensity and lifetime images of the same sample area, containing two optically active SiO2 NPs, where we have used different excitation wavelengths from 488 to 530 nm (2.53–2.34 eV). Whereas the emission intensity exhibits a strong dependence on excitation wavelength, the PL lifetime does not show any noticeable variation. Constant lifetime values were observed for each of the measured SiO2 NPs within the whole range of excitation wavelengths. Taking into account a broad variation of the PL lifetime values of different luminescent centres in SiO2 structure from 1 to 6 ns (see Fig. 2(b)), this suggests that the observed modulation of the PL intensity is solely related to the specific shape of the excitation spectrum, but not to the transition of the PL between different types of optically active defects.
Fig. S5 of the ESI† shows the excitation spectra of 7 single SiO2 NPs. The measured single particle excitation spectra were arbitrarily shifted so that their maxima coincided. Solid circles in Fig. 5 show the average spectrum, obtained from the excitation spectra of 7 single SiO2 NPs. By fitting the obtained curve with two Lorentzian functions we determined a band separation of 260 meV, which is in very good agreement with the value obtained using the excitation spectrum reconstruction. The ratio of the intensities for the two spectral bands is 0.7, while it was 0.6 for the reconstructed spectrum.
To verify the results of the single particle study, we measured the ensemble excitation spectrum of SiO2 NPs in aqueous solution. The PL was recorded from the narrow spectral window of 2.25 ± 0.01 eV, where the maximum emission intensity was observed (see Fig. 1(d)). The experimental curve exhibits two bands, however the lower one smeared out by averaging of the signal among the relatively large amount of particles. The Stokes shift is in excellent agreement with the value, which was obtained from the single particle study.
The obtained distribution of the maximum emission wavelength allows us to discuss the possible origin of the PL observed in the current work. According to the work of Glinka et al.,13 the PL extending from 1.8 to 2.8 eV with maximum at near 2.35 eV, which has been observed for thermally untreated SiO2 NPs with diameters from 7 to 15 nm, can be attributed to hydrogen-related species (![[triple bond, length as m-dash]](https://www.rsc.org/images/entities/char_e002.gif) Si–H and
Si–H and ![[triple bond, length as m-dash]](https://www.rsc.org/images/entities/char_e002.gif) Si–OH) on the surface of the nanoparticles. However, this model cannot explain the growth of the defect-related PL in Si/SiO2 core–shell nanoparticles after the dehydrogenation of the sample.22 The observed spectral distribution of the PL from 2.0 to 2.4 eV partly overlaps with a broad emission at 2.7 eV36,37 (FWHM = 0.8 eV), which has been attributed to neutral oxygen vacancy defects (
Si–OH) on the surface of the nanoparticles. However, this model cannot explain the growth of the defect-related PL in Si/SiO2 core–shell nanoparticles after the dehydrogenation of the sample.22 The observed spectral distribution of the PL from 2.0 to 2.4 eV partly overlaps with a broad emission at 2.7 eV36,37 (FWHM = 0.8 eV), which has been attributed to neutral oxygen vacancy defects (![[triple bond, length as m-dash]](https://www.rsc.org/images/entities/char_e002.gif) Si–Si
Si–Si![[triple bond, length as m-dash]](https://www.rsc.org/images/entities/char_e002.gif) ).11,12 On the other hand, the red side of the distribution corresponds to an isolated non-bridging oxygen atom (
).11,12 On the other hand, the red side of the distribution corresponds to an isolated non-bridging oxygen atom (![[triple bond, length as m-dash]](https://www.rsc.org/images/entities/char_e002.gif) Si–O˙) that acts as a hole-trap centre,9–11 which leads to the emission at near 1.9–2.0 eV. The overlap of the observed spectral distribution of the PL with all the three ranges, which correspond to the possible types of defects, makes it hard to exclusively attribute the observed PL to one of them. Attribution of the single particle PL to a particular type of a luminescent centre is additionally complicated by the possible presence of several types of defects within one nanoparticle, while only one of them is optically active. This is confirmed by the recent observation of the single particle transition dipole moment reorientation because of the redistribution of defect states within a particle.7 The influence of a hydrogen and oxygen atmosphere on the single SiO2 particle PL can potentially help to identify the origin of the single SiO2 particle PL.22,38,39 To obtain more detailed information on the possible attribution of the observed PL to a particular type of luminescent centre, dedicated studies will be carried out in the near future.
Si–O˙) that acts as a hole-trap centre,9–11 which leads to the emission at near 1.9–2.0 eV. The overlap of the observed spectral distribution of the PL with all the three ranges, which correspond to the possible types of defects, makes it hard to exclusively attribute the observed PL to one of them. Attribution of the single particle PL to a particular type of a luminescent centre is additionally complicated by the possible presence of several types of defects within one nanoparticle, while only one of them is optically active. This is confirmed by the recent observation of the single particle transition dipole moment reorientation because of the redistribution of defect states within a particle.7 The influence of a hydrogen and oxygen atmosphere on the single SiO2 particle PL can potentially help to identify the origin of the single SiO2 particle PL.22,38,39 To obtain more detailed information on the possible attribution of the observed PL to a particular type of luminescent centre, dedicated studies will be carried out in the near future.
Conclusions
The results of the comprehensive PL study show that the photo-physical properties of the luminescent centres in SiO2 nanoparticles partly resemble those of typical single dye molecules, for instance, linear transition dipole, symmetric emission and excitation spectra. However, a highly inhomogeneous local chemical environment around the centres results in a broad and random variation of the single NP emission and excitation spectra, PL lifetime, and QY. In particular, the PL lifetime and QY of different NPs can vary by a factor of 6, while both the emission and excitation spectra of different luminescent centres can exhibit a shift up to 500 meV. It is remarkable that despite a broad variation of the shift in both of the emission and excitation single particle spectra, the shape of the spectrum remains constant. The obtained results show the striking difference between the cases, when the photo-physical properties of a single quantum emitter are tailored by the local chemical environment or by the mode density of the electromagnetic field.31 In the latter case, the change in the field mode structure results in the redistribution of the emission spectrum and modification of the radiative rate of a chromophore, while the non-radiative rate remains constant.40 These findings provide new insight into the complex photo-physical properties of a single quantum emitter embedded within a highly inhomogeneous chemical environment. The presented results are of particular importance for designing Si/SiO2 nanostructures with controllable resonance energy transfer between the quantum confined exciton in the crystalline core and luminescent centres in the silica shell.22,41,42Acknowledgements
Funding by the German Science Foundation (DFG, SFB 937, project A5) is gratefully acknowledged. A.M.C. thanks the Dorothea Schlözer Fellowship Programme for financial support. L.L. thanks the support of the University of Perugia. L.T. acknowledges the support of Regione Umbria under the framework POR-FSE 2007-2013. We thank the reviewers of the manuscript for enhancing the quality of this work.Notes and references
- B. C. Buchler, T. Kalkbrenner, C. Hettich and V. Sandoghdar, Phys. Rev. Lett., 2005, 95, 063003 CrossRef CAS.
- A. I. Chizhik, A. M. Chizhik, D. Khoptyar, S. Bär, A. J. Meixner and J. Enderlein, Nano Lett., 2011, 11, 1700–1703 CrossRef CAS PubMed.
- Y. Cesa, C. Blum, J. M. van den Broek, A. P. Mosk, W. L. Vos and V. Subramaniam, Phys. Chem. Chem. Phys., 2009, 11, 2525–2531 RSC.
- C. Lun Pang, R. Lindsay and G. Thornton, Chem. Soc. Rev., 2008, 37, 2328–2353 RSC.
- M. Gratzel, Nature, 2001, 414, 338–344 CrossRef CAS PubMed.
- R. Selvaggi, L. Tarpani, A. Santuari, S. Giovagnoli and L. Latterini, Appl. Catal., B, 2015, 168–169, 363–369 CrossRef CAS PubMed.
- A. M. Chizhik, A. I. Chizhik, R. Gutbrod, A. J. Meixner, T. Schmidt, J. Sommerfeld and F. Huisken, Nano Lett., 2009, 9, 3239–3244 CrossRef CAS PubMed.
- A. I. Chizhik, A. M. Chizhik, A. M. Kern, T. Schmidt, K. Potrick, F. Huisken and A. J. Meixner, Phys. Rev. Lett., 2012, 109, 223902 CrossRef.
- L. Skuja, J. Non-Cryst. Solids, 1998, 239, 16–48 CrossRef CAS.
- S. Munekuni, T. Yamanaka, Y. Shimogaichi, R. Tohmon, Y. Ohki, K. Nagasawa and Y. Hama, J. Appl. Phys., 1990, 68, 1212–1217 CrossRef CAS PubMed.
- E. P. O'Reilly and J. Robertson, Phys. Rev. B: Condens. Matter Mater. Phys., 1983, 27, 3780–3795 CrossRef.
- R. Tohmon, Y. Shimogaichi, H. Mizuno, Y. Ohki, K. Nagasawa and Y. Hama, Phys. Rev. Lett., 1989, 62, 1388–1391 CrossRef CAS.
- Y. D. Glinka, S.-H. Lin and Y.-T. Chen, Appl. Phys. Lett., 1999, 75, 778–780 CrossRef CAS PubMed.
- A. Gruber, A. Dräbenstedt, C. Tietz, L. Fleury, J. Wrachtrup and C. v. Borczyskowski, Science, 1997, 276, 2012–2014 CrossRef CAS.
- D. A. Muller, T. Sorsch, S. Moccio, F. H. Baumann, K. Evans-Lutterodt and G. Timp, Nature, 1999, 399, 758–761 CrossRef CAS.
- M. A. Malfatti, H. A. Palko, E. A. Kuhn and K. W. Turteltaub, Nano Lett., 2012, 12, 5532–5538 CrossRef CAS PubMed.
- T. M. Shaffer, M. A. Wall, S. Harmsen, V. A. Longo, C. M. Drain, M. F. Kircher and J. Grimm, Nano Lett., 2015, 15, 864–868 CrossRef CAS PubMed.
- E. Prodan, C. Radloff, N. J. Halas and P. Nordlander, Science, 2003, 302, 419–422 CrossRef CAS PubMed.
- L. Latterini and L. Tarpani, J. Phys. Chem. C, 2011, 115, 21098–21104 CAS.
- E. Lukianova-Hleb, Y. Hu, L. Latterini, L. Tarpani, S. Lee, R. A. Drezek, J. H. Hafner and D. O. Lapotko, ACS Nano, 2010, 4, 2109–2123 CrossRef CAS PubMed.
- L. Tarpani and L. Latterini, Photochem. Photobiol. Sci., 2014, 13, 884–890 CAS.
- S. Godefroo, M. Hayne, M. Jivanescu, A. Stesmans, M. Zacharias, O. I. Lebedev, G. Van Tendeloo and V. V. Moshchalkov, Nat. Nanotechnol., 2008, 3, 174–178 CrossRef CAS PubMed.
- N. J. Halas, ACS Nano, 2008, 2, 179–183 CrossRef CAS PubMed.
- T. Yokoi, Y. Sakamoto, O. Terasaki, Y. Kubota, T. Okubo and T. Tatsumi, J. Am. Chem. Soc., 2006, 128, 13664–13665 CrossRef CAS PubMed.
- K. D. Hartlen, A. P. T. Athanasopoulos and V. Kitaev, Langmuir, 2008, 24, 1714–1720 CrossRef CAS PubMed.
- A. I. Chizhik, A. M. Chizhik, D. Khoptyar, S. Bär and A. J. Meixner, Nano Lett., 2011, 11, 1131–1135 CrossRef CAS PubMed.
- C. T. Kirk, Phys. Rev. B: Condens. Matter Mater. Phys., 1988, 38, 1255–1273 CrossRef CAS.
- A. I. Chizhik, I. Gregor and J. Enderlein, Nano Lett., 2013, 13, 1348–1351 CrossRef CAS PubMed.
- N. Karedla, J. Enderlein, I. Gregor and A. I. Chizhik, J. Phys. Chem. Lett., 2014, 5, 1198–1202 CrossRef CAS.
- A. I. Chizhik, I. Gregor, F. Schleifenbaum, C. B. Müller, C. Röling, A. J. Meixner and J. Enderlein, Phys. Rev. Lett., 2012, 108, 163002 CrossRef.
- P. Goy, J. M. Raimond, M. Gross and S. Haroche, Phys. Rev. Lett., 1983, 50, 1903–1906 CrossRef CAS.
- A. I. Chizhik, I. Gregor, B. Ernst and J. Enderlein, ChemPhysChem, 2013, 14, 505–513 CrossRef CAS PubMed.
- W. P. Ambrose and W. E. Moerner, Nature, 1991, 349, 225–227 CrossRef CAS PubMed.
- H. P. Lu and X. S. Xie, Nature, 1997, 385, 143–146 CrossRef CAS PubMed.
- R. E. Campbell, O. Tour, A. E. Palmer, P. A. Steinbach, G. S. Baird, D. A. Zacharias and R. Y. Tsien, Proc. Natl. Acad. Sci. U. S. A., 2002, 99, 7877–7882 CrossRef CAS PubMed.
- L. Rebohle, J. von Borany, H. Fröb and W. Skorupa, Appl. Phys. B: Lasers Opt., 2000, 71, 131–151 CrossRef CAS.
- G. Vaccaro, S. Agnello, G. Buscarino, M. Cannas and L. Vaccaro, J. Non-Cryst. Solids, 2011, 357, 1941–1944 CrossRef CAS PubMed.
- W. G. J. H. M. van Sark, P. L. T. M. Frederix, D. J. Van den Heuvel, H. C. Gerritsen, A. A. Bol, J. N. J. van Lingen, C. de Mello Donegá and A. Meijerink, J. Phys. Chem. B, 2001, 105, 8182–8284 CrossRef.
- W. G. J. H. M. van Sark, P. L. T. M. Frederix, A. A. Bol, H. C. Gerritsen and A. Meijerink, ChemPhysChem, 2002, 3, 871–879 CrossRef CAS.
- A. Chizhik, F. Schleifenbaum, R. Gutbrod, A. Chizhik, D. Khoptyar, A. J. Meixner and J. Enderlein, Phys. Rev. Lett., 2009, 102, 073002 CrossRef.
- T. Schmidt, A. I. Chizhik, A. M. Chizhik, K. Potrick, A. J. Meixner and F. Huisken, Phys. Rev. B: Condens. Matter Mater. Phys., 2012, 86, 125302 CrossRef.
- J. Martin, F. Cichos, F. Huisken and C. von Borczyskowski, Nano Lett., 2008, 8, 656–660 CrossRef CAS PubMed.
Footnote |
| † Electronic supplementary information (ESI) available: Synthesis of silica nanoparticles and size distribution analysis, photoluminescence measurements, generation of an azimuthally polarized laser beam, photoluminescence lifetime imaging of single SiO2 nanoparticles, the full series of single SiO2 NP excitation spectra, the quantum yield of SiO2 NPs, photoluminescence decay curves of individual SiO2 nanoparticles, the histograms of the single particle lifetime and emission energy distributions, and the ensemble excitation spectrum of SiO2 nanoparticles. See DOI: 10.1039/c5cp01371b |
| This journal is © the Owner Societies 2015 |

