
 Open Access Article
 This Open Access Article is licensed under a
 Creative Commons Attribution 3.0 Unported Licence
Towards an ab initio description of the optical spectra of light-harvesting antennae: application to the CP29 complex of photosystem II†
Sandro
Jurinovich
a,
Lucas
Viani
a,
Ingrid G.
Prandi
a,
Thomas
Renger
b and
Benedetta
Mennucci
*a
aDipartimento di Chimica e Chimica Industriale, University of Pisa, Via G. Moruzzi 3, I-56124 Pisa, Italy. E-mail: benedetta.mennucci@unipi.it
bInstitut für Theoretische Physik, Johannes Kepler Universität Linz, Altenberger Str. 69, 4040 Linz, Austria
First published on 1st April 2015
Abstract
Light-harvesting pigment–protein complexes (PPC) represent the fundamental units through which the photosynthetic organisms absorb sunlight and funnel the energy to the reaction centre for carrying out the primary energy conversion reactions of photosynthesis. Here we apply a multiscale computational strategy to a specific PPC present in the photosystem II of plants and algae (CP29) to investigate in what detail should the environment effects due to protein and membrane/solvent be included for an accurate description of optical spectra. We find that a refinement of the crystal structure is needed before any meaningful quantum chemical calculations of pigment transition energies can be performed. For this purpose we apply classical molecular dynamics simulations of the PPC within its natural environment and we perform ab initio computations of the exciton Hamiltonian of the complex, including the environment either implicitly by the polarizable continuum model (PCM) or explicitly using the polarizable QM/MM methodology (MMPol). However, PCM essentially leads to an unspecific redshift of all transition energies, and MMPol is able to reveal site-specific changes in the optical properties of the pigments. Based on the latter and the excitonic couplings obtained within a polarizable QM/MM methodology, optical spectra are calculated, which are in good qualitative agreement with experimental data. A weakness of the approach is however found in the overestimation of the fluctuations of the excitonic parameters of the pigments along the MD trajectory. An explanation for such a finding in terms of the limits of the force fields commonly used for protein cofactors is presented and discussed.
1. Introduction
Sunlight is the main source of energy for most of the living organisms on earth, and the capability of converting its energy into a useful chemical form has allowed the first photosynthetic bacteria to survive in the initially anaerobic atmosphere of earth, and in the next billion years to evolve into cyano, red, brown, green bacteria, algae, plants and higher-plants.1 In the course of this long evolutionary development, different apparatusas for carrying out photosynthesis have been adopted by nature. For the oxygenic process two photosystems, PSI and PSII,2,3 are responsible for the catalysis of the photosynthetic electron transfer taking place in their reaction centres, assisted by secondary complexes4–6 acting as efficient light-harvesting and photo-protecting centres. Nowadays, the roles of the individual complexes composing the photosynthetic apparatus are being elucidated primarily due to the improvements in X-ray diffraction techniques which have provided the atomic resolution required to accurately resolve their structural properties.7–11 As a result, a more detailed analysis of the light-harvesting and excitation transfer dynamics has been made possible by combining the structural information with mutation analysis,12–15 2D electronic spectroscopy,16–20 and theoretical studies.21–24 In particular, these latter have proven to be an important tool in predicting site energy landscapes, excitonic couplings, environment effects, and energy transfer rates.21,23–26 In most cases, however, the predictive power of these theoretical studies is still hampered by the fact of being limited to the crystallographic structures, making the investigation largely susceptible to the quality of the structural conformations of the cofactors and the environment, which may be far from the real ones under ambient conditions.Different strategies exist to solve this problem. The simplest solution is given by an electrostatic treatment using quantum chemical calculations of excited and ground states of geometry optimized chromophores in vacuo to derive atomic partial charges used afterwards in electrostatic computations including the whole pigment–protein complex (for a recent review see ref. 27). Since the electrostatic calculations are not sensitive to slight distortions of the cofactors such an approach can provide a qualitative picture of the influence of the environment on site energies, excitonic couplings and spectral densities. However, important contributions, such as the influence of environmentally induced changes of the conformations of the chromophores on their electronic structure and short-range effects on site energies and excitonic couplings are missing. An alternative strategy considering these effects, is given by a quantum chemical geometry optimization of the whole pigment–protein complex, as used by Yin et al.28 to calculate the exciton Hamiltonian of PS I core complexes. However, also in the latter approach there is room for improvement (for a comparison of the optical spectra of PSI obtained using the two approaches, see ref. 26).
In the present work we use an approach of intermediate complexity29–31 and apply it to the CP29 complex, one of the three minor chlorophyll a/b-binding proteins associated with PSII in plants and algae. CP29 is a monomeric system containing nine chlorophylls a (Chl a), four chlorophylls b (Chl b), and three carotenoids. These 13 Chls densely packed within the protein matrix embedded in the lipid bilayer are responsible for the light-harvesting process through their low energy π–π* transitions (known as Qy) (see Fig. 1).
 | ||
| Fig. 1 (a) Molecular structure of Chl a and b. (b) Simplified model of the crystal structure of CP29 with only the Chl molecules observed perpendicularly to the thylakoid membrane plane. Chl structures are represented by the central Mg atom and the two nitrogen atoms along the direction of Qy transition dipole. (c) Side view parallel to the membrane plane of the computational system; the dimensions of the lipid membrane and solvation water layers are also reported. | ||
We first explore the impact of different polarizable QM/classical strategies in the treatment of the crystallographic structures considering implicit and explicit environment models for the prediction of the excitonic parameters. The results are successively compared to those obtained combining the same QM/classical strategies with a statistical analysis based on a molecular dynamics (MD) simulation of the trans-membrane conditions. The excitonic parameters obtained from the static crystallographic structure and those averaged from the MD configurations are comparatively used to reproduce the experimental steady state optical spectra. The comparison is finally used to achieve a molecular-level interpretation of the nature of the excitonic states of CP29, to dissect the role of the fluctuations of geometrical parameters internal to the individual pigments as well as to the external environment and to quantify how the latter are reflected in the electrostatic and polarization effects due to the environment.
2. Methods
2.1 Structure and MD simulation
The high-resolution X-ray structure of light-harvesting CP29 from spinach (pdb entry: 3PL9, res. 2.80 Å) recently resolved by Pan et al.9 was used. In this structure, the first 1–87 amino acid residues have been lost during the purification procedure, so the first residue (Gly88) has been capped with an acetyl terminal group (ACE). Only the six water molecules which are involved in the axial ligation of Chls have been retained. Specifically, water molecules are axial ligands of Chls a604, b606, b607, and b608, the axial ligand of Chl b606 forms hydrogen bonds with the side chain carboxyl group of Glu 151 and with another water molecule and the axial ligand of Chl b608 forms a hydrogen bond with another water molecule. The protein protonation pattern established at 210 K by Müh et al.21 has been used. All the titratable residues are in their standard protonation states, except for Glu128, Glu151 and His235, which are protonated. All the other histidine residues are in ε-configuration, except for His 99, 200 and 229 that are in the δ-configuration to allow the interaction with the Mg atom of the pigments. We note that the ratio Rab = 2.25 between Chl a and Chl b resulting from the assignment of the crystal structure contrasts with the Rab = 2.3 to 3.4 reported in the literature.32–37 From the comparison of quantum chemical/electrostatic calculations and experiments,21 it was found that the assignment of chlorophylls in the crystal structure is not in contradiction to the experimental data, but it cannot be excluded that up to one Chl b is missing in the solubilized complex. As a possible candidate Chl b614 was discussed: in fact being located at the C-terminus and strongly solvent exposed, this chlorophyll might get lost more easily during the isolation procedure.The positions of the hydrogen atoms have been minimized using the Amber12 suite of programs.38 The ff99SB force-field39 has been used for the protein, lipid1140 for the lipids and ad hoc parameters for the cofactors.41,42 In more detail, for Chl a the set of parameters reported in ref. 42 was used while for Chl b the missing parameters were taken from the generalized AMBER force field.43 For the three carotenoids (lutein, violaxanthin and neoxanthin) a new set of force field parameters was determined following a similar procedure to that used in ref. 41 for bacteriochlorophyll. To be consistent with previous structural analysis of the crystalline structure,21 in all calculations using such a structure we have included the G3P molecule identified as the axial ligand for the two facing Chl a611 and a615.
To reproduce the in vivo architecture, the CP29 complex was embedded into a double layer phospholipidic membrane constructed with 450 DOPC (1,2-dioleoyl-sn-glycero-3-phosphatidylcholine) lipid molecules (225 lipids per layer) and a solvation water layer generated with 30 Å thickness (see Fig. 1C) using the CHARMM-GUI44 website tool. Three potassium ions have been added to neutralize the system CP29 charged-3. The MD simulation was performed in three main steps: (I) a minimization was performed to relax the system and avoid close contacts; (II) the system was slowly heated up to 300 K in a 100 ps simulation using positional restraints with a harmonic potential of 10.0 kcal mol−2 Å−2 to constrain lipids, protein and cofactors positions; (III) the constraints were removed and a 80 ns simulation was performed in a NPT ensemble with an integration step set of 2 fs. Temperature and pressure were regulated using the Langevin thermostat and the anisotropic barostat as implemented in Amber12 was used. Water molecules were treated using the TIP3P model, and the O–H distances and H–O–H angle, as well as the other bonds involving hydrogen in the system, were constrained using the SHAKE algorithm.45 Periodic boundary conditions were applied together with the Particle Mesh Ewald approach to deal with long-range electrostatics and a non-bonded cutoff equal to 10 Å.
2.2 Quantum chemical calculations
QM calculations were performed over 400 uncorrelated configurations extracted every 50 ps from the last 20 ns of the trajectory. All the QM calculations have been performed using a locally modified version of the Gaussian0946 package. Transition properties of the pigments have been computed using a TD-DFT scheme with the hybrid exchange correlation functional CAM-B3LYP47 and 6-31G(d) basis set. Only Qy excitations have been considered in the analysis. In order to reduce the computational cost we worked with a truncated QM model for the chlorophylls in which only the atoms of the ring have been described at the QM level. The tail has been cut at the C1–C2 bond and the dangling bond has been saturated with a hydrogen atom (the tail atoms still remain MMPol sites). QM calculations have been performed both in vacuo (VAC) and including the environmental effects using implicit and explicit approaches by considering the polarizable continuum model (PCM)48 and the polarizable QM/MM methodology (MMPol),29,30 respectively. In the QM/MMPol description, all the protein atoms and membrane lipids and water within 45 Å of each QM site were included in the MM region. A radius of 12 Å was used for the polarization cutoff.In addition to configurations extracted from MD, the crystalline structure has also been used. In the latter case all the atoms in the system (except for the QM atoms) were included in the MMPol region. The PCM calculations were performed using the united atom cavity built using the g03defaults parameters; effective dielectric parameters have been employed to represent the protein/lipid/water environment (ε = 15.0, εopt = 2.0).49 MMPol atoms were described using the recent charge and polarizability parameters derived by Wang and co-workers in the context of the Amber force field.50,51 In particular, the parameter set based on Thole's linear smeared dipole field tensor was used, in which 1–2 and 1–3 interactions are excluded.
Schematic representations of the different QM/classical approaches used in this work are reported in Fig. 2.
 | ||
| Fig. 2 Schematic representation of the different environmental models used: (a) QM/PCM; (b) QM/MMPol in the case of crystal structure, all non-QM atoms are considered as polarizable sites; (c) QM/MMPol in the case of a MD snapshot, a cut-off of 12 Å around QM atoms is applied for MM polarizability and a larger cut-off of 45 Å is set for MM charges. | ||
The excitonic couplings between pigments were computed using their TD-DFT transition densities ![[small rho, Greek, tilde]](https://www.rsc.org/images/entities/i_char_e0e4.gif) j(r′),52–54 namely:
j(r′),52–54 namely:
 | (1) |
 | (2) |
2.3 Excitonic calculations and steady state spectra
The interactions among pigments determine a delocalization of the excited states over different sites. The resulting excitonic states can be determined by diagonalizing the exciton Hamiltonian: | (3) |
 | (4) |
Once solved, the excitonic Hamiltonian (3), the linear absorbance, linear dichroism (LD) and circular dichroism (CD) spectra are obtained from eqn (5)–(7) respectively:
 | (5) |
 | (6) |
 | (7) |
![[small mu, Greek, vector]](https://www.rsc.org/images/entities/b_i_char_e0e9.gif) k is the transition dipole moment between the ground state and the kth exciton state, θk is its angle with respect to the membrane normal, and
k is the transition dipole moment between the ground state and the kth exciton state, θk is its angle with respect to the membrane normal, and  is the rotational strength of the exciton transition containing the local transition dipole moments
 ![[small mu, Greek, vector]](https://www.rsc.org/images/entities/i_char_e0e9.gif) m of pigments m = i,j that are centered at positions
m of pigments m = i,j that are centered at positions ![[R with combining right harpoon above (vector)]](https://www.rsc.org/images/entities/i_char_0052_20d1.gif) i and j, respectively. The local transition dipole moments were assumed to be oriented along the NB–ND axis (in pdb nomenclature) of the Chls. Recent experimental estimates for the angle β between the Qy transition dipole moment of Chl a and the NB-ND axis are inferred from time-resolved anisotropy measurements and from femtosecond polarization resolved visible pump-infrared probe spectroscopy range from β = −12° to β = 4.5° (where a positive angle refers to a rotation in the direction of the 131 ketogroup).56,57 The spectra, in particular the linear dichroism spectrum, depend somewhat on the angle β. The variation of the simulated spectra with respect to β could in principle be used together with experiments in order to decide which angle is most realistic. From our analysis (Fig. S1, ESI†) the 0–10° angles seem to give a better agreement but the inaccuracy of the other parameters also surely plays a role and thus a more detailed study should be carried out in order to have a definitive answer.
i and j, respectively. The local transition dipole moments were assumed to be oriented along the NB–ND axis (in pdb nomenclature) of the Chls. Recent experimental estimates for the angle β between the Qy transition dipole moment of Chl a and the NB-ND axis are inferred from time-resolved anisotropy measurements and from femtosecond polarization resolved visible pump-infrared probe spectroscopy range from β = −12° to β = 4.5° (where a positive angle refers to a rotation in the direction of the 131 ketogroup).56,57 The spectra, in particular the linear dichroism spectrum, depend somewhat on the angle β. The variation of the simulated spectra with respect to β could in principle be used together with experiments in order to decide which angle is most realistic. From our analysis (Fig. S1, ESI†) the 0–10° angles seem to give a better agreement but the inaccuracy of the other parameters also surely plays a role and thus a more detailed study should be carried out in order to have a definitive answer.
The ratio of magnitudes of transition dipoles of Chl a and Chl b of 5.47/4.61 was estimated, based on the analysis of the dipole strength of these pigments in different solvents,58 assuming an average refractive index of 2. The lineshape function Dk(ω) takes into account vibrational sidebands and lifetime-broadening due to exciton relaxation. It reads59
 | (8) |
 | (9) |
 .
.
The lifetime broadening is described by the dephasing time τk in eqn (8), which is obtained from the Redfield relaxation constants kk→l as  , where
| kk→l = 2πγklωkl2{J(ωkl)(1 + n(ωkl)) + J(ωlk)n(ωlk)} | (10) |
![[small omega, Greek, tilde]](https://www.rsc.org/images/entities/i_char_e10f.gif) k in the lineshape function in eqn (8) is obtained from the exciton energy εk and takes into account a renormalization of this energy by the exciton-vibrational coupling:
k in the lineshape function in eqn (8) is obtained from the exciton energy εk and takes into account a renormalization of this energy by the exciton-vibrational coupling: | (11) |
We use the spectral density J(ω) = SJ0(ω) that contains the normalized function  with the parameters s1 = 0.8, s2 = 0.5, ℏω1 = 0.069 meV, ℏω2 = 0.24 meV, as extracted from the fluorescence line narrowing spectra of B777-complexes.59
Although the B777-complex contains a bacteriochlorophyll pigment, this spectral density has been successfully applied to a large number of pigment–protein complexes, including those containing Chl a and/or Chl b.21,22,26,60,61 Note that this spectral density does not contain high-frequency intramolecular modes of the pigments. The latter may be obtained, e.g., from the fluorescence line narrowing spectra.62,63 Since the respective Huang–Rhys factors are very small, it can be expected that exciton delocalization involving excited vibronic states is different from that of 0–0 transitions. To include dynamic localization effects of exciton-vibrational states would require a non-perturbative description. Alternatively, an implicit treatment might be possible.21 At the present level of site energy calculations we consider such a refinement of the theory of optical spectra as premature.
The Huang–Rhys factor S was obtained from a fit of the temperature dependence of the linear spectra as S = 0.5.22 Finally, we note that the homogeneous spectra described above are averaged with respect to a static disorder in site energies, assuming a Gaussian distribution function of the same width Δinh = 130 cm−1 (FWHM), as obtained from a fit of the spectra.
Since the selected level of calculation (TDCAM-B3LYP) overestimates the magnitude of the transition dipole moments and the transition energies with respect to the experimental values,58 two global adjustments of the calculated excitonic parameters have been introduced: (1) the site energies (e.g. the diagonal elements of the exciton Hamiltonian) were red shifted by the same amount (980 cm−1) and (2) the couplings have been rescaled by the same factor obtained assuming a linear dependence of the couplings on the square of the transition dipole moments. Namely, the scaling factor is obtained as the ratio:
 | (12) |
3. Simulation of excitonic parameters
For the sake of clarity we first report a detailed investigation on site energies and couplings by comparing different models either including or neglecting environment effects.3.1 Site energies
Within the protein, further geometrical and electronic distortions of each pigment may occur due to its confinement in a specific binding pocket of the protein and the electrostatic interactions of the pigment with its local environments. These structural and electrostatic effects are coupled but, in the calculations, they can be assessed separately by artificially “switching-off” one of the two. In the following we apply such a strategy by first focusing on the structural effects only (by exploring the site energies the pigments “in vacuo”, i.e. neglecting the environment), and successively by adding the environmental effects through different QM/classical models.
Fig. 3 reports the site energies computed in vacuo using the crystalline structure (VAC@CRY) and those averaged over the MD configurations (VAC@MD).
 | ||
| Fig. 3 Site energies of Chls computed at cam-B3LYP/6-31G(d) level of theory. Data are referred to calculations on the crystalline structure (@CRY, lines with symbols) and averaged on MD configurations (@MD, lines without symbols), and with different environment descriptions. | ||
As expected, the two sets of Chls (a and b) form two distinct groups with an average difference of about 0.06 eV for both models. This difference is in good agreement with that obtained experimentally, 0.07 eV for the solvent-free estimation. This comparison shows that the “intrinsic” error of the QM level here used affects in the same way as the two types of chlorophylls. Thanks to that, in the following simulation of the spectra, an equal shift to the red will be used for all the site energies without the need for introducing different corrections for Chl a and Chl b.
The energy spread in the VAC@CRY data is larger than in the VAC@MD case, indicating that the distortions of the pigment's macrocycles found in the crystal are reduced when an average picture as obtained from MD is used, thus suggesting that the statistical fluctuations of the environment act to “homogenise” the pigment structures.
The interaction between pigments and the environment however can explicitly modulate the site energies, thus tuning the energy landscape. Here two alternative models have been tested for describing these environment effects, namely the continuum (PCM) and the explicit (MMPol) models. In PCM the Chl is embedded into a molecule-shaped cavity surrounded by a dielectric medium described by an effective dielectric constant (see Section 1.2 and Fig. 2a). In MMPol the protein/membrane/solvent atoms are described as point charges and induced dipoles (MMPol) allowing the inclusion of both specific interactions and the anisotropy of the environment. The site energies calculated with the two models on the crystal structure (CRY) are reported in Fig. 3.
As expected for a π–π* transition, both environment models lead to a red-shift of all the site energies. When using a PCM description, a similar shift is found for all Chls of each group, namely ca. 0.05 eV for Chl a and 0.04 eV for Chl b. When MMPol is used in combination with the crystal structure (MMPol@CRY) instead, a larger red-shift is found for the a604 and b608 pigments. At first glance this result looks like site specific changes that might be relevant for the functioning of the complex. However, by comparing the MMPol@CRY with the MMPol@MD results, obtained by applying the MMPol methodology on the MD structures it becomes obvious that those energy sinks are artificial (see the ESI† for a more detailed explanation). The MD simulations seem to suitably release the distortions of the crystal structure and allow obtaining more realistic site energies (as will be proven further below by comparing the resulting optical spectra with experimental data). Therefore, in the following we will concentrate on the analysis of the MMPol@MD results.
ΔErel(i) = (E(VAC)i − E(MMPol)i) − Δ![[E with combining overline]](https://www.rsc.org/images/entities/i_char_0045_0305.gif) rel (Chl a or b) rel (Chl a or b) | (13) |
 | ||
| Fig. 4 Upper panel: representation of the cluster of chlorophylls colored according to their site energies (from lowest, red, to highest, blue). Lower panel: relative energy differences (in eV) between MMPol@MD and VAC@MD site energies (see eqn (13)). | ||
According to this definition, positive ΔErel values indicate a small environmental effect (i.e. smaller than the average) while negative values indicate large effects.
The results reported in Fig. 4 show that pigment a609 shows the largest stabilization due to the environment while a615 and b606 are the most blue-shifted pigments. The large shift observed for a609 can be explained in terms of the effects due the axially coordinated Glu159.
Moving to the distributions of the site energies, we note that MMPol@MD and MMPol@VAC show similar standard deviations, namely 0.066 eV and 0.060 eV, respectively (see Fig. S2–S14, ESI†). The similar deviations obtained with and without the environment indicate that the main origin of site energy fluctuations along the MD trajectory is the geometrical distortion of the pigment structure, which masks other contributions like the environment electrostatics and polarization. The amplitudes of these distortions are overestimated as inferred below from the analysis of the optical spectra. The reasons for these too large geometrical fluctuations of the pigment structure are most probably related to the use of classical force fields which have not been optimized to correctly reproduce the temperature dependent amplitude of these oscillations.65
3.2 Excitonic couplings
In Fig. 5 we report a schematic representation of the QM/MMPol couplings for the different Chl pairs averaged over the MD configurations (see eqn (1) and (2)). | ||
| Fig. 5 Schematic representation of the average MMPol@MD couplings. The thickness of the lines connecting the pigments are proportional to the coupling values. Dotted lines are referred to couplings between pigments facing on different side of the thylakoid membrane. Couplings <10 cm−1 are not reported. | ||
The analysis of Fig. 5 reveals that the Chls at the stromal layer are connected by a complex network of couplings with the most intense ones (on the order of 150–180 cm−1) being in the Chl pairs a611–a612, a611–a615 and a603–a609. In the lumenal layer, pigments form three distinct domains: a trimer (a604–b606–b607) with a strong coupled pair a604–b606 (120 cm−1), a medium coupled pair, a604–b607 (35 cm−1), and a weakly coupled (20 cm−1) heterodimer, a613–b614. The pigments at the stromal and lumen regions are not strongly coupled, with the largest value found in the heterotrimer a604–b606–b607. This picture is in agreement with previous theoretical studies on CP29 where the excitonic couplings were computed using the transition charges from the electrostatic potential method (TrEsp),43 and the Poisson-TrEsp method.20 However, the absolute values estimated in this work are almost twice as large. This discrepancy can be mainly ascribed to the magnitude of the CAM-B3LYP transition dipole moments that are larger than the experimental values by ca. 35% (see Table S1, ESI†).
In the CP29, pigment pairs can exhibit small inter-pigment distances (around 10 Å, see Table S3, ESI†); we thus expect that the point-dipole-approximation (PDA) of the couplings will fail, especially in pairs of close by Chls. This expectation is indeed confirmed in the left panel of Fig. 6, which reports the inter-pigment distance dependence of the ratio between the PDA and the Coulomb component of the QM coupling (see eqn (1)).
 | ||
| Fig. 6 Upper panel: ratio between MMPol@MD couplings computed with point-dipole approximation and coulomb coupling computed with QM method. Lower panel: effective dielectric constant computed for MMPol@MD (filled black circle); the dotted grey line represents the average εeff. | ||
For large distances the PDA and the QM approach predict similar values, whereas at distances shorter than 15 Å we observe large deviations using PDA couplings that are even two times larger than the QM ones.
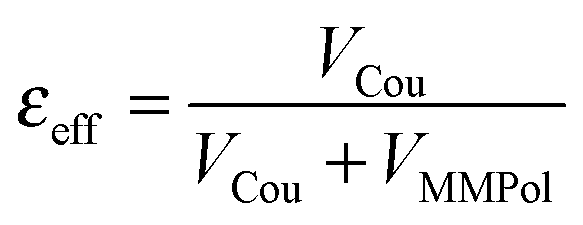
A further interesting analysis of the QM/MMPol results is obtained in terms of the screening effect of the environment on the different pairs. To quantify it, we introduce a hypothetical effective dielectric constant (εeff), which accounts for the “local” polarity felt by the single pairs. Following the same strategy as that commonly used in the PDA to account for the solvent screening εeff can be defined as the ratio between the Coulomb component of the coupling (eqn (1)) and the total value (i.e. including the MMPol term reported in eqn (2)), namely:
 | (14) |
 | (15) |
4. Simulation of optical spectra
The site energies and couplings presented and discussed in the previous section are used here to simulate the optical spectra and compare with experiments. This analysis is reported for both MMPol@CRY and MMPol@MD sets of data to explicitly show the sensitivity of the spectra to the excitonic parameters. The full excitonic Hamiltonian for MMPol@CRY and MMPol@MD data are reported in Tables S4 and S5 (ESI†), respectively.The absorbance, linear and circular dichroism spectra obtained from the two descriptions are reported in Fig. 7 and 8 and are compared with experimental ones at different temperatures.
 | ||
| Fig. 7 Comparison of optical spectra calculated with the MMPol@CRY exciton Hamiltonian (Table S4, ESI†) (blue solid lines) with experimental data (ref. 32, dashed lines). In the left panel the linear absorbance spectra at 13 K (upper part) and at 298 K (lower part) are shown. The middle panel contains the linear dichroism spectra at 77 K (upper part) and 298 K (lower part) and the right panel the circular dichroism spectra at 77 K (upper part) and 298 K (lower part). | ||
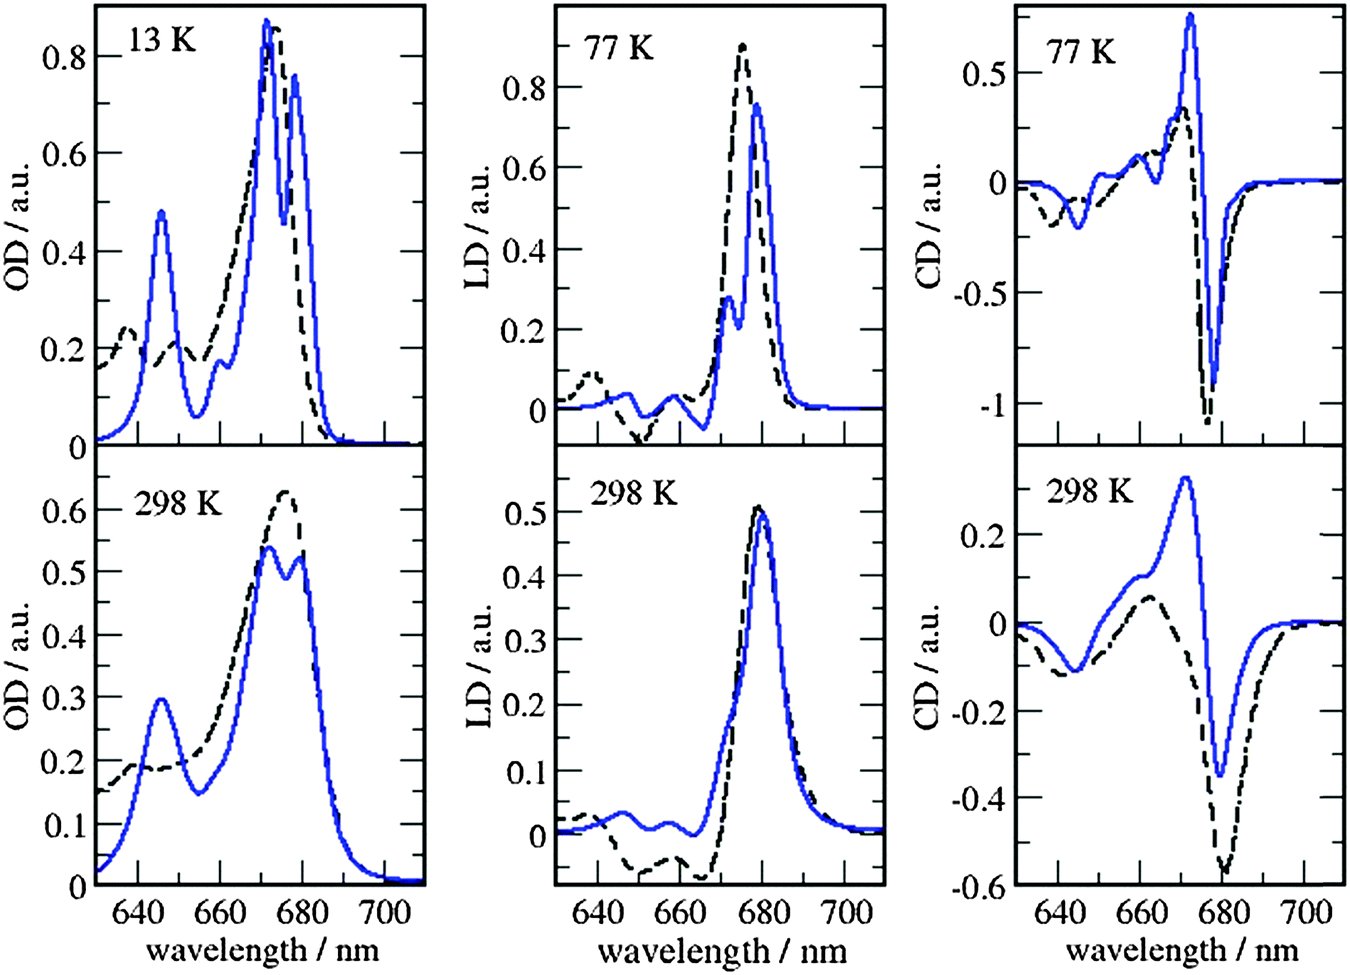 | ||
| Fig. 8 Comparison of optical spectra calculated with the MMPol@MD exciton Hamiltonian (Table S5, ESI†) (blue solid lines) with experimental data (ref. 32, dashed lines). In the left panel the linear absorbance spectra at 13 K (upper part) and at 298 K (lower part) are shown. The middle panel contains the linear dichroism spectra at 77 K (upper part) and 298 K (lower part) and the right panel the circular dichroism spectra at 77 K (upper part) and 298 K (lower part). | ||
As can be seen from Fig. 7 and 8, the spectra in which excitonic parameters calculated on the crystal structure are used significantly disagree with the experiment, whereas those obtained from the MD data are in good qualitative agreement with the experimental absorbance, linear dichroism and circular dichroism data.
From the comparison of the two sets of spectra we conclude that site energies and couplings obtained using the crystal structure data in combination with QM/MMPol calculations are not accurate enough because of the possible artificial distortions of the pigments and the unphysical interactions between some pigments and close-by residues present in the crystalline structure. When an MD simulation of the system in its natural environment (here membrane and water) is used, instead, these artefacts are released and more realistic average site energies and couplings are obtained. Nevertheless, some deviations between the calculated and measured spectra in the high energy (short wavelength) Chl b region still remain. In the low temperature (13 K) absorption spectrum in Fig. 9 two separate bands are visible in the experiment but only one in the calculations. It seems that our calculations miss some contributions to site energy shifts, e.g. those resulting from the dispersive interactions.66 In the electrostatic calculations of site energies of Müh et al.,21b608 was found to be red shifted, but still one more Chl b (b607) had to be red shifted in a refinement fit, in order to describe the high energy side of the linear spectra: hence, at least for the latter, it remains open as to what the mechanism of the red shift is. Concerning the CD spectra there is a good qualitative agreement, but the present exciton theory can only describe conservative CD spectra for which the integral over the spectrum is zero. Obviously, in the case of CP29 there are additional negative contributions to the CD signal, as, e.g. the intrinsic CD of the pigments which was not included in the present analysis.
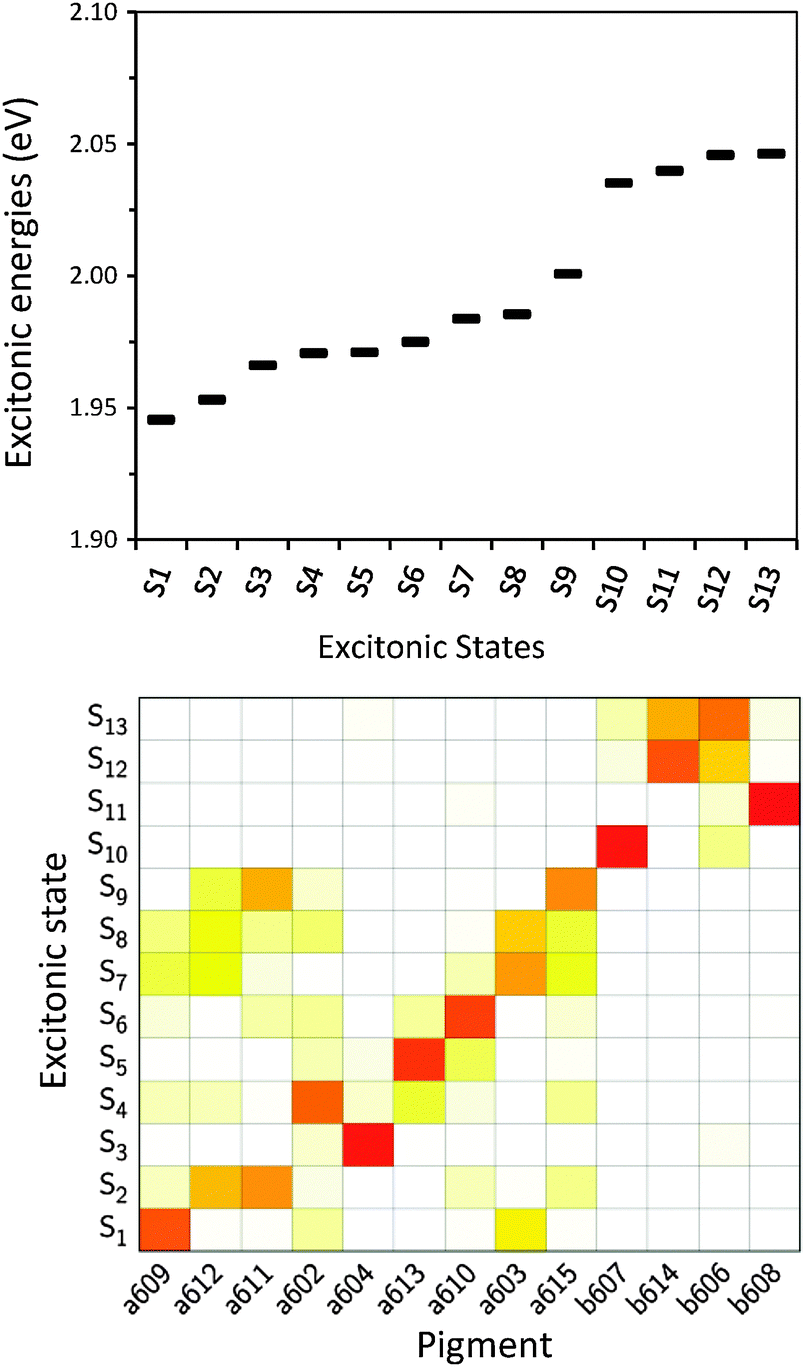 | ||
| Fig. 9 Upper panel: energy progression of the excitonic states obtained from MMPol@MD data. Lower panel: excitonic state composition in terms of individual pigments (obtained through the probability coefficient |c(k)i|2). Red squares mean high contribution, white negligible contribution. | ||
As a last note we observe that all the simulated spectra have used a fixed value for the static disorder as well as a homogeneous broadening based on a model spectral density (see the Methods section). As a matter of fact, the band shape could be directly obtained from the combined MD-QM/MMpol strategy using the fluctuations of the excitonic parameters as determined by the intra- and intermolecular vibrations (homogeneous broadening) and the averaging effect due to a distribution of different structural environments available to the system (inhomogeneous broadening). An accurate determination of these two broadenings, however, would require very long simulation times as well an optimized force field of the pigments which could accurately sample the modulation of exciton parameters by the vibrations (spectral density). However, the already mentioned overestimation of the site energy fluctuations obtained in the present MD simulation prevents the quantitative use of the simulated broadening (see also Fig. S15, ESI†).
5. Analysis of the excitonic states
After having analysed the accuracy of the calculated excitonic parameters when used to simulate optical spectra, here we present a discussion on the nature of the excitonic states and their composition in terms of pigment contributions. For this analysis we use the averaged QM/MMPol data on MD configurations, which yielded the best description of the optical spectra, as discussed above.In Fig. 9 we report the excitonic energy ladder together with a graphical representation of the composition of each exciton state in terms of pigment contributions. In particular, the contribution of the pigment i to the specific excitonic state (k) has been quantified using the “probability coefficient”, i.e. the square of the expansion coefficient, |c(k)i|2, reported in eqn (4).
From the visual analysis of Fig. 9, the excitonic states can be divided into two main groups: (i) the low energy states (S1–S9) delocalized over Chl a pigments and showing an energy progression in the range of 0.06 eV and the (ii) the high energy states (S10–S13) involving only Chl b and being closer in energy (in the range of 0.01 eV). More in detail, the lowest energy state is delocalized over pigments a609, a603 and a602 (stromal side of the membrane). Instead, the two highest energy states involve the chlorophylls b606 and b614 that face the luminal side of the membrane. Chlorophyll b608, which is the only Chl b on the luminal side, thus well separated from the other three Chls b, is mainly involved in the state S11. In general we observe that most of the excitonic states are delocalized over pigments that face the same side of the membrane. The only two exceptions are states S4 and S5 which have a composition of 80–20% from pigments facing different sides. The pigment which contributes most to the lowest excitonic state is a609 whereas the next exciton state is dominated by the a611–a612 dimer. This pair has been found to be responsible for the low-energy states also by Müh et al.21 and Feng et al.,37 whereas the present suggestion of a609 as representing a low energy site is new and should be further evaluated in future work. The third lowest exciton state in our calculations is dominated by a604, which has been shown by site directed mutagenesis studies67 and electrostatic calculations21 to represent a low energy site in CP29. The composition reported in Fig. 7 represents an average picture; we have, however, verified that the main features are preserved along the whole trajectory: this is shown in Fig. S16 (ESI†) where we report the evolution of the single pigments contributions along the MD trajectory for three selected excitonic states, namely the lowest (S1), the highest (S13) and an intermediate one (S5).
There are other interesting questions concerning the role of correlations in fluctuations among different elements of the exciton Hamiltonian. We note that correlations have been reported to be insignificant in other light harvesting complexes such as FMO68 and PE545,69 using a similar methodology to that applied here. On the other hand, strong correlations in site energy fluctuations of different pigments were found70 in a normal mode analysis of the spectral density of the FMO protein at low frequencies, which are difficult to access using the present type of simulations, because very long simulation times would be required. To accurately quantify the possible consequences of such correlations is an interesting future goal as controversial results have been found so far: their relevance for excitation energy transfer has been reported to be low for the FMO complex70 but significant effects on both the coherences and the transfer rates have been shown in model systems.71,72
6. Summary
Quantum chemistry based multiscale models have been shown to be important in the molecular level understanding of the mechanisms acting in light-harvesting complexes. In most cases, however, their predictive power is still hampered by the fact of being limited to the crystallographic structures. In this study of CP29 we have shown that indeed the crystal structure contains serious geometrical distortions that are not compatible with quantum chemical calculations on protein bound cofactors. We have found that classical molecular dynamics simulations can be used in order to both release the artificial strain of the crystal structure and suitably include the effects of the natural environment. The excitonic parameters obtained from the combination of the MD simulation with a polarizable QM/MM description of the full “solvated” system have shown to correctly reproduce the experimental optical spectra indicating that the methodology is capable of giving an accurate average picture. However, the fluctuations of the same properties obtained along the MD trajectory are found to be too large due to an overestimation of the intramolecular motions of the individual pigments obtained using the classical MD simulation. This finding clearly shows that the combination of classical MD and QM/MM calculations cannot be used for a really quantitative investigation of the important coupling between electronic excitations and vibrational modes without a refinement of the classical MD being introduced. Such a refinement mainly involves the force fields used for the pigments which have to be obtained with a completely new parameterization strategy where not only equilibrium geometries are to be well reproduced but also vibronic features as predicted by QM methods need to be considered as fitting data. Work in this direction is already in progress in our group for the most common pigments present in light-harvesting proteins.Acknowledgements
SJ, LV, BM, acknowledge the European Research Council (ERC) for financial support in the framework of the Starting Grant (EnLight – 277755). IP acknowledges CNPq – Brazil for PhD scholarship (236693/2012-3). TR acknowledges support by the Austrian Science Fund: P24774-N27.References
- R. E. Blankenship, Plant Physiol., 2010, 154, 434–438 CrossRef CAS PubMed.
- M. A. Schöttler, C. A. Albus and R. Bock, J. Plant Physiol., 2011, 168, 1452–1461 CrossRef PubMed.
- D. J. Vinyard, G. M. Ananyev and G. C. Dismukes, Annu. Rev. Biochem., 2013, 82, 577–606 CrossRef CAS PubMed.
- S. Caffarri, R. Kouril, S. Kereïche, E. J. Boekema and R. Croce, EMBO J., 2009, 28, 3052–3063 CrossRef CAS PubMed.
- R. Croce and H. van Amerongen, J. Photochem. Photobiol., B, 2011, 104, 142–153 CrossRef CAS PubMed.
- X. Pan, Z. Liu, M. Li and W. Chang, Curr. Opin. Struct. Biol., 2013, 23, 515–525 CrossRef CAS PubMed.
- W. Kühlbrandt, D. N. Wang and Y. Fujiyoshi, Nature, 1994, 367, 614–621 CrossRef PubMed.
- K. N. Ferreira, T. M. Iverson, K. Maghlaoui, J. Barber and S. Iwata, Science, 2004, 303, 1831–1838 CrossRef CAS PubMed.
- X. Pan, M. Li, T. Wan, L. Wang, C. Jia, Z. Hou, X. Zhao, J. Zhang and W. Chang, Nat. Struct. Mol. Biol., 2011, 18, 309–315 CAS.
- J. Standfuss, A. C. Terwisscha van Scheltinga, M. Lamborghini and W. Kühlbrandt, EMBO J., 2005, 24, 919–928 CrossRef CAS PubMed.
- Z. Liu, H. Yan, K. Wang, T. Kuang, J. Zhang, L. Gui, X. An and W. Chang, Nature, 2004, 428, 287–292 CrossRef CAS PubMed.
- R. Remelli, C. Varotto, D. Sandona, R. Croce and R. Bassi, J. Biol. Chem., 1999, 274, 33510–33521 CrossRef CAS PubMed.
- G. Cinque, R. Croce and R. Bassi, Photosynth. Res., 2000, 64, 233–242 CrossRef CAS.
- H. Rogl, R. Schödel, H. Lokstein, W. Kühlbrandt and A. Schubert, Biochemistry, 2002, 41, 2281–2287 CrossRef CAS PubMed.
- T. Morosinotto, J. Breton, R. Bassi and R. Croce, J. Biol. Chem., 2003, 278, 49223–49229 CrossRef CAS PubMed.
- T. R. Calhoun, N. S. Ginsberg, G. S. Schlau-Cohen, Y.-C. Cheng, M. Ballottari, R. Bassi and G. R. Fleming, J. Phys. Chem. B, 2009, 113, 16291–16295 CrossRef CAS PubMed.
- G. S. Schlau-Cohen, A. Ishizaki, T. R. Calhoun, N. S. Ginsberg, M. Ballottari, R. Bassi and G. R. Fleming, Nat. Chem., 2012, 4, 389–395 CrossRef CAS PubMed.
- G. S. Schlau-Cohen, T. R. Calhoun, N. S. Ginsberg, M. Ballottari, R. Bassi and G. R. Fleming, Proc. Natl. Acad. Sci. U. S. A., 2010, 107, 13276–13281 CrossRef CAS PubMed.
- G. S. Schlau-Cohen, T. R. Calhoun, N. S. Ginsberg, E. L. Read, M. Ballottari, R. Bassi, R. van Grondelle and G. R. Fleming, J. Phys. Chem. B, 2009, 113, 15352–15363 CrossRef CAS PubMed.
- J. M. Salverda, M. Vengris, B. P. Krueger, G. D. Scholes, A. R. Czarnoleski, V. Novoderezhkin, H. van Amerongen and R. van Grondelle, Biophys. J., 2003, 84, 450–465 CrossRef CAS.
- F. Müh, D. Lindorfer, M. Schmidt Am Busch and T. Renger, Phys. Chem. Chem. Phys., 2014, 16, 11848–11863 RSC.
- F. Müh, M. E.-A. Madjet and T. Renger, J. Phys. Chem. B, 2010, 114, 13517–13535 CrossRef PubMed.
- V. I. Novoderezhkin, M. A. Palacios, H. van Amerongen and R. van Grondelle, J. Phys. Chem. B, 2005, 109, 10493–10504 CrossRef CAS PubMed.
- C. König and J. Neugebauer, Phys. Chem. Chem. Phys., 2011, 13, 10475–10490 RSC.
- V. Novoderezhkin, A. Marin and R. van Grondelle, Phys. Chem. Chem. Phys., 2011, 13, 17093–17103 RSC.
- J. Adolphs, F. Müh, M. E.-A. Madjet, M. Schmidt Am Busch and T. Renger, J. Am. Chem. Soc., 2010, 132, 3331–3343 CrossRef CAS PubMed.
- T. Renger and F. Müh, Phys. Chem. Chem. Phys., 2013, 15, 3348–3371 RSC.
- S. Yin, M. G. Dahlbom, P. J. Canfield, N. S. Hush, R. Kobayashi and J. R. Reimers, J. Phys. Chem. B, 2007, 111, 9923–9930 CrossRef CAS PubMed.
- C. Curutchet, J. Kongsted, A. Muñoz-Losa, H. Hossein-Nejad, G. D. Scholes and B. Mennucci, J. Am. Chem. Soc., 2011, 133, 3078–3084 CrossRef CAS PubMed.
- C. Curutchet, V. I. Novoderezhkin, J. Kongsted, A. Muñoz-Losa, R. van Grondelle, G. D. Scholes and B. Mennucci, J. Phys. Chem. B, 2013, 117, 4263–4273 CrossRef CAS PubMed.
- S. Jurinovich, C. Curutchet and B. Mennucci, ChemPhysChem, 2014, 15, 3194–3204 CrossRef CAS PubMed.
- A. Pascal, C. Gradinaru, U. Wacker, E. Peterman, F. Calkoen, K. D. Irrgang, P. Horton, G. Renger, R. van Grondelle, B. Robert and H. van Amerongen, Eur. J. Biochem., 1999, 262, 817–823 CrossRef CAS.
- A. V. Ruban, P. J. Lee, M. Wentworth, A. J. Young and P. Horton, J. Biol. Chem., 1999, 274, 10458–10465 CrossRef CAS PubMed.
- S. K. Das and H. A. Frank, Biochemistry, 2002, 41, 13087–13095 CrossRef CAS PubMed.
- M. Rätsep, J. Pieper, K.-D. Irrgang and A. Freiberg, J. Phys. Chem. B, 2008, 112, 110–118 CrossRef PubMed.
- X. Feng, X. Pan, M. Li, J. Pieper, W. Chang and R. Jankowiak, J. Phys. Chem. B, 2013, 117, 6585–6592 CrossRef CAS PubMed.
- X. Feng, A. Kell, J. Pieper and R. Jankowiak, J. Phys. Chem. B, 2013, 117, 6593–6602 CrossRef CAS PubMed.
- D. A. Case, T. E. Cheatham, T. A. Darden, C. L. Simmerling, J. Wang, R. E. Duke, R. Luo, R. C. Walker, W. Zhang, K. M. Merz, B. Roberts, S. Hayik, A. Roitberg, G. Seabra, J. Swails, A. W. Goetz, I. Kolossváry, K. F. Wong, F. Paesani, J. Vanicek, R. M. Wolf, J. Liu, X. Wu, S. R. Brozell, T. Steinbrecher, H. Gohlke, Q. Cai, X. Ye, M.-J. Hsieh, G. Cui, D. R. Roe, D. H. Mathews, M. G. Seetin, R. Salomon-Ferrer, V. B. C. Sagui, T. Luchko, S. Gusarov, A. Kovalenko and P. A. Kollman, AMBER 12, University of California, San Francisco, 2012 Search PubMed.
- V. Hornak, R. Abel, A. Okur, B. Strockbine, A. Roitberg and C. Simmerling, Proteins, 2006, 65, 712–725 CrossRef CAS PubMed.
- Å. A. Skjevik, B. D. Madej, R. C. Walker and K. Teigen, J. Phys. Chem. B, 2012, 116, 11124–11136 CrossRef PubMed.
- M. Ceccarelli, P. Procacci and M. Marchi, J. Comput. Chem., 2003, 24, 129–142 CrossRef CAS PubMed.
- L. Zhang, D.-A. Silva, Y. Yan and X. Huang, J. Comput. Chem., 2012, 33, 1969–1980 CrossRef CAS PubMed.
- J. Wang, R. M. Wolf, J. W. Caldwell, P. A. Kollman and D. A. Case, J. Comput. Chem., 2004, 25, 1157–1174 CrossRef CAS PubMed.
- S. Jo, T. Kim, V. G. Iyer and W. Im, J. Comput. Chem., 2008, 29, 1859–1865 CrossRef CAS PubMed.
- S. Miyamoto and P. A. Kollman, J. Comput. Chem., 1992, 13, 952–962 CrossRef CAS PubMed.
- M. J. Frisch, G. W. Trucks, H. B. Schlegel, G. E. Scuseria, M. A. Robb, J. R. Cheeseman, G. Scalmani, V. Barone, B. Mennucci, G. A. Petersson, H. Nakatsuji, M. Caricato, X. Li, H. P. Hratchian, A. F. Izmaylov, J. Bloino, G. Zheng, J. L. Sonnenberg, M. Hada, M. Ehara, K. Toyota, R. Fukuda, J. Hasegawa, M. Ishida, T. Nakajima, Y. Honda, O. Kitao, H. Nakai, T. Vreven, J. A. Montgomery, J. E. Peralta, F. Ogliaro, M. Bearpark, J. J. Heyd, E. Brothers, K. N. Kudin, V. N. Staroverov, R. Kobayashi, J. Normand, K. Raghavachari, A. Rendell, J. C. Burant, S. S. Iyengar, J. Tomasi, M. Cossi, N. Rega, N. J. Millam, M. Klene, J. E. Knox, J. B. Cross, V. Bakken, C. Adamo, J. Jaramillo, R. Gomperts, R. E. Stratmann, O. Yazyev, A. J. Austin, R. Cammi, C. Pomelli, J. W. Ochterski, R. L. Martin, K. Morokuma, V. G. Zakrzewski, G. A. Voth, P. Salvador, J. J. Dannenberg, S. Dapprich, A. D. Daniels, Ö. Farkas, J. B. Foresman, J. V. Ortiz, J. Cioslowski and D. J. Fox, Gaussian09, Gaussian, Inc., Wallingford CT, 2009 Search PubMed.
- T. Yanai, D. P. Tew and N. C. Handy, Chem. Phys. Lett., 2004, 393, 51–57 CrossRef CAS PubMed.
- J. Tomasi, B. Mennucci and R. Cammi, Chem. Rev., 2005, 105, 2999–3093 CrossRef CAS PubMed.
- X. J. Jordanides, M. J. Lang, X. Song and G. R. Fleming, J. Phys. Chem. B, 1999, 103, 7995–8005 CrossRef CAS.
- J. Wang, P. Cieplak, J. Li, T. Hou, R. Luo and Y. Duan, J. Phys. Chem. B, 2011, 115, 3091–3099 CrossRef CAS PubMed.
- J. Wang, P. Cieplak, J. Li, J. Wang, Q. Cai, M. Hsieh, H. Lei, R. Luo and Y. Duan, J. Phys. Chem. B, 2011, 115, 3100–3111 CrossRef CAS PubMed.
- C. Curutchet, A. Muñoz-Losa, S. Monti, J. Kongsted, G. D. Scholes and B. Mennucci, J. Chem. Theory Comput., 2009, 5, 1838–1848 CrossRef CAS.
- M. F. Iozzi, B. Mennucci, J. Tomasi and R. Cammi, J. Chem. Phys., 2004, 120, 7029–7040 CrossRef CAS PubMed.
- R. Cammi and B. Mennucci, J. Chem. Phys., 1999, 110, 9877 CrossRef CAS PubMed.
- T. Forster, Naturwissenschaften, 1946, 33, 166–175 CrossRef CAS.
- M. Linke, A. Lauer, T. von Haimberger, A. Zacarias and K. Heyne, J. Am. Chem. Soc., 2008, 130, 14904–14905 CrossRef PubMed.
- F. J. Kleima, E. Hofmann, B. Gobets, I. H. van Stokkum, R. van Grondelle, K. Diederichs and H. van Amerongen, Biophys. J., 2000, 78, 344–353 CrossRef CAS.
- R. S. Knox and B. Q. Spring, Photochem. Photobiol., 2003, 77, 497 CrossRef CAS.
- T. Renger and R. A. Marcus, J. Chem. Phys., 2002, 116, 9997 CrossRef CAS PubMed.
- T. Renger, I. Trostmann, C. Theiss, M. E. Madjet, M. Richter, H. Paulsen, H. J. Eichler, A. Knorr and G. Renger, J. Phys. Chem. B, 2007, 111, 10487–10501 CrossRef CAS PubMed.
- G. Raszewski and T. Renger, J. Am. Chem. Soc., 2008, 130, 4431–4446 CrossRef CAS PubMed.
- E. J. Peterman, H. van Amerongen, R. van Grondelle and J. P. Dekker, Proc. Natl. Acad. Sci. U. S. A., 1998, 95, 6128–6133 CrossRef CAS.
- V. I. Novoderezhkin, E. G. Andrizhiyevskaya, J. P. Dekker and R. van Grondelle, Biophys. J., 2005, 89, 1464–1481 CrossRef CAS PubMed.
- I. Renge and K. Mauring, Spectrochim. Acta, Part A, 2013, 102, 301–313 CrossRef CAS PubMed.
- Y. Jing, R. Zheng, H.-X. Li and Q. Shi, J. Phys. Chem. B, 2011, 116, 1164–1171 CrossRef PubMed.
- J. Megow, M. I. Röhr, M. Schmidt Am Busch, T. Renger, R. Mitric, S. Kirstein, J. P. Rabe and V. May, Phys. Chem. Chem. Phys., 2015, 17, 6741–6747 RSC.
- S. Caffarri, F. Passarini, R. Bassi and R. Croce, FEBS Lett., 2007, 581, 4704–4710 CrossRef CAS PubMed.
- C. Olbrich, J. Strümpfer, K. Schulten and U. Kleinekathöfer, J. Phys. Chem. B, 2011, 115, 758–764 CrossRef CAS PubMed.
- L. Viani, C. Curutchet and B. Mennucci, J. Phys. Chem. Lett., 2013, 4, 372–377 CrossRef CAS.
- T. Renger, A. Klinger, F. Steinecker, M. Schmidt Am Busch, J. Numata and F. Müh, J. Phys. Chem. B, 2012, 116, 14565–14580 CrossRef CAS PubMed.
- X. Chen and R. J. Silbey, J. Chem. Phys., 2010, 132, 204503 CrossRef PubMed.
- S. M. Vlaming and R. J. Silbey, J. Chem. Phys., 2012, 136, 055102 CrossRef PubMed.
Footnote |
| † Electronic supplementary information (ESI) available. See DOI: 10.1039/c4cp05647g |
| This journal is © the Owner Societies 2015 |