 Open Access Article
Creative Commons Attribution 3.0 Unported Licence
DNA mediated assembly of quantum dot–protoporphyrin IX FRET probes and the effect of FRET efficiency on ROS generation†
Seema
Singh
a,
Anirban
Chakraborty
a,
Vandana
Singh
a,
Aniruddha
Molla
a,
Sahid
Hussain
a,
Manoj K.
Singh
*b and
Prolay
Das
*a
aDepartment of Chemistry, Indian Institute of Technology, Patna, Patna-800013, Bihar, India. E-mail: prolay@iitp.ac.in; Fax: +91 612 225 7383; Tel: +91 612 255 2057
bAtomic and Molecular Physics Division, Bhabha Atomic Research Centre, Mumbai-400085, India. E-mail: mksingh@barc.gov.in; Fax: +91-22-2550 5151; Tel: +91-22-2559 3987
First published on 23rd January 2015
Abstract
Photodynamic therapy (PDT) involves generation of reactive oxygen species (ROS) by the irradiation of a photosensitizer. Controlled and targeted release of ROS by a photosensitizer is crucial in PDT. For achieving controlled generation of ROS, a ZnSe/ZnS quantum dot (QD) donor and protoporphyrin IX (Pp IX) acceptor based fluorescence resonance energy transfer (FRET) probe is reported here. The QDs and Pp IX are assembled either by direct conjugation or through DNA hybridization. Complementary DNA strands are individually conjugated to the QDs and Pp IX by amide coupling. Due to the overlap of the emission spectrum of QDs and the absorption spectrum of Pp IX, efficient transfer of energy from QDs to Pp IX was observed in both the cases. The FRET efficiency was quantitatively evaluated by steady-state and time-resolved spectroscopy and compared between the QD–Pp IX direct conjugate and QD–DNA–Pp IX assembly at various donor to acceptor ratios. Since a single QD can harbor a multiple number of Pp IX–DNA counterparts through DNA hybridization, the FRET efficiency was found to increase with the increase in the number of Pp IX acceptors. ROS generation from Pp IX was studied for the FRET pairs and was found to be affected by the irradiation time of the QD donor.
1. Introduction
In biomedical research, a constant effort is made to combine diagnostics with therapy. While the diagnostics elements ensure early detection, simultaneous therapy provides instant remedy and thus minimizes future complications by saving invaluable time.1 The main goal of such research is to develop small probes with high selectivity, stability and capacity to detect ailments and deliver the right dosage of drugs in the desired tissues at the same time.2 In this aspect, semiconductor quantum dots (QDs) have received significant recognition in biomedical research, in particular as the diagnostics handles for molecular sensing and cellular imaging.3–5 The size and material dependent properties of semiconductor QDs have been used successfully in biosensing, immunoassay, drug delivery, thin film solar cells, light emitting diodes, as laser materials and others.6–9 Multicolour imaging and cancer targeting using QDs have also been reported.10–12 One of the less researched and scarcely explored areas of the application of QDs is their uses in photosensitization for photodynamic therapy (PDT) of cancer. PDT has been successful in addressing certain types of cancer including esophageal cancer and non-small cell lung cancer.13,14 The FDA approved photosensitizers (PS) Photofrin®, 5-aminolevulinic acid (5-ALA), and a precursor of protoporphyrin (Pp IX) have been used to generate reactive oxygen species (ROS) upon irradiation.15,16 The ROS kills the cancer cells following their accumulation in the concerned tissues.The use of QDs in PDT can be very advantageous since apart from being photobleaching resistant detection probes, they enable the use of a wavelength at which the photosensitizer does not absorb, thus offering flexibility to utilize variable excitation wavelengths to activate the photosensitizer molecule.17 CdSe QDs when excited have been shown to excite a phthalocyanine photosensitizer (Pc4) by FRET to generate ROS.18 Generation of singlet oxygen upon excitation at 488 nm via thiol-capped CdTe QD-sulfonated aluminum phthalocyanine composites has also been reported.19
One potential shortcoming of Cd based QDs for biological application is the toxicity issue20 and PDT is no exception. In PDT, the toxicity of the donor and the photosensitizer in the absence of light is strictly unwarranted. DNA strand breakage and damage have also been observed in plasmids photosensitized by CdSe–ZnS QDs, which may limit their uses in PDT.21 Previous studies have shown that engineered nanoparticles like carbon nanotubes (CNT), silver nanoparticles, CdSe QDs and TiO2 nanoparticles can also cause lung damage by inflammatory effects when used as carriers of PS in PDT.22,23
Apart from the criterion that needs to be fulfilled for an ideal donor in PDT applications including photostability and toxicity issues, it is important that the PDT system be well targeted for in vivo applications. Targeting of therapeutic drugs is often done by attaching a biological entity to the drug molecule, which can recognize its counterpart and accumulate in the region of interest.24 This minimizes side effects, favorably modifies the dose rate and increases drug efficacy.25,26 It is well known that cancer cells are deficient in antioxidative defense systems and hence are highly vulnerable to ROS.27,28 In PDT, the main concept is ROS generation and subsequent cancer cell destruction through it. However, excess ROS generation can have several side effects, whereby healthy cells can be affected. Thus, controlled and targeted release of ROS by PS is the essential need of PDT. Targeting of PDT systems with antibodies and homing peptides has been reported.29–31 It remains to be seen whether the attachment of targeting biological entities to the donor/photosensitizer compromises the efficiency of the PDT system or leads to controlled and sustained ROS generation.
Herein, we report the generation of ROS from Pp IX, where the excitation of the same is achieved by FRET from the ZnSe/ZnS QDs (Scheme 1). Furthermore, a comparative study of the efficiency of ROS generation for various systems consisting of the QDs and Pp IX is presented. The ROS generation from the free QDs and Pp IX system (individually or in mixtures) in solution is compared with those from the QD–Pp IX covalent conjugate (QD covalently attached to Pp IX), QD–DNA, and Pp IX–DNA individually or self-assembled by DNA hybridization. Single stranded DNA (ssDNA) was attached to QDs by amide coupling. Similar chemistry was also used for covalent attachment of Pp IX to ssDNA, which is complementary to the DNA sequence used to link with the QDs. Controlled and proportional release of ROS in the case of QD–DNA–Pp IX assembly was observed.
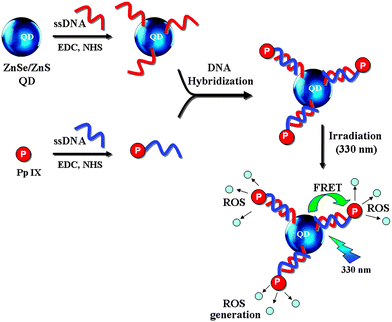 | ||
| Scheme 1 Scheme for conjugation of DNA with QD and Pp IX and subsequent generation of ROS from Pp IX by FRET from QD conjugated through DNA assembly. | ||
The self-recognition property of DNA has been used to assemble the QD–DNA and Pp IX–DNA conjugates. Our study shows that DNA can be used as a self-assembling molecule, whereby FRET efficiency can be modulated by the careful choice of the sequence length. Moreover, a deliberate choice of the sequence of DNA can provide the targeting handle, as in the case of protein recognition by DNA aptamer sequences.32
2. Experimental section
2.1. Materials and methods
Selenium powder, sodium borohydride, N,N-dimethylformamide (DMF), Pp IX, dihydrorhodamine 123 (DHR 123) and 5′-amine terminated (C6 linker) oligonucleotide DNA (12mer) were purchased from Sigma Aldrich. Zinc acetate dihydrate (Zn(OAc)2·2H2O), L-glutathione (GSH), 3-mercaptopropionic acid (MPA), N-hydroxysuccinimide (NHS) and 1-(3-dimethylaminopropyl)-3-ethylcarbodiimide hydrochloride (EDC·HCl) were obtained from Alfa Aesar. All chemicals were used as received. Nanopure water from Millipore was used in all experiments.2.2. Synthesis of ZnSe–ZnS core–shell quantum dots
ZnSe–ZnS QDs were synthesized by the reaction of zinc acetate and sodium hydrogen selenide. Sodium hydrogen selenide was prepared by dissolving NaBH4 (15 mg, 0.4 mmol) in 1 mL of ice cold water, followed by addition of the Se powder (16 mg, 0.2 mmol) under a nitrogen atmosphere. Zn(OAc)2·2H2O (44 mg, 0.2 mmol) and L-glutathione (123 mg, 0.4 mmol) were dissolved in 50 mL water and the pH of the resulting solution was adjusted to 10.5. The reaction mixture was deaerated and 500 μL of NaHSe (0.1 mmol) was added to the reaction mixture and exposed to microwave irradiation at 120 °C for 10 min in a Biotage Microwave reactor. MPA (106 mg, 1 mmol) and Zn(OAc)2·2H2O (55 mg, 0.25 mmol) were added to the ZnSe (0.05 mmol) core solution at pH 10.5 for shelling and again exposed to microwave irradiation at 120 °C for 10 min. QDs were purified by using excess of ethanol followed by centrifugation to remove unconjugated ligands.2.3. Dynamic light scattering (DLS) studies
Hydrodynamic radii of QDs were measured by dynamic light scattering on a Delsa™ Nano particle analyzer (Beckman Coulter). A solution of QDs was filtered through 0.2 micron filters for light scattering experiments. A total of 5 accumulation numbers with 75 s duration were used for data acquisition and all measurements were repeated 5 times.2.4. Conjugation of QDs with Pp IX
EDC solution (5 μL, 10 μM) was added to Pp IX (5 μL, 1 nM) solution in DMF followed by the addition of NHS solution (10 μL, 20 μM). The reaction mixture was thoroughly mixed and allowed to stand at room temperature for 1 h. To this solution, QDs (20 μL, 1 nM) were added and the reaction mixture was heated at 55 °C overnight. The excess of EDC and NHS was removed as the supernatant after centrifugation at 10![[thin space (1/6-em)]](https://www.rsc.org/images/entities/char_2009.gif) 000 rpm. A total of four reactions were done by varying the concentration of Pp IX from 1 nM to 4 nM.
000 rpm. A total of four reactions were done by varying the concentration of Pp IX from 1 nM to 4 nM.
2.5. Conjugation of QDs and Pp IX with DNA and self-assembly
Carboxyl terminated QDs (20 μL, 1 nM) were activated by EDC (10 μL, 10 μM) and NHS (20 μL, 20 μM) in 20 μL of 1![[thin space (1/6-em)]](https://www.rsc.org/images/entities/char_2009.gif) :
:![[thin space (1/6-em)]](https://www.rsc.org/images/entities/char_2009.gif) 1 ethanol (50%)
1 ethanol (50%)![[thin space (1/6-em)]](https://www.rsc.org/images/entities/char_2009.gif) :
:![[thin space (1/6-em)]](https://www.rsc.org/images/entities/char_2009.gif) sodium phosphate buffer (200 mM) at pH 6 with occasional sonication for a few seconds. The solution was centrifuged at 14
sodium phosphate buffer (200 mM) at pH 6 with occasional sonication for a few seconds. The solution was centrifuged at 14![[thin space (1/6-em)]](https://www.rsc.org/images/entities/char_2009.gif) 000 rpm for 10 min and the supernatant was discarded. The resulting pellets were washed with water, followed by the addition of amine terminated ssDNA (S1) (10 μL, 5 nM). The reaction mixture was stirred for 3 h at 4 °C. Excess of EDC, NHS and unreacted DNA was removed by dialysis (MWCO-5KDa).
000 rpm for 10 min and the supernatant was discarded. The resulting pellets were washed with water, followed by the addition of amine terminated ssDNA (S1) (10 μL, 5 nM). The reaction mixture was stirred for 3 h at 4 °C. Excess of EDC, NHS and unreacted DNA was removed by dialysis (MWCO-5KDa).
For the coupling of Pp IX with DNA, Pp IX (25 μL, 5 nM) in DMF was added to a premixed solution of EDC (10 μL, 25 μM) and NHS (20 μL, 50 μM) and the reaction mixture was adjusted to pH 8 by sodium bicarbonate buffer with gentle stirring for 1 h. Amine terminated ssDNA (S2) (10 μL, 5 nM) was added to the reaction mixture and stirred overnight at 55 °C. Excess of EDC and NHS was removed by dialysis (MWCO-5 kDa). The desired product Pp IX–DNA i.e. Pp IX–S2, Pp IX linked to a single DNA strand (S2), was purified by polyacrylamide gel electrophoresis (PAGE). The purified Pp IX–DNA was subjected to molecular weight determination by Autoflex II MALDI-TOF-MS (Bruker Daltonics, Billerica, MA) using linear negative mode. Data processing was performed by the Flex Analysis software.
The QD–DNA conjugate was added to the Pp IX–DNA conjugate in sodium phosphate buffer (10 μL, 10 nM) at pH 7.5. The solution was annealed by heating at 90 °C for 10 min and slowly cooled down to room temperature. The hybridization was done separately using QD–DNA conjugates with various ratios of Pp IX–DNA conjugates from 1![[thin space (1/6-em)]](https://www.rsc.org/images/entities/char_2009.gif) :
:![[thin space (1/6-em)]](https://www.rsc.org/images/entities/char_2009.gif) 1 to 1
1 to 1![[thin space (1/6-em)]](https://www.rsc.org/images/entities/char_2009.gif) :
:![[thin space (1/6-em)]](https://www.rsc.org/images/entities/char_2009.gif) 4 with an increment of 1 nM of the latter.
4 with an increment of 1 nM of the latter.
2.6. Gel electrophoresis
2.7. Optical absorption and emission spectroscopy
For atomic absorption spectrometry (AAS), vacuum dried pellets of QDs were treated with aqua regia and diluted with water. The concentration of zinc was determined by flame AAS and that of selenium was determined by graphite furnace AAS using a GBC 906 Atomic Absorption Spectrometer (GBC Scientific Equipment, USA).UV-visible spectra were recorded on an UV-2550 spectrophotometer (Shimadzu). Steady-state fluorescence spectra were collected on a Fluoromax-4 spectrofluorometer (Horiba, Japan). For excited state lifetime measurement FluoTime 200 from PicoQuant, Germany, working on a time correlated single photon counting (TCSPC) technique has been used. All measurements were done using water as a solvent.
For ROS measurement 5 nM dihydrorhodamine 123 solutions (20 μL) were added to a fixed volume of sample solutions and irradiated with a UV lamp (λmax = 302 nm). Generation of fluorescent rhodamine 123 due to oxidation by ROS is monitored at different time intervals by UV-visible and steady-state fluorescence spectroscopy.
For the determination of quantum yield, a solution of quinine sulphate (QY = 0.55) in 0.5 M H2SO4 was used as standard. The solutions of QDs in water and quinine sulphate in H2SO4 were prepared to have similar absorbance at the excitation wavelength. Quantum yields were calculated using eqn (1).
| QYx = QYs × (As/Ax) × (Ix/Is) × (nx2/ns2) | (1) |
3. Results and discussion
3.1. Synthesis, characterisation and optical properties of water soluble QDs
Synthesis of QDs in the aqueous phase by a conventional method is a slow process as it takes long heating time with inefficient heat transfer to the reactants. Microwave assisted aqueous synthesis of ZnSe/ZnS QDs is a rapid method where homogeneous heating of precursors can occur. Aqueous synthesis of ZnSe/ZnS QDs with dual stabilizing agents GSH and MPA was achieved by microwave heating following the procedure reported by Qian et al. with some modifications.33 The Zn![[thin space (1/6-em)]](https://www.rsc.org/images/entities/char_2009.gif) :
:![[thin space (1/6-em)]](https://www.rsc.org/images/entities/char_2009.gif) Se molar ratio was kept at 2
Se molar ratio was kept at 2![[thin space (1/6-em)]](https://www.rsc.org/images/entities/char_2009.gif) :
:![[thin space (1/6-em)]](https://www.rsc.org/images/entities/char_2009.gif) 1 as Zn precursors have low reactivity towards NaHSe.34 The two stabilizing agents containing –SH, –COOH and –NH2 functional groups possess a lone pair of electrons that can influence the nucleation, growth and stabilization of ZnSe/ZnS QDs and might impose a kinetic barrier on the growth because of coulombic repulsion. The ZnS shell on the core of ZnSe is formed by the thermal decomposition of the MPA ligand that releases S2− reacting with the zinc source.35 Such an effect improves surface passivity that can result in the increased fluorescence intensity. Excess of MPA was used to avoid possible occurrence of new nucleation of ZnS or ZnO nanocrystals.
1 as Zn precursors have low reactivity towards NaHSe.34 The two stabilizing agents containing –SH, –COOH and –NH2 functional groups possess a lone pair of electrons that can influence the nucleation, growth and stabilization of ZnSe/ZnS QDs and might impose a kinetic barrier on the growth because of coulombic repulsion. The ZnS shell on the core of ZnSe is formed by the thermal decomposition of the MPA ligand that releases S2− reacting with the zinc source.35 Such an effect improves surface passivity that can result in the increased fluorescence intensity. Excess of MPA was used to avoid possible occurrence of new nucleation of ZnS or ZnO nanocrystals.
The optical characteristics of QDs were investigated by UV-visible and fluorescence spectroscopy. It can be seen that the QDs have broad absorption in the UV region and the first absorption peak appears at 343 nm (Fig. 1A). The effective mass model equation (eqn (2)) was used to calculate the size of QDs.
 | (2) |
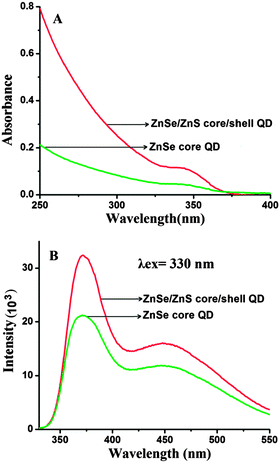 | ||
| Fig. 1 (A) UV-visible absorption and (B) fluorescence spectra of ZnSe core and ZnSe–ZnS core–shell QDs. | ||
The fluorescence spectra of ZnSe core and ZnSe–ZnS core–shell QDs are shown in Fig. 1B. The emission spectrum shows two components: a relatively narrow peak at 373 nm which is due to the band edge emission and the broad one at 450 nm resulting from trap state emission.36 These two components have significance in FRET as the band edge emission (λmax = 373 nm) overlaps with the Soret band of Pp IX and the trap state emission (λmax = 450 nm) overlaps with the Q bands of Pp IX.37 The Forster distance for this FRET probe i.e. the QD donor and the Pp IX acceptor was estimated to be 4.85 nm. Evidently, the QDs fulfill the criteria of a good donor for FRET to occur with Pp IX as an acceptor. Due to the higher fluorescence quantum yield, ZnSe–ZnS core–shell QDs (QY = 0.32) were preferred over ZnSe core QDs (QY = 0.19) for further investigation.
3.2. Synthesis, characterization of QD–Pp IX direct conjugates and self-assembly of QD–DNA and Pp IX–DNA conjugates
Water-soluble EDC and NHS are employed often for the activation of –COOH groups used in cross-coupling reactions.38 The –COOH group of Pp IX was activated using EDC and NHS and directly conjugated to the amine group of QDs. The conjugation of QDs with Pp IX was confirmed by 1% agarose gel electrophoresis (Fig. 2). Due to the emission of the QDs and Pp IX, no staining was required to visualize the samples. From the gel image it can be seen that the QD–Pp IX direct conjugate shows less mobility as compared to the QDs alone. Also, due to the quenching by Pp IX, the QDs' fluorescence is subdued in that sample in the gel. The yield of the reaction of QDs with Pp IX was calculated from the absorption spectra of Pp IX before and after reaction in DMF–water reaction mixture solvent. From absorption studies of the Pp IX in free and conjugated states, the efficiency of the reaction of the QDs with Pp IX was roughly estimated and found to decrease from ∼88% to ∼72% at the QD![[thin space (1/6-em)]](https://www.rsc.org/images/entities/char_2009.gif) :
:![[thin space (1/6-em)]](https://www.rsc.org/images/entities/char_2009.gif) Pp IX reactant ratio from 1
Pp IX reactant ratio from 1![[thin space (1/6-em)]](https://www.rsc.org/images/entities/char_2009.gif) :
:![[thin space (1/6-em)]](https://www.rsc.org/images/entities/char_2009.gif) 1 to 1
1 to 1![[thin space (1/6-em)]](https://www.rsc.org/images/entities/char_2009.gif) :
:![[thin space (1/6-em)]](https://www.rsc.org/images/entities/char_2009.gif) 4, respectively. Thus, QD to Pp IX ratios of 1
4, respectively. Thus, QD to Pp IX ratios of 1![[thin space (1/6-em)]](https://www.rsc.org/images/entities/char_2009.gif) :
:![[thin space (1/6-em)]](https://www.rsc.org/images/entities/char_2009.gif) 1 and 1
1 and 1![[thin space (1/6-em)]](https://www.rsc.org/images/entities/char_2009.gif) :
:![[thin space (1/6-em)]](https://www.rsc.org/images/entities/char_2009.gif) 4 yield products where QD
4 yield products where QD![[thin space (1/6-em)]](https://www.rsc.org/images/entities/char_2009.gif) :
:![[thin space (1/6-em)]](https://www.rsc.org/images/entities/char_2009.gif) Pp IX ratios were 1
Pp IX ratios were 1![[thin space (1/6-em)]](https://www.rsc.org/images/entities/char_2009.gif) :
:![[thin space (1/6-em)]](https://www.rsc.org/images/entities/char_2009.gif) 0.88 and 1
0.88 and 1![[thin space (1/6-em)]](https://www.rsc.org/images/entities/char_2009.gif) :
:![[thin space (1/6-em)]](https://www.rsc.org/images/entities/char_2009.gif) 2.88 respectively. A similar approach was undertaken for yield calculation of the QD–DNA–Pp IX complex.
2.88 respectively. A similar approach was undertaken for yield calculation of the QD–DNA–Pp IX complex.
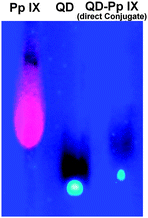 | ||
Fig. 2 1% agarose gel electrophoresis showing mobility of Pp IX, ZnSe/ZnS QD and QD–Pp IX = 1![[thin space (1/6-em)]](https://www.rsc.org/images/entities/char_2009.gif) : :![[thin space (1/6-em)]](https://www.rsc.org/images/entities/char_2009.gif) 4 conjugate. 4 conjugate. | ||
Following the EDC–NHS mediated amide formation chemistry, two separate yet complementary 12-base long ssDNA (S1 and S2, Table 1) are covalently conjugated to QDs and Pp IX. The activated ester formed from the –COOH groups of the ligands in the QDs and the Pp IX is coupled with the 5′-amine terminated ssDNA S1 and S2, respectively, following the standard procedure.
| S1 | NH2-5′-TCA GTC AAC AGC-3′ |
| S2 | NH2-5′-GCT GTT GAC TGA-3′ |
Due to the presence of multiple –COOH functional groups on the surface of the QDs, more than one ssDNA can be attached to the QDs. This is indeed found to occur since the gel mobility of the QDs is appreciably slowed down when conjugated with the DNA as compared to that with ssDNA (12 mer) and only QDs were used as controls (Fig. 3A). DLS studies also revealed an increase in the average hydrodynamic radii from ∼12 nm to ∼21 nm after conjugation with DNA (ESI,† Fig. S1). This is advantageous, since multiple attachments allow easy purification of QD–DNA from the unreacted DNA by dialysis using a suitable molecular weight cut off membrane. More importantly, a single QD with multiple DNA strands can self-assemble multiple Pp IX–DNA conjugates, which can significantly increase the FRET efficiency and hence ROS generation. This is one of the reasons for QD mediated FRET to be worth exploring for photosensitization in PDT applications.
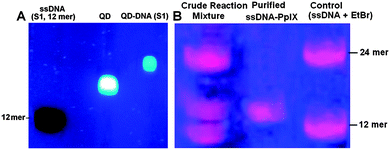 | ||
| Fig. 3 (A) Agarose gel image showing formation of the QD–DNA conjugate. (B) PAGE analysis of the Pp IX–DNA conjugate. | ||
Pp IX has two –COOH groups and thus has the possibility of conjugating itself with one or two ssDNA. For the conjugation of Pp IX to DNA, use of excess EDC and NHS leads to the activation of both the –COOH groups in Pp IX, leading to the formation of the Pp IX conjugate with single or two DNA strands. We used denaturing PAGE to visualize as well as to purify and isolate the Pp IX–DNA conjugate that contains only one DNA strand from the crude reaction mixture (Fig. 3B and S2, ESI†). Attachment of Pp IX to the DNA modifies the gel mobility of the DNA strands, but two distinct bands were obtained corresponding to the number of DNA strands that were attached to the Pp IX molecule. The mobility of the Pp IX conjugated to one ssDNA band is less than the corresponding free 12 mer ssDNA but higher than the 24 mer ssDNA used as a control, which confirmed the formation of the Pp IX–DNA conjugate. The MALDI-TOF spectrum of purified Pp IX–DNA (ESI,† Fig. S3) shows the base peak at 4546.09 corresponding to the mass of Pp IX–DNA. The UV-visible, steady-state fluorescence and time resolved spectra of QDs and Pp IX before and after conjugation with ssDNA show insignificant differences in optical absorption and emission of the QDs and Pp IX (ESI,† Fig. S4 and S5).
The QD–DNA conjugate was hybridized with the Pp IX–DNA conjugate through annealing. Since, multiple attachments of DNA strands with the QDs were evident, we used four different concentrations of the Pp IX–DNA conjugate (1![[thin space (1/6-em)]](https://www.rsc.org/images/entities/char_2009.gif) :
:![[thin space (1/6-em)]](https://www.rsc.org/images/entities/char_2009.gif) 1 to 1
1 to 1![[thin space (1/6-em)]](https://www.rsc.org/images/entities/char_2009.gif) :
:![[thin space (1/6-em)]](https://www.rsc.org/images/entities/char_2009.gif) 4) for the DNA hybridization. As the concentration of the Pp IX–DNA conjugate increases, chances of multiple assembly of Pp IX on a single QD also increase. From the gel image (Fig. 4 and Fig. S6, ESI†) it can be seen that there is retardation in the mobility of the band corresponding to the assembly as compared to dsDNA (12bp) and QDs used as controls. With the increase in the reactant ratio of QD–DNA to Pp IX–DNA from 1
4) for the DNA hybridization. As the concentration of the Pp IX–DNA conjugate increases, chances of multiple assembly of Pp IX on a single QD also increase. From the gel image (Fig. 4 and Fig. S6, ESI†) it can be seen that there is retardation in the mobility of the band corresponding to the assembly as compared to dsDNA (12bp) and QDs used as controls. With the increase in the reactant ratio of QD–DNA to Pp IX–DNA from 1![[thin space (1/6-em)]](https://www.rsc.org/images/entities/char_2009.gif) :
:![[thin space (1/6-em)]](https://www.rsc.org/images/entities/char_2009.gif) 1 to 1
1 to 1![[thin space (1/6-em)]](https://www.rsc.org/images/entities/char_2009.gif) :
:![[thin space (1/6-em)]](https://www.rsc.org/images/entities/char_2009.gif) 4, the retardation in gel mobility is more apparent. Moreover, the absence of any DNA other than the QD–DNA–Pp IX bands indicates that the hybridization is complete in the solution for both the samples.
4, the retardation in gel mobility is more apparent. Moreover, the absence of any DNA other than the QD–DNA–Pp IX bands indicates that the hybridization is complete in the solution for both the samples.
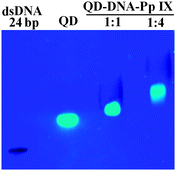 | ||
| Fig. 4 Agarose gel electrophoresis of the QD–DNA–Pp IX assembly. S1 and S2 were prestained with Sybr Green (lane 1). | ||
3.3. FRET analysis
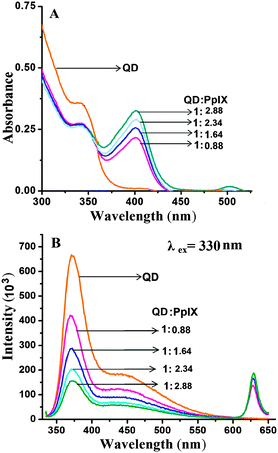
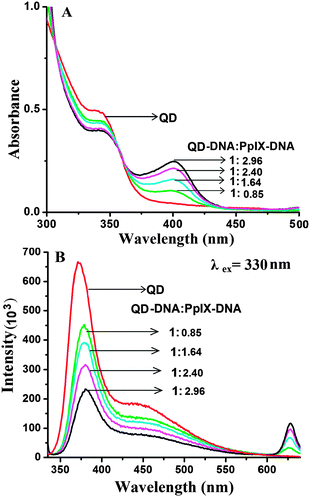
For efficient FRET to occur, the emission spectra of the donor should have a good overlap with the absorption spectra of the acceptor. ZnSe/ZnS QDs have an emission peak at 373 nm (band edge emission) and 450 nm (trap state emission) which shows good overlap with the Soret band and Q bands of Pp IX, respectively (ESI,† Fig. S7). Absorption spectra of the QD–Pp IX direct conjugate and QD–DNA–Pp IX assembly are shown in Fig. 5A and 6A, respectively. The stoichiometry of the FRET probe (QD–Pp IX) formed by the direct conjugation and through DNA assembly was estimated from the absorption spectra and is given in Table 2.| FRET efficiency from steady state fluorescence and excited state lifetime measurement of QDs | ||
|---|---|---|
| Ratio of product | FRET efficiency from steady state (%) | FRET efficiency from excited state lifetime (%) |
QD![[thin space (1/6-em)]](https://www.rsc.org/images/entities/char_2009.gif) : :![[thin space (1/6-em)]](https://www.rsc.org/images/entities/char_2009.gif) Pp IX Pp IX |
||
1![[thin space (1/6-em)]](https://www.rsc.org/images/entities/char_2009.gif) : :![[thin space (1/6-em)]](https://www.rsc.org/images/entities/char_2009.gif) 0.88 0.88 |
31 | 25 |
1![[thin space (1/6-em)]](https://www.rsc.org/images/entities/char_2009.gif) : :![[thin space (1/6-em)]](https://www.rsc.org/images/entities/char_2009.gif) 1.64 1.64 |
47 | 31 |
1![[thin space (1/6-em)]](https://www.rsc.org/images/entities/char_2009.gif) : :![[thin space (1/6-em)]](https://www.rsc.org/images/entities/char_2009.gif) 2.34 2.34 |
58 | 43 |
1![[thin space (1/6-em)]](https://www.rsc.org/images/entities/char_2009.gif) : :![[thin space (1/6-em)]](https://www.rsc.org/images/entities/char_2009.gif) 2.88 2.88 |
65 | 60 |
QD–DNA![[thin space (1/6-em)]](https://www.rsc.org/images/entities/char_2009.gif) : :![[thin space (1/6-em)]](https://www.rsc.org/images/entities/char_2009.gif) Pp IX–DNA Pp IX–DNA |
||
1![[thin space (1/6-em)]](https://www.rsc.org/images/entities/char_2009.gif) : :![[thin space (1/6-em)]](https://www.rsc.org/images/entities/char_2009.gif) 0.85 0.85 |
25 | 20 |
1![[thin space (1/6-em)]](https://www.rsc.org/images/entities/char_2009.gif) : :![[thin space (1/6-em)]](https://www.rsc.org/images/entities/char_2009.gif) 1.64 1.64 |
32 | 30 |
1![[thin space (1/6-em)]](https://www.rsc.org/images/entities/char_2009.gif) : :![[thin space (1/6-em)]](https://www.rsc.org/images/entities/char_2009.gif) 2.40 2.40 |
43 | 44 |
1![[thin space (1/6-em)]](https://www.rsc.org/images/entities/char_2009.gif) : :![[thin space (1/6-em)]](https://www.rsc.org/images/entities/char_2009.gif) 2.96 2.96 |
55 | 57 |
The FRET efficiency was calculated using eqn (3) and (4) for steady-state fluorescence measurement and excited-state lifetime decay of donor QDs, respectively:
| E = 1 − Fda/Fd | (3) |
| E = 1 − τda/τd | (4) |
FRET analysis was done with two systems, the QD–Pp IX direct covalent conjugate and QD–DNA–Pp IX assembled by DNA hybridization (with an increasing ratio of the Pp IX component). We studied the effect of the increasing ratio of the acceptor (Pp IX) at a constant concentration of the donor in each of the systems. This ensures multiple attachment of the acceptor to a single QD. With an increasing ratio of the acceptor Pp IX a periodic decrease in the fluorescence intensity of the QDs was observed (Fig. 5B). The FRET efficiency was found to increase from ca. 31% to 65% with the increase in the QD![[thin space (1/6-em)]](https://www.rsc.org/images/entities/char_2009.gif) :
:![[thin space (1/6-em)]](https://www.rsc.org/images/entities/char_2009.gif) Pp IX ratio from 1
Pp IX ratio from 1![[thin space (1/6-em)]](https://www.rsc.org/images/entities/char_2009.gif) :
:![[thin space (1/6-em)]](https://www.rsc.org/images/entities/char_2009.gif) 0.88 to 1
0.88 to 1![[thin space (1/6-em)]](https://www.rsc.org/images/entities/char_2009.gif) :
:![[thin space (1/6-em)]](https://www.rsc.org/images/entities/char_2009.gif) 2.88. However, no FRET was observed when solutions of QDs and Pp IX in the free state were mixed in the same ratio.
2.88. However, no FRET was observed when solutions of QDs and Pp IX in the free state were mixed in the same ratio.
In the QD–DNA–Pp IX assembly there is an increase in the distance between QDs and the photosensitizer Pp IX linked via 12 base pair DNA. Here also a periodic decrease in the fluorescence intensity of the QDs with the increasing concentration of Pp IX–DNA was observed by steady state measurement (Fig. 6B). The FRET efficiency was found to increase from ca. 25% to 55% with an increase in the number of Pp IX–DNA conjugates that are assembled to QD–DNA by hybridization. FRET depends on the distance between donor and acceptor molecules and their orientation. It is obvious that when QDs and Pp IX are assembled through DNA, the FRET efficiency decreases as evident from the data obtained in the current study (Table 2).
The FRET efficiency was also calculated using time resolved spectroscopy. The sample was excited using a 340 nm, 400 ps pulsed light emitting diode and the fluorescence decay profile of QDs was measured at an emission wavelength of 373 nm. The fluorescence lifetime analysis software FluoFit professional of Picoquant is used to analyse the results. The excited state lifetime of QDs was found to decrease upon increasing the concentration of the Pp IX as shown in Fig. 7 which indicates a transfer of energy from the donor to the acceptor.39 We observed a decrease in the average lifetime of QDs from 55 ns to 22 ns upon direct covalent conjugation with Pp IX (QD![[thin space (1/6-em)]](https://www.rsc.org/images/entities/char_2009.gif) :
:![[thin space (1/6-em)]](https://www.rsc.org/images/entities/char_2009.gif) Pp IX = 1
Pp IX = 1![[thin space (1/6-em)]](https://www.rsc.org/images/entities/char_2009.gif) :
:![[thin space (1/6-em)]](https://www.rsc.org/images/entities/char_2009.gif) 2.88) and 24 ns for QD–DNA–Pp IX (QD–DNA
2.88) and 24 ns for QD–DNA–Pp IX (QD–DNA![[thin space (1/6-em)]](https://www.rsc.org/images/entities/char_2009.gif) :
:![[thin space (1/6-em)]](https://www.rsc.org/images/entities/char_2009.gif) Pp IX–DNA = 1
Pp IX–DNA = 1![[thin space (1/6-em)]](https://www.rsc.org/images/entities/char_2009.gif) :
:![[thin space (1/6-em)]](https://www.rsc.org/images/entities/char_2009.gif) 2.96) assembly. The FRET efficiency calculated from the time-resolved data has nearly the same value as calculated from the fluorescence intensity decay measurement (Table 2).
2.96) assembly. The FRET efficiency calculated from the time-resolved data has nearly the same value as calculated from the fluorescence intensity decay measurement (Table 2).
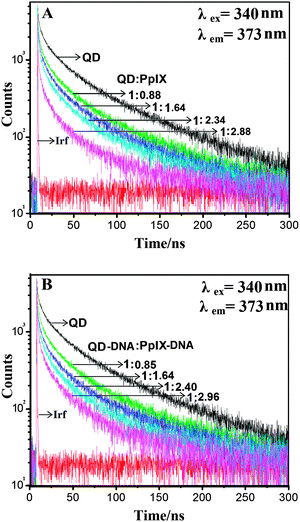 | ||
| Fig. 7 Time-resolved fluorescence decay of (A) QD–Pp IX conjugate and (B) QD–DNA–Pp IX assembly recorded for solutions with varying ratios of donor and acceptor. Irf: instrument response function. | ||
3.4. Kinetics of ROS formation
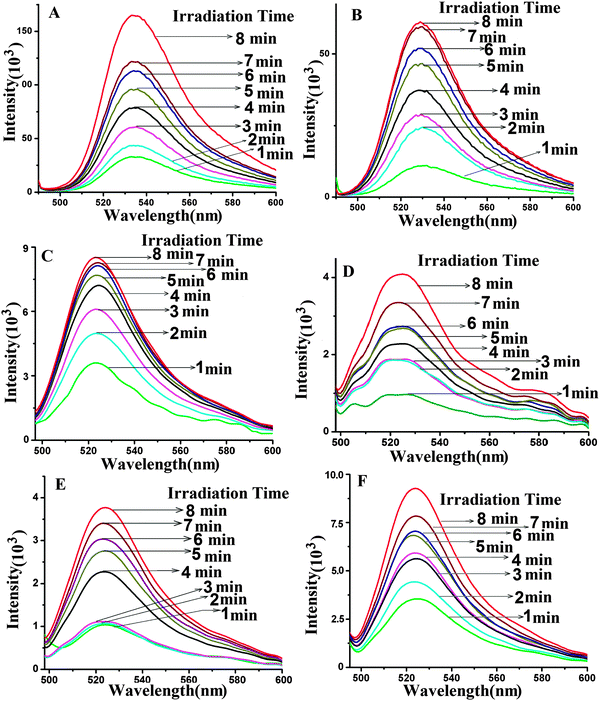
Irradiation of QDs with UV light in the dark leads to the excitation of the QDs. The QD transfers its energy to the acceptor Pp IX generating excited molecules of Pp IX. The excited Pp IX gets de-excited by energy transfer to neighboring oxygen molecules to form ROS. The decay of Pp IX features in the absorption spectra (Fig. S8 and S9, ESI†) occurs due to the photooxidation of Pp IX and is indicative of the formation of ROS.40,41 The resultant ROS can be monitored by its emission at 1270 nm. However, the short lifetime of ROS in the nanosecond range makes it difficult to estimate it quantitatively. For this purpose, dihydrorhodamine 123 (DHR 123), a universal ROS tracking agent, is generally used for ROS measurement.15 The nonfluorescent DHR 123 gets converted into fluorescent rhodamine 123 upon oxidation by the ROS and emits at ∼530 nm.The ROS generation was studied for the free QDs, free Pp IX, QD–S1, QD–S1–S2 (QD conjugated to S1 and S1 annealed to S2), Pp IX–S2, PpIX–S2–S1, a mixture of QDs and Pp IX in the free state without any conjugation, a mixture of QD–S1 and Pp IX–S2 in the free state without hybridization, QD–Pp IX direct conjugate and QD–S1–S2–Pp IX assembly (Fig. 8 and Fig. S8–S12, ESI†). For ROS generation study of the FRET probes, samples in different ratios have been used. All the samples were analysed before and after irradiation of samples upon addition of DHR 123. The presence of an absorbance peak at 500 nm and an emission peak at ∼530 nm at an excitation wavelength of 485 nm confirms the formation of rhodamine 123 from DHR 123 due to ROS generation (ESI,† Fig. S8–S12). The fluorescence from rhodamine 123 (λmax ∼ 530 nm) at different time intervals was measured spectrophotometrically. It can be seen from the absorbance (500 nm) and fluorescence (∼530 nm) peaks of rhodamine 123 (Fig. 8 and Fig. S8–S12, ESI†) that the samples containing FRET probes show higher ROS generation as compared to the free QD, QD–S1, QD–S1–S2, free Pp IX, Pp IX–S2, Pp IX–S2–S1, a mixture of QDs and Pp IX in the free state without any conjugation, a mixture of QD–S1 and Pp IX–S2 in the free state without hybridization. The photosensitizer Pp IX in the free state does not get sufficient energy for excitation and hence leads to less ROS generation. The same is true for the PpIX–S2 conjugate in single or when duplexed with the S1 strand. As expected, ROS generation from the QD–Pp IX direct conjugate is the highest among all the samples followed by that from the QD–DNA–Pp IX assembly. This is due to more efficient FRET in the former that leads to the formation of increased amounts of ROS as compared to the QD–DNA–Pp IX assembly, where the acceptor and the donor are separated in space by a 12 mer duplex DNA. Nevertheless, the QD–Pp IX direct conjugate lacks the biorecognition and possible targeting entity which is present as DNA in the current study. This DNA strand is open to modification and can be wisely chosen to target various cell surface markers that will increase the efficiency of the treatment modality as in PDT.
4. Conclusion
Water soluble, non-toxic QDs can serve the dual purpose of imaging and as FRET donors for the generation of ROS for potential application in PDT. Conjugated with DNA, they can be self-assembled with photosensitizers and directed to specific tissues for imaging and targeted destruction of diseased cells. Herein, ZnSe/ZnS QDs were synthesized and conjugated to ssDNA using EDC–NHS mediated amide formation chemistry. The same chemistry was used to conjugate the photosensitizer Pp IX with ssDNA that is complementary to the DNA attached to the QD. The self-assembly of the QD–DNA conjugate and the Pp IX–DNA conjugate was achieved by hybridization of the DNA strands. FRET efficiency was compared with various models that include the direct covalent conjugate of QDs–Pp IX, and QD–DNA–Pp IX assembly, where the QD was the donor and the Pp IX was the acceptor. As a proof of principle, ROS generation was also compared with the two models along with the individual entities in solution. A significant and systematic increase in the ROS formation was observed for the QD–Pp IX direct conjugate as well as the QD–DNA–Pp IX assembly as compared to the individual species in solution. We postulate that with the careful manipulation of the DNA sequence, the donor and the acceptor, the assembly of the QD–DNA-photosensitizer can have general applicability, in particular in PDT with the dual purpose of imaging and targeted, controlled release of ROS for the treatment of relevant cancers.Acknowledgements
This work was supported by a grant to P. D., S. H. and M. K. Singh from BRNS, Department of Atomic Energy (DAE), Govt. of India, Project No. 2012/34/59/BRNS. S. S. and V. S. are thankful to BRNS and CSIR, India, for fellowship. S. H. is also thankful to DST for grant (SR/FT/CS-093/2009). The authors are thankful to IIT Patna, BARC (Mumbai), and IIT Madras for infrastructure and experimental facilities.Notes and references
- L. Bonacina, Mol. Pharmaceutics, 2013, 10, 783–792 CrossRef CAS PubMed.
- M. Goldberg, R. Langer and X. Jia, J. Biomater. Sci., Polym. Ed., 2007, 18, 241–268 CrossRef CAS PubMed.
- C. Tassa, S. Y. Shaw and R. Weissleder, Acc. Chem. Res., 2011, 44, 842–852 CrossRef CAS PubMed.
- D. Geißler, S. Linden, K. Liermann, K. D. Wegner, L. J. Charbonnière and N. Hildebrandt, Inorg. Chem., 2014, 53, 1824–1838 CrossRef PubMed.
- P. R. Gil and W. J. Parak, ACS Nano, 2008, 2, 2200–2205 CrossRef CAS PubMed.
- A. Gajewicz, T. Puzyn, B. Rasulev, D. Leszczynska and J. Leszczynski, Nanosci. Nanotechnol.–Asia, 2011, 1, 53–58 CAS.
- A. Prakash and D. Bahadur, Phys. Chem. Chem. Phys., 2014, 16, 21429–21437 RSC.
- C. M. Tyrakowski and P. T. Snee, Phys. Chem. Chem. Phys., 2014, 16, 837 RSC.
- S. K. Muzakir, N. Alias, M. M. Yusoffab and R. Jose, Phys. Chem. Chem. Phys., 2013, 15, 16275–16285 RSC.
- P. Juzenasa, W. Chenb, Y. P. Sunc, M. A. N. Coelhod, R. Generalova, N. Generalovaa and I. L. Christensena, Adv. Drug Delivery Rev., 2008, 60, 1600–1614 CrossRef PubMed.
- T. R. Pisanic, Y. Zhangb and T. H. Wang, Analyst, 2014, 139, 2968–2981 RSC.
- J. Liab and J. J. Zhu, Analyst, 2013, 138, 2506–2515 RSC.
- A. Smith, S. Dave, S. Nie, L. True and X. Gao, Expert Rev. Mol. Diagn., 2006, 6, 231–244 CrossRef CAS PubMed.
- C. Fowley, N. Nomikou, A. P. McHale, B. McCaughana and J. F. Callan, Chem. Commun., 2013, 49, 8934 RSC.
- M. Oo, Y. Yang, Y. Hu, M. Gomez, H. Du and H. Wang, ACS Nano, 2012, 6, 1939–1947 CrossRef PubMed.
- Y. Chenga, J. D. Meyersa, A. M. Broome, M. E. Kenney, J. P. Basilion and C. Burdab, J. Am. Chem. Soc., 2011, 133, 2583–2591 CrossRef PubMed.
- H. M. E. Azzazy, M. M. H. Mansour and S. C. Kazmierczak, Clin. Biochem., 2007, 40, 917–927 CrossRef CAS PubMed.
- L. Shao, Y. Gao and F. Yan, Sensors, 2011, 11, 11736–11751 CrossRef PubMed.
- A. C. S. Samia, X. Chen and C. Burda, J. Am. Chem. Soc., 2003, 125, 15736–15737 CrossRef CAS PubMed.
- Y. J. Choi, Y. J. Kim, J. W. Lee, Y. Lee, Y. Lim and H. W. Chung, J. Nanosci. Nanotechnol., 2012, 12, 2160–2168 CrossRef CAS PubMed.
- A. A. Anas, H. Akita, H. Harashima, T. Itoh, M. Ishikawa and V. Biju, J. Phys. Chem. B, 2008, 112, 10005–10011 CrossRef CAS PubMed.
- S. J. Soenena, P. Gil, J. M. Montenegrob, W. J. Parakb, S. C. De Smedta and K. Braeckmansa, Nano Today, 2011, 6, 446–465 CrossRef PubMed.
- A. Valipoor, K. Parivar, M. Modaresi and M. Messripour, Nanomedicine, 2014, 1, 258–265 CAS.
- K. Kim, S. Kim, S. Beck, J. Yang, S. Yuan and S. Hahn, J. Nanomed. Nanotechnol., 2012, 8, 1070–1073 CrossRef CAS PubMed.
- Y. Bae and K. Park, J. Controlled Release, 2011, 153, 198–205 CrossRef CAS PubMed.
- D. J. Adams, Z. V. Boskovic, J. R. Theriault, A. J. Wang, A. M. Stern, B. K. Wagner, A. F. Shamji and S. L. Schreiber, ACS Chem. Biol., 2013, 8, 923–929 CrossRef CAS PubMed.
- R. A. Cairns, I. S. Harris and T. W. Mak, Nat. Rev. Cancer, 2011, 11, 85–95 CrossRef CAS PubMed.
- D. Trachootham, J. Alexandre and P. Huang, Nat. Rev. Drug Discovery, 2009, 8, 579–591 CrossRef CAS PubMed.
- A. Accardo, D. Tesauro and G. Morelli, Polym. J., 2013, 45, 481–493 CrossRef CAS.
- M. Yu, J. Park and S. Jon, Theranostics, 2012, 2, 3–44 CrossRef CAS PubMed.
- H. Had, M. Roh, A. Giani, T. Hisatomi, S. Nakao, I. K. Kim, E. S. Gragoudas, D. Vavvas, S. Guccione and J. W. Miller, PLoS One, 2011, 6, e18864 Search PubMed.
- A. K. H. Cheng, H. Su, Y. A. Wang and H. Z. Yu, Anal. Chem., 2009, 81, 6130–6139 CrossRef CAS PubMed.
- H. Qian, X. Qiu, L. Li and J. Ren, J. Phys. Chem. B, 2006, 110, 9034–9040 CrossRef CAS PubMed.
- A. Aboulaich, M. Geszke, L. Balan, J. Ghanbaja, G. Medjahdi and R. Schneider, Inorg. Chem., 2010, 49, 10940–10948 CrossRef CAS PubMed.
- Q. Liang, Y. Bai, L. Han, X. Deng, X. Wu, Z. Wang, X. Liu and J. Meng, J. Lumin., 2013, 143, 185–192 CrossRef CAS PubMed.
- C. Shen and W. L. Tseng, Inorg. Chem., 2009, 48, 8689–8694 CrossRef CAS PubMed.
- S. Karasawa, T. Araki, T. Nagai, H. Mizuno and A. Miyawaki, Biochem. J., 2004, 381, 307–312 CrossRef CAS PubMed.
- D. Bartczak and A. G. Kanaras, Langmuir, 2011, 27, 10119–10123 CrossRef CAS PubMed.
- S. Sarkar, R. Bose, S. Jana, N. Jana and N. Pradhan, J. Phys. Chem. Lett., 2010, 1, 636–640 CrossRef CAS.
- R. Rotomskis, S. Bagdonas and G. Streckyte, J. Photochem. Photobiol., B, 1996, 33, 61 CrossRef CAS.
- P. Juzenas, S. Sharfaei, J. Moan and R. Bissonnette, J. Photochem. Photobiol., B, 2002, 67, 11–17 CrossRef CAS.
Footnote |
| † Electronic supplementary information (ESI) available: Dynamic light scattering of ZnSe–ZnS QD and QD–DNA conjugates, gel images, MALDI-TOF spectra of Pp IX–DNA conjugates, UV-visible and fluorescence spectra of QDs and Pp IX before and after conjugation with DNA, the overlap spectra of QDs (donor) and Pp IX (acceptor) and comparative UV-visible and fluorescence spectra for ROS generation in various systems of QDs and Pp IX. See DOI: 10.1039/c4cp05306k |
| This journal is © the Owner Societies 2015 |

