
 Open Access Article
 This Open Access Article is licensed under a
 Creative Commons Attribution 3.0 Unported Licence
Dynamics of the A-band ultraviolet photodissociation of methyl iodide and ethyl iodide via velocity-map imaging with ‘universal’ detection
Sara H.
Gardiner
a,
M. Laura
Lipciuc
a,
Tolga N. V.
Karsili
b,
Michael N. R.
Ashfold
b and
Claire
Vallance
*a
aDepartment of Chemistry, University of Oxford, Chemistry Research Laboratory, 12 Mansfield Rd, Oxford, OX1 3TA, UK. E-mail: claire.vallance@chem.ox.ac.uk
bSchool of Chemistry, University of Bristol, Bristol, BS8 1TS, UK
First published on 22nd December 2014
Abstract
We report data from a comprehensive investigation into the photodissociation dynamics of methyl iodide and ethyl iodide at several wavelengths in the range 236–266 nm, within their respective A-bands. The use of non-resonant single-photon ionization at 118.2 nm allows detection and velocity-map imaging of all fragments, regardless of their vibrotational or electronic state. The resulting photofragment kinetic energy and angular distributions and the quantum yields of ground-state and spin–orbit excited iodine fragments are in good agreement with previous studies employing state-selective detection via REMPI. The data are readily rationalised in terms of three competing dissociation mechanisms. The dominant excitation at all wavelengths studied is via a parallel transition to the 3Q0 state, which either dissociates directly to give an alkyl radical partnered by spin–orbit excited iodine, or undergoes radiationless transfer to the 1Q1 potential surface, where it dissociates to an alkyl radical partnered by iodine in its electronic ground state. Ground state iodine atoms can also be formed by direct dissociation from the 1Q1 or 3Q1 excited states following perpendicular excitation at the shorter and longer wavelength region, respectively, in the current range of interest. The extent of internal excitation of the alkyl fragment varies with dissociation mechanism, and is considerably higher for ethyl fragments from ethyl iodide photolysis than for methyl fragments from methyl iodide photolysis. We discuss the relative advantages and disadvantages of single-photon vacuum-ultraviolet ionization relative to the more widely used REMPI detection schemes, and conclude, in agreement with others, that single-photon ionization is a viable detection method for photofragment imaging studies, particularly when studying large molecules possessing multiple fragmentation channels.
1 Introduction
Laser pump–probe methods combined with velocity-map imaging detection have been the experimental techniques of choice for studying gas-phase molecular photodissociation processes for at least the last decade. The three-dimensional scattering distribution of the photofragments reveals the product translational energy and angular distributions, yielding detailed information on the energy partitioning amongst the various available product degrees of freedom and on the electronic states involved in the fragmentation process. When suitably polarised light is used in the probe step, more subtle details of the dynamics are often revealed, such as any preferred polarisation of electronic or rotational angular momentum in the atomic or molecular photofragments.1–4In recent years, there has been a move away from highly detailed studies of diatomic and triatomic molecules towards investigations into the photofragmentation dynamics of larger molecules of perhaps more general chemical interest. This raises a number of challenges for the velocity-map imaging technique. In the ‘traditional’ approach to velocity-map imaging, products are ionized state-selectively via a resonance-enhanced multiphoton ionization (REMPI) scheme. The newly formed ions are then accelerated along a flight tube towards a detector by a carefully tuned velocity-mapping electric field. In the simplest implementation, the mapping field preserves the velocity components transverse to the time-of-flight axis and also compresses the expanding Newton sphere of photofragments along this axis, so that the ion cloud is ‘pancaked’ onto the detector, and the velocity-map image comprises a two-dimensional projection of the nascent three-dimensional velocity distribution. The process can be repeated for different product quantum states by tuning the REMPI laser to the appropriate wavelength. When studying the fragmentation dynamics of diatomic and, to a lesser extent, triatomic molecules, conservation of momentum has the consequence that by detecting one fragment state-selectively, complete state-to-state information can often be obtained on the fragmentation dynamics and internal state distributions of both fragments. The same is not true when studying larger molecules, which tend to possess multiple possible fragmentation channels, some involving more than two fragments. REMPI schemes may not be available for some or all of the fragments, the various product quantum states may not be resolvable, and even if they are, repeating the experiment to obtain images for every quantum state of every fragment quickly becomes prohibitively time consuming.
One solution is to employ a ‘universal’ ionization scheme that allows all fragments with sufficiently low ionization potentials to be ionized and detected.5–13 We have recently developed a velocity-map imaging instrument that achieves ionization of all photolysis products with ionization potentials less than 10.49 eV via single-photon vacuum ultraviolet (VUV) ionization at 118.2 nm. This allows images to be obtained relatively quickly for each fragment, and though in general this comes at the expense of detailed state-to-state information, in favourable cases this information is still revealed in the images. The molecules examined in the present study represent two such cases. Further improvements in acquisition speed will be realised in the future with the implementation of multi-mass imaging detectors such as the PImMS14–16 and TimePix17 sensors.
To demonstrate the power of this approach, we revisit the first molecule for which ion images were published,18 methyl iodide, and compare its fragmentation dynamics at multiple wavelengths within the first electronic absorption band with those of the next molecule in the homologous series, ethyl iodide. We show that imaging both fragments from the dissociation of these molecules allows us to confirm the identities of the various fragmentation channels accessed at different UV wavelengths, and also provides a straightforward route to determining the quantum yields for the two spin–orbit states of atomic iodine, without the need to correct for their different detection efficiencies. This study represents an extension of the single-photolysis wavelength studies of Pratt and coworkers.5,8 We begin with a brief overview of previous studies.
2 Overview of the photofragmentation dynamics of methyl iodide and ethyl iodide
The A-band of methyl iodide results from a σ* ← n excitation from the lone pair on iodine to the lowest anti-bonding molecular orbital. The band is comprised of transitions to five electronically excited states, arising from spin–orbit interactions induced by the unpaired electron remaining on the iodine atom.19–22 The energy level correlation diagram for CH3I in Fig. 1(a) depicts the electronic states within the C3v point group in the absence and presence of spin–orbit interactions.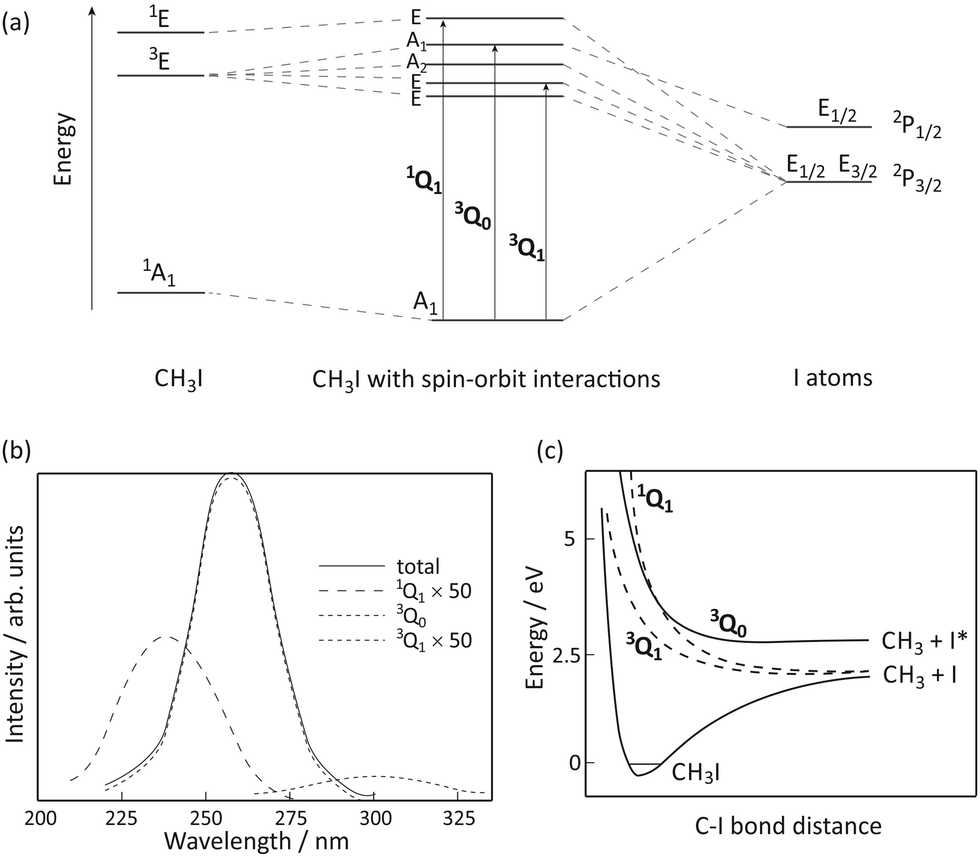 | ||
| Fig. 1 (a) Correlation diagram (adapted from ref. 19), (b) the absorption cross-section (adapted from ref. 20), and (c) schematic potential energy curves (adapted from ref. 20) for the states involved in the A-band dissociation of CH3I. | ||
The A-band absorption spectrum of methyl iodide, shown in Fig. 1(b), has three significant components. Following the nomenclature of Mulliken,23 the labels 1Q1, 3Q0 and 3Q1 are used, in descending energetic order, to label the relevant transitions (shown in Fig. 1(a)), and also to denote the corresponding excited states reached through each transition. The strongest absorption is the parallel 3Q0 (A1 ← A1) transition, with the weak, perpendicular 1Q1 and 3Q1 absorptions (shown here 50 times magnified) making minor contributions. Alekseyev and Buenker showed21,22 that transitions to the Ω = 0 states are greatly enhanced due to intensity borrowing from the very intense σ* ← σ transition that appears at significantly higher energies than the A band. Note that the two low-lying states of E symmetry are thought to be essentially degenerate in the strong-field limit, yielding a single absorption (traditionally labelled 3Q1), and the A2 ← A1 transition is symmetry forbidden and therefore does not contribute to the absorption spectrum.
All of the excited states accessible via A-band excitation are dissociative along the C–I bond coordinate.24–26 Schematic potential energy curves along this coordinate are shown in Fig. 1(c). The 1Q1 and 3Q1 states accessed via perpendicular transitions from the ground state of CH3I correlate diabatically with iodine in its 2P3/2 spin–orbit ground state (henceforth denoted I) and a methyl radical also in its electronic ground state, with v quanta of vibrational excitation.
| CH3I + hν → CH3I* → CH3(v) + I(2P3/2) | (1) |
In contrast, the 3Q0 state, accessed via a parallel transition, leads to production of spin–orbit excited 2P1/2 iodine (henceforth denoted I*) partnered by a ground-state methyl radical.
| CH3I + hν → CH3I* → CH3(v) + I(2P1/2) | (2) |
We might therefore expect that velocity-map images of the I and I* photofragments would reveal angular distributions characterised by angular anisotropy parameters of β = −1 and β = 2, respectively, reflecting the perpendicular and parallel transitions leading to their production from the parent CH3I molecule. However, the situation is complicated by a conical intersection between the 3Q0 and 1Q1 states, which allows transfer of population between the two states. The resulting fragmentation dynamics have been studied by a number of authors,8,26–33 and can be summarised as follows.
At the low energy end of the A band, where only the 3Q1 component is energetically accessible, only ground state iodine products are observed, with the expected angular distribution characterised by β = −1. At higher energies, where the 3Q0 component becomes accessible via a parallel transition, both I and I* products are observed. The I* product has the expected β = 2 angular distribution predicted from the correlation diagram in Fig. 1(a), but the ground state I product is also observed to possess a large positive value of β, indicating that it is formed via an initial 3Q0 ← A1 transition followed by non-radiative transfer to the 1Q1 state in the exit channel. At still higher excitation energies, the 1Q1 component of the A band is accessed directly, via a perpendicular transition, and the anisotropy parameter associated with the ground state I product is seen to decrease.
There are numerous parallels between the absorption spectrum and dissociation dynamics of methyl iodide and those of ethyl iodide. The A band in ethyl iodide also arises from a σ* ← n transition from the lone pair of the iodine atom to the lowest anti-bonding molecular orbital of C2H5I.34 The reduced symmetry of C2H5I (CS) relative to CH3I (C3v) results in numerous excited states of A′ and A′′ symmetry (four of each symmetry derive from the analogues of the 1E and 3E spin–orbit-free states in Fig. 1(a)), all of which are optically accessible. As in the case of CH3I, the excited states are dissociative along the C–I coordinate, yielding ground-state ethyl radicals and either ground-state or spin–orbit excited atomic iodine. Potential energy curves for some of the excited states are plotted as a function of C–I bond distance in Fig. 2. The calculation of these unrelaxed (i.e. rigid body) spin–orbit resolved potential energy curves followed the same sequence of steps as in our recent study of the iodoethane cation.35 In brief, the calculations used the CASPT2/cc-pVTZ(C,H), cc-pVTZ-pp(I),46e-ECP(I) level of theory, with an active space of six electrons in four orbitals (the C–I centred σ and σ* orbitals and the 5py and 5px orbitals on the I atom), and the only internal coordinate that was varied was the C–I bond distance. All other internal degrees of freedom were held fixed at their ground-state equilibrium values.
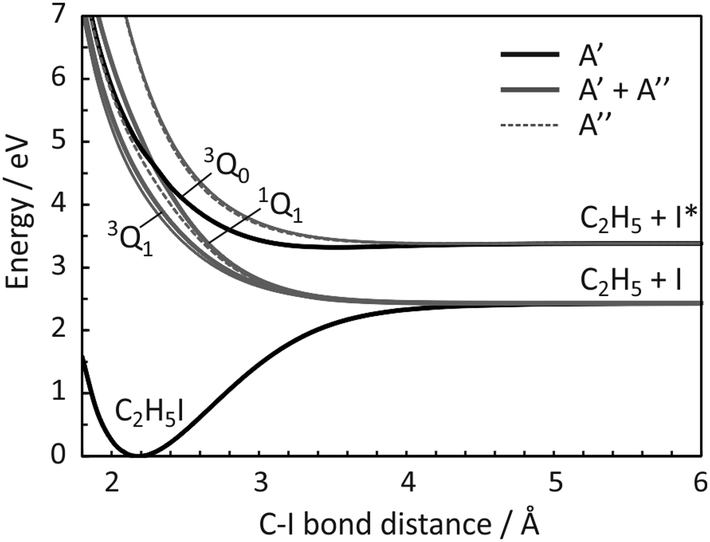 | ||
| Fig. 2 Diabatized, spin–orbit resolved potential energy curves plotted as a function of C–I bond length for all states of C2H5I that correlate to the C2H5 + I and C2H5 + I* limits. States of A′ and A′′ symmetry are depicted by solid black and dotted grey lines, respectively, while A′ and A′′ pairs that are degenerate within the displayed energy resolution are shown as solid grey lines line. The analogues of the 3Q1, 3Q0 and 1Q1 states of CH3I (see Fig. 1(c)) are labelled and rendered in bold. | ||
There have been numerous studies into the spectroscopy and photofragmentation dynamics of C2H5I following excitation within its A band,5,19,36–44 with the fragment speed and angular distributions having been characterised at a number of wavelengths. In common with methyl iodide, the variation in the anisotropy parameter β recorded for ground state atomic iodine fragments at different wavelengths across the absorption band indicates that the analogue of the 3Q0/1Q1 conical intersection is also important in ethyl iodide.
3 Experiment
Photofragment time-of-flight spectra and velocity-map images were recorded using a custom-built velocity-map-imaging spectrometer, the main features of which have been described in detail previously.45 Gas mixtures comprising ∼0.1% methyl iodide (iodomethane, Sigma Aldrich, 99%) or ethyl iodide (iodoethane, Sigma Aldrich, 99%), seeded in 2 bar He (BOC, >99.9%) were expanded through a pulsed solenoid valve (Parker Hannifin Series 9) at a repetition rate of 10 Hz. Under these conditions no cluster formation was observed (the presence of clusters would lead to high-mass peaks at characteristic m/z ratios in our time of flight spectra, but no such peaks were noted). The resulting pulsed molecular beam passed through a skimmer into the imaging chamber, and was intersected at right angles within the velocity-mapping ion optics assembly by the ultraviolet (UV) photolysis and vacuum ultraviolet (VUV) probe laser beams, with a 20 ns delay between the pump and probe pulses. The UV photolysis light, in the wavelength range from 230–270 nm, was provided by a tuneable, frequency-doubled, pulsed dye laser (Sirah Cobra Stretch, 0.4 to 1 mJ per 7 ns pulse, 1 × 1 mm2 spot size in the interaction region, linewidth ∼0.3 cm−1) pumped by the third harmonic of a Nd:YAG laser (Continuum Surelite II, 200 mJ per 7 ns pulse). CH3I was photolysed at wavelengths of 240 nm and 266 nm, and C2H5I at 236 nm, 248 nm, 257 nm, and 266 nm.The 118.2 nm (hereafter referred to as ‘118 nm’) VUV probe light used to effect ‘universal’ ionization of the photofragments was produced by tripling the 354.7 nm (hereafter referred to as ‘355 nm’) third harmonic of a Nd:YAG laser (Continuum Surelite I, ∼10–20 mJ per 5 ns pulse) in a 1![[thin space (1/6-em)]](https://www.rsc.org/images/entities/char_2009.gif) :11 phase-matched mixture of Xenon and Argon gases.46–49 The 118 nm and residual 355 nm light were not separated before entering the imaging chamber, but the residual 355 nm light was not sufficiently intense to effect three-photon ionization of the parent or fragment molecules; this was checked by evacuating the tripling gas cell, which resulted in immediate loss of all observable two-laser signal. The VUV laser has a photon energy of 10.49 eV, which is sufficient to ionize both the parent alkyl iodides and their primary photofragments via non-resonant one-photon ionization. The relevant ionization potentials are listed in Table 1. When employing universal VUV ionization, both the I and I* fragments are imaged simultaneously, as they have the same mass and are therefore not separated by their time of flight. In some experiments, the two fragments were imaged separately by using a (2 + 1) REMPI scheme in place of VUV ionization in order to ionize and subsequently detect only one of the fragments. In these one-laser experiments, the dye laser beam was used both to photolyse the parent molecule and to ionize the chosen fragments. The chosen (one-photon) wavelengths of 266.5 nm and 266.6 nm have been employed previously for the REMPI detection of I and I* by Tang et al.41
:11 phase-matched mixture of Xenon and Argon gases.46–49 The 118 nm and residual 355 nm light were not separated before entering the imaging chamber, but the residual 355 nm light was not sufficiently intense to effect three-photon ionization of the parent or fragment molecules; this was checked by evacuating the tripling gas cell, which resulted in immediate loss of all observable two-laser signal. The VUV laser has a photon energy of 10.49 eV, which is sufficient to ionize both the parent alkyl iodides and their primary photofragments via non-resonant one-photon ionization. The relevant ionization potentials are listed in Table 1. When employing universal VUV ionization, both the I and I* fragments are imaged simultaneously, as they have the same mass and are therefore not separated by their time of flight. In some experiments, the two fragments were imaged separately by using a (2 + 1) REMPI scheme in place of VUV ionization in order to ionize and subsequently detect only one of the fragments. In these one-laser experiments, the dye laser beam was used both to photolyse the parent molecule and to ionize the chosen fragments. The chosen (one-photon) wavelengths of 266.5 nm and 266.6 nm have been employed previously for the REMPI detection of I and I* by Tang et al.41
All laser beams were linearly polarised, with their respective electric field vectors aligned parallel to the plane of the imaging detector. Switching the polarisation of the probe laser had no observable effect on the images, implying that product angular momentum alignment does not need to be considered when analysing the images.4
On each laser pump–probe cycle, the ionized parent molecules and nascent fragments were velocity-mapped via a 482 mm flight tube onto a position-sensitive imaging detector consisting of a pair of chevron 40 mm microchannel plates (MCPs) coupled to a P47 phosphor screen (Photonis). The resulting images were captured using an intensified CCD camera (Photonic Science MiniIDI). A photomultiplier recorded the total light intensity emitted from the phosphor as a function of time, yielding the time-of-flight mass spectrum of the ions generated on each laser cycle. To record time-of-flight spectra with higher resolution, not limited by the ∼100 ns decay lifetime of the P47 phosphor, a 20 ns time-gate applied to the MCPs was stepped across the range of arrival times of interest, and the total ion signal recorded by the camera was logged at each arrival time. The time gating was achieved by applying a 500 V pulse from a high-speed MCP time-gating module (Photek, GM-MCP-2) to the MCPs to bring them up to optimum operating potential. The same gating unit was used to time-gate the MCPs for acquisition of images for individual ion masses.
Time-of-flight spectra and images were accumulated over several thousand experimental cycles. Data recorded over a similar number of cycles but with only one or other of the lasers entering the interaction region were also acquired, and were subsequently subtracted from the two-laser data in order to obtain the true two-colour pump–probe signal. The images were processed using a polar onion-peeling algorithm in order to extract the central slice through the three-dimensional photofragment velocity distribution,54 from which the product translational energy distribution could be determined. Total translational energies, ET, were obtained by scaling the experimentally-derived kinetic energy of the detected fragment ion, X+, by the mass factor mM/(mM − mX), where mM is the mass of the parent molecule. Note that Fan and Pratt5 have shown previously that at VUV photon energies 1–2 eV above the ionization threshold, the ionization step is relatively insensitive to the internal state of the alkyl fragment. The product translational energy distributions obtained from the alkyl fragment and iodine atom images can therefore be compared directly.
4 Results & discussion
4.1 Time-of-flight mass spectra
Fig. 3 shows representative two-colour time-of-flight mass spectra for the products of (a) methyl iodide photolysed at 240 nm and (b) ethyl iodide photolysed at 257.6 nm (pump-only and probe-only signals have been subtracted from the data, as outlined in Section 3). Universal single-photon VUV ionization of the photofragments was employed in both cases. The methyl iodide spectrum contains peaks for iodine at m/z = 127 and methyl radical (CH3) at m/z = 15, along with a small parent ion peak at m/z = 142, indicating that C–I bond fission is the sole dissociation channel following excitation in this wavelength region. The ethyl iodide spectrum also reveals C–I bond fission products, in this case iodine at m/z = 127 and ethyl radical, C2H5 at m/z = 29. In addition, small signals are seen at m/z = 28 and m/z = 27, corresponding to the C2H4+ and C2H3+ ions. These minor ions almost certainly result from H or H2 loss either from the neutral or (perhaps more probably) the ionized ethyl fragment as a result of a high degree of internal excitation during the photofragmentation process. In the remainder of this article, we will focus solely on the C–I bond fission channel. | ||
| Fig. 3 Two-colour time-of-flight mass spectra for photofragments arising from: (a) methyl iodide photolysis at 240 nm; and (b) ethyl iodide photolysis at 257.6 nm. | ||
4.2 Photofragment translational energy and angular distributions
 | ||
| Fig. 4 Photofragment total translational energy distributions following methyl iodide photolysis at (a) 240 nm and (b) 266 nm. The vertical dashed lines indicate the maximum translational energy release for the I and I* channels, calculated using the CH3–I bond dissociation energy of 2.39 eV determined by Zhu et al.39 | ||
Note that cluster formation, space-charge effects, or product angular momentum polarisation could also affect the relative intensities of the observed I and I* signals, but we have systematically ruled out any contributions from these effects.
We now consider the photofragment kinetic energy distributions in some detail. The lowest energy peak (appearing at ET = 1.8 eV in the distributions arising from 240 nm photolysis) is assigned to the CH3 + I* product channel, with the two higher energy peaks at 2.29 eV and 2.7 eV assigned to CH3(v1 = 1) + I and CH3(v = 0) + I, respectively, with v1 = 1 denoting one quantum of excitation in the CH3 symmetric stretching vibrational mode. These assignments were confirmed by carrying out a separate set of one-laser experiments in which the I and I* fragments were detected state-selectively via (2 + 1)REMPI near 266 nm, thereby separating the contributions from the I and I* channels.
The widths of the peaks in the photofragment total translational energy distribution for methyl iodide may be accounted for by excitation of up to two quanta in the ν2 (umbrella bend) vibrational mode of the CH3 radical. The larger degree of excitation in methyl products formed in conjunction with ground-state iodine is thought to be associated with the two possible formation mechanisms for these products, either directly via excitation to the 1Q1 state, or indirectly via non-radiative transfer to this state from the 3Q0 state.20 For example, based on detailed ab initio calculations of the potential energy surfaces involved in the dissociation, Amamatsu et al.57 predicted that the sudden change in reaction coordinate from 3Q0 to 1Q1via a conical intersection is likely to channel considerably more of the excess energy into internal excitation of the methyl fragment than direct dissociation on the 1Q1 state.
Comparing the measured translational energies with the maximum theoretically possible for each fragmentation channel, as indicated by the vertical dashed lines in Fig. 4, indicates that the majority of the available energy is released into product translation for both the I and I* channels. This is also true at the longer photolysis wavelength of 266 nm: the same three peaks are observed in the total translational energy distribution at this wavelength, but are shifted to lower translational energy, reflecting the reduction in the available energy. At both wavelengths, the measured distributions extend up to and even slightly beyond the theoretical maxima. The calculated maxima do not account for any internal excitation in the parent molecule, so the fact that the measured photofragment kinetic energy distributions extend to slightly higher energies than predicted most probably indicates the presence of a small fraction of vibrationally excited CH3I in the molecular beam, which is not cooled efficiently in the supersonic expansion.
The A-band photodissociation of CH3I has been studied in detail by Eppink and Parker,20,30 who employed REMPI detection to ionize either the CH3 or the iodine photofragment state-selectively, before recording velocity-map images of the relevant fragment. The results of the present study with regard to energy partitioning amongst the products are in good agreement with the conclusions drawn from the earlier study. Eppink and Parker observed that the product vibrational energy is primarily partitioned into the umbrella bending mode of CH3, and at the higher photolysis energies employed in the present work, they also observed a proportion of CH3 photofragments formed with one quantum of excitation in the ν1 symmetric stretching mode.
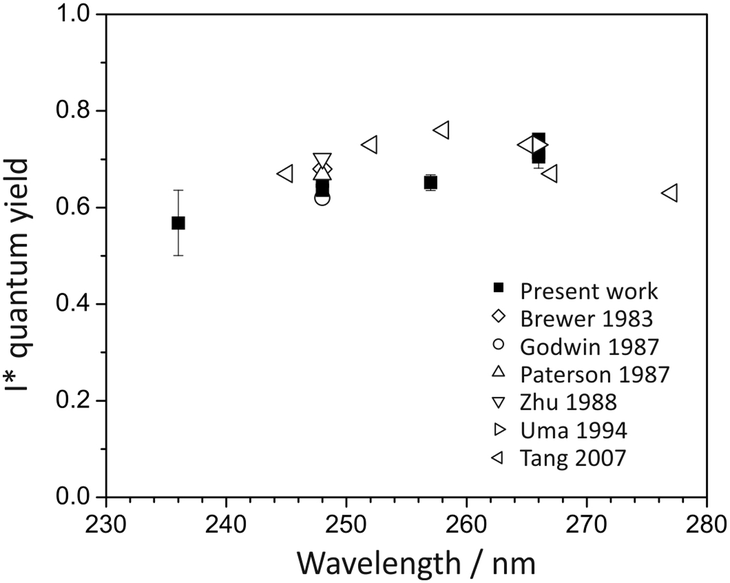
The quantum yields for production of I and I* products may be defined as ϕ(I) = [I]/([I] + [I*]) and ϕ(I*) = [I*]/([I] + [I*]), with [I] and [I*] the signal contributions from ground-state and spin–orbit-excited atomic iodine. These were determined from the data by fitting the measured total translational energy distribution obtained from the CH3 images to a sum of three Gaussians in order to determine [I] and [I*]. Our measured quantum yields are compared with those determined in previous studies,20,36,40,58–63 summarised in Fig. 5. For photolysis at 240 nm and 266 nm, we find ϕ(I*) = 0.7 and 0.74, respectively. Direct dissociation of the 3Q0 state to yield spin–orbit-excited iodine dominates the dynamics, with non-radiative transfer to the 1Q1 state and/or direct excitation to the 3Q1 state, both of which correlate with ground-state products, becoming somewhat more important at shorter wavelengths.
 | ||
| Fig. 5 I* quantum yield following methyl iodide photolysis within the A-band.20,36,40,58–63 | ||
The anisotropy parameter, β, characterising the photofragment angular distribution, P(θ), relative to the photolysis laser polarisation vector, is shown in Fig. 6 for photolysis at both 240 nm and 266 nm. In polyatomic molecules, the transition dipole for the excitation step is often neither parallel nor perpendicular to the breaking bond, leading to non-limiting values of β. However, both methyl iodide and ethyl iodide provide simple cases in which A-band excitation can be decomposed into simple parallel (β = 2) and perpendicular (β = −1) components.
 | ||
| Fig. 6 Anisotropy parameters for (a) CH3 + I*, and (b) CH3 + I dissociation channels following methyl iodide photolysis at 240 nm and 266 nm. | ||
The dominant parallel transition to the 3Q0 state leads us to expect β parameters close to 2 for all products, and this is indeed the case. The β parameters determined from images acquired with both single-photon ionization of CH3 and I/I* and with REMPI detection of I and I* are all in good agreement. For the CH3 + I* channel, which proceeds via direct dissociation on the 3Q0 potential energy surface, the β parameter is very close to 2. The β parameter for the CH3 + I channel is slightly lower, at 1.8 ± 0.2 for photolysis at 240 nm and 1.7 ± 0.2 for photolysis at 266 nm. These values reflect the contributions from parallel excitation to the 3Q0 state followed by non-radiative transfer to the 1Q1 state, and direct dissociation via a perpendicular transition to the 1Q1 or 3Q1 states. The relative contributions of these two states to the absorption cross section at the two wavelengths of interest (see Fig. 1(a)) indicate that at 240 nm the perpendicular contribution arises primarily from the 1Q1 state, while at 266 nm both the 1Q1 and 3Q1 states probably contribute. As shown in Fig. 6, these findings are in good agreement with an earlier study by Eppink and Parker.20 The value of β can be used to estimate the relative contributions from the two channels leading to production of ground-state iodine. We estimate from the perpendicular contribution to β that direct dissociation on the 1Q1 state makes a relatively small contribution of ∼7% at a photolysis wavelength of 240 nm, with a combined contribution from the 1Q1 and 3Q1 states of ∼9% at 266 nm.
 | ||
| Fig. 7 Photofragment total translational energy distributions following ethyl iodide photolysis at (a) 248 nm and (b) 266 nm. The vertical dashed lines indicate the maximum translational energy release for the I and I* channels, calculated using the C2H5–I bond dissociation energy of 2.353 eV determined by Paterson et al.38 | ||
 | ||
| Fig. 8 (a) REMPI spectrum for atomic iodine around 266 nm. I and I* resonances at 37524 cm−1 and 37505 cm−1, respectively, are indicated, along with the corresponding one-colour images for the I and I* fragments from ethyl iodide photolysis. The polarization of the laser was vertical in-the-plane of the image. (b) The total translational energy distributions of I (green) and I* (purple) obtained from the corresponding images (left). The ET distribution obtained from the image of C2H5, detected by means of single-photon non-resonant ionization, is shown as the black dashed line. | ||
The peaks in the total translational energy distributions for the products of ethyl iodide photolysis appear at energies considerably lower than the maximum possible translational energies for each channel (indicated by vertical dashed lines in Fig. 7), in contrast to the corresponding distributions for methyl iodide photolysis products, and are also considerably broader than in the case of methyl iodide. Both of these observations imply that considerably more energy is released into internal degrees of freedom of the molecular (ethyl) cofragment in the case of ethyl iodide photolysis than is the case for methyl iodide photolysis. In addition to the data shown for 248 nm and 266 nm photolysis, images were also recorded at 236 nm and 257 nm. The most probable fraction fT of available energy released into product translation at each wavelength is shown in Table 2. This fraction appears to be relatively independent of wavelength, with a value of around 0.68 for the channels yielding ground-state iodine, and 0.78 for the channel yielding spin–orbit excited iodine. Ethyl fragments formed with a ground state iodine co-product are therefore born with a significantly greater degree of internal excitation than those formed with spin–orbit excited iodine. These observations are in agreement with earlier studies by Tang et al.,41 in which the various photoproducts were detected state-selectively, and with the 266 nm study of Fan and Pratt,5 which employed VUV ionization for detection of the photofragments. The different internal energy distributions for ethyl radicals formed with I and I* co-products are likely to result from the change in reaction coordinate in the subset of ethyl iodide molecules undergoing the non-radiative transfer mechanism during dissociation to yield ground-state iodine. Recall that in methyl iodide the analogous non-radiative transfer process leads to significant production of CH3 symmetric-stretch-excited methyl products, which is clearly assignable as an additional peak in the total translational energy distributions.
| λ/nm | f T | |||||
|---|---|---|---|---|---|---|
| I channel | I* channel | |||||
| This work | Tang (2007) | Fan (2005) | This work | Tang (2007) | Fan (2005) | |
| 236 | 0.68 | 0.77 | ||||
| 245 | 0.72 | |||||
| 248 | 0.68 | 0.79 | ||||
| 251.5 | 0.73 | |||||
| 257 | 0.71 | 0.79 | ||||
| 258.4 | 0.62 | 0.72 | ||||
| 266 | 0.65 | 0.65 | ∼0.65 | 0.78 | 0.74 | ∼0.74 |
| 277.4 | 0.74 | |||||
| 277.9 | 0.63 | |||||
| 282.4 | 78.9 | |||||
In the earlier work of Tang et al.,41 interpretation of the experimental data was complicated by the fact that the high laser intensities required for REMPI detection of the products yielded a competing channel involving multiphoton dissociative ionization of C2H5I. The resulting C2H5+ ions obscured the low-energy part of the total translational energy distribution for C2H5 arising from the neutral dissociation process, though the complementary data for the I and I* products allowed the competing neutral and ionic fragmentation channels to be distinguished. In the present study, and in the 266 nm photolysis study of Fan and Pratt,5 the use of single-photon VUV detection eliminates the multiphoton ionization pathway and allows the total translational energy distribution for the neutral dissociation pathway to be measured directly.
Quantum yields for I and I* production were determined in the same way as for methyl iodide (see Section 4.2.1), and the results are shown in Fig. 9. In agreement with most previous studies,19,37–41 the quantum yield of I* decreases steadily with increasing photolysis energy, from 0.74 at 266 nm, to 0.6 at 257 and 248 nm, to 0.57 at 236 nm. The decrease in I* yield, and corresponding increase in I yield, may reflect either the increase in the relative contribution from absorption to the 1Q1 state with decreasing wavelength, or an increasing probability of non-radiative transfer from the 3Q0 state to the 1Q1 state. At longer wavelengths some ground-state atomic iodine is also likely to be formed via direct dissociation on the 3Q1 state. The quantum yields for I* measured in the present study are in good agreement with those obtained by Tang et al.47 at 266 nm, but are somewhat lower in the region from ∼254–262 nm. However, they are in agreement with other studies of C2H5I photolysis19,37–40 at wavelengths of 240 nm and 266 nm.
 | ||
| Fig. 9 I* quantum yield following ethyl iodide photolysis within the A-band. | ||
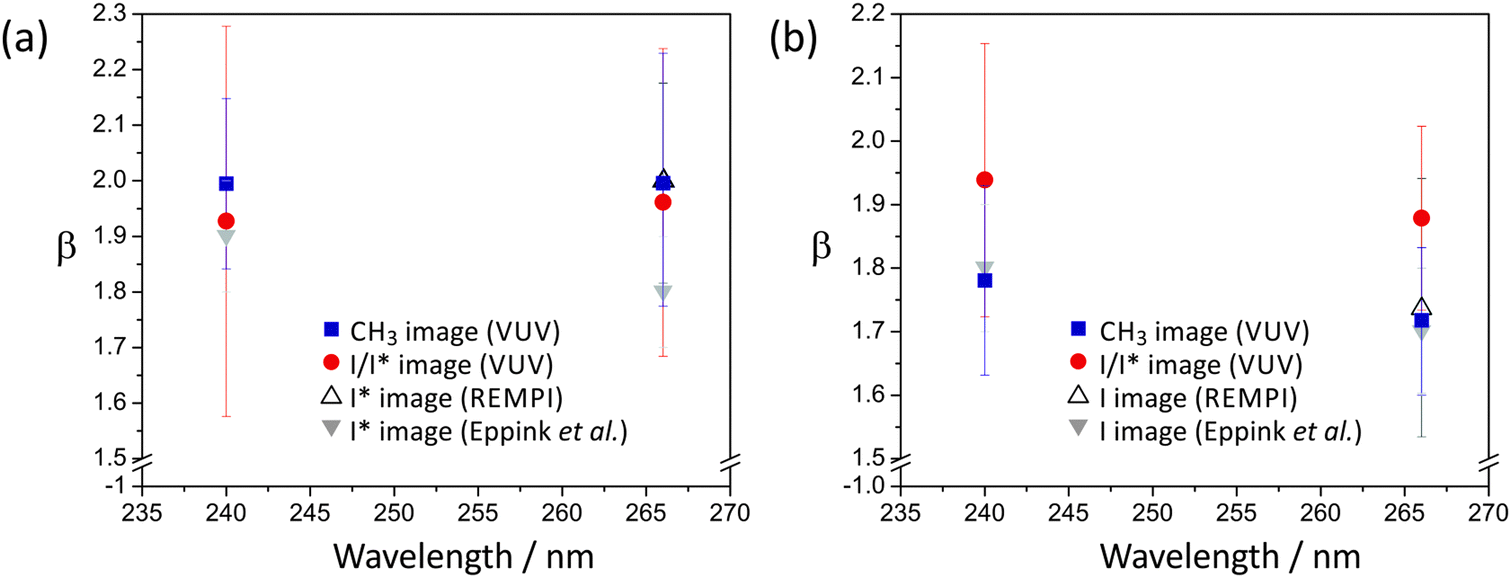
The anisotropy parameters, β, for the I and I* channel at each of the photolysis wavelengths employed for ethyl iodide are shown in Fig. 10. While the values determined from the C2H5 images, the I/I* images recorded using single-photon ionization, and the I and I* images recorded using REMPI detection all agree within experimental error, the I/I* images recorded using single-photon ionization systematically return lower β parameters than the others. This may indicate a small amount of signal saturation in the I/I* images as a result of the high detection efficiency at 118 nm.
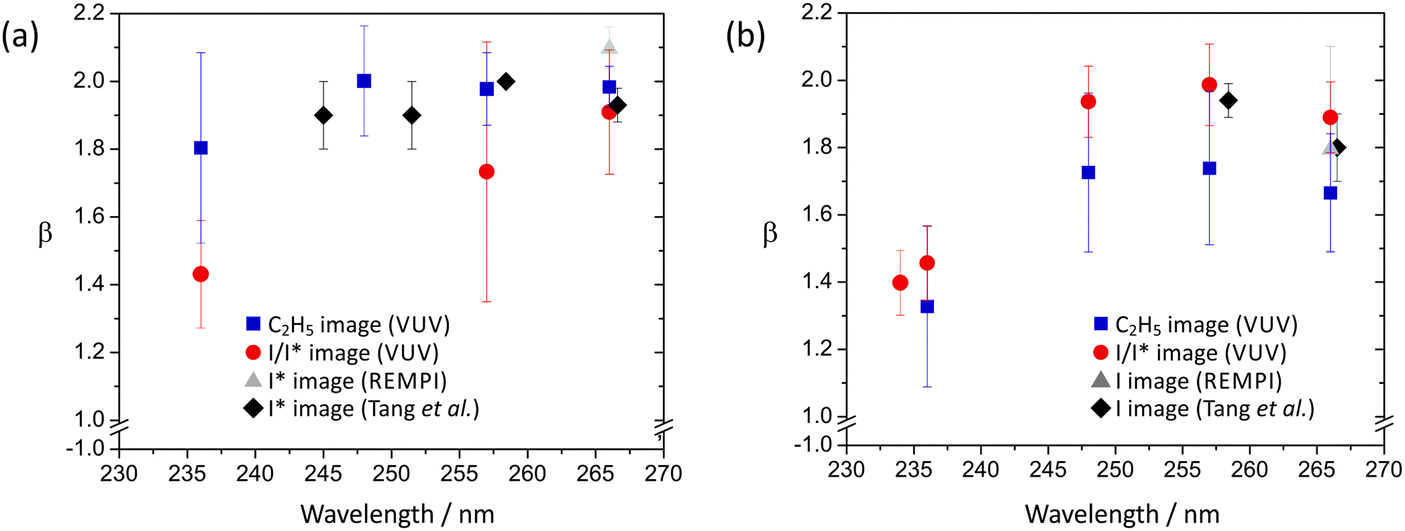 | ||
| Fig. 10 Anisotropy parameters for (a) C2H5 + I*, and (b) C2H5 + I dissociation channels following ethyl iodide photolysis at wavelengths in the UV. Note the expanded vertical scale. | ||
As in the case of methyl iodide, the β parameter for the I* channel is somewhat higher than that for the channel forming ground state iodine, for similar reasons, i.e. at the wavelengths studied, the dissociation is dominated by excitation via a parallel transition to a state that can either dissociate directly to give C2H5 + I* products or undergo non-radiative transfer to a state yielding C2H5 + I. At short wavelengths there is also a small contribution to the latter channel from direct dissociation following a perpendicular transition to the higher-lying 1Q1 state, lowering β somewhat. For example, at 236 nm, the shortest wavelength studied, β for the I* channel is reduced to around 1.80. Non-radiative transfer from the latter state to the C2H5 + I* asymptote in the exit channel is also possible.
5 Conclusions
In summary, we have carried out a comprehensive investigation into the photodissociation dynamics of methyl iodide and ethyl iodide at a range of wavelengths within their respective A-band absorptions. with non-resonant single-photon ionization at 118 nm allowing detection and velocity-map imaging of all photofragments. The velocity-map images yield photofragment total translational energy distributions, angular distributions, and branching ratios into the I and I* product channels in good agreement with data from previous studies employing state-resolved detection via REMPI where available.The measured distributions are readily rationalised in terms of three competing dissociation mechanisms, with the relative contributions from each mechanism varying as a function of photolysis wavelength. Within the wavelength region studied, the dominant excitation for both methyl iodide and ethyl iodide is via a parallel transition to the 3Q0 state. This state can either dissociate directly to give an alkyl fragment partnered by a spin–orbit excited iodine atom, or undergo non-radiative transfer to the 1Q1 state to yield an alkyl fragment with ground-state iodine. The latter dissociation channel imparts a higher degree of internal excitation to the alkyl fragment. In the case of methyl iodide this leads to a clearly defined peak in the photofragment translational energy distribution corresponding to CH3 radicals formed with one quantum in the ν1 symmetric stretch excitation, with the widths of the various peaks in the distribution also implying some excitation of the umbrella bending mode. In the case of ethyl iodide the internal excitation of the C2H5 products manifests itself in translational energy distributions peaking well below the maximum ET values allowed by energy conservation. In addition, there are minor fragmentation pathways involving excitation via a perpendicular transition to either the 1Q1 state or the 3Q1 state, on the short-wavelength and long-wavelength sides of the A band, respectively, followed by direct dissociation on these states. Both states dissociate to give a methyl or ethyl fragment partnered by ground-state atomic iodine. The contributions from these states are revealed in the excitation wavelength dependence of both the I/I* quantum yields and the anisotropy parameter, β, of the I atom products.
The lower photon fluxes required for single-photon ionization reduce experimental complications and artefacts arising from multiphoton ionization and fragmentation processes occurring in competition with the process of interest. When used in combination with conventional detection via REMPI, the universal and state-selective detection approaches can provide complementary information which, taken together, yields detailed insight into the dissociation dynamics. As a caveat, one does need to be aware when employing universal detection via VUV ionization that ‘accidental’ resonances can sometimes distort the relative intensities of signals from fragments formed in different quantum states. In the present study, this was shown clearly when comparing contributions to the signals from I and I* fragments. Of course, a further advantage of employing universal detection is that such resonance effects often become apparent when comparing signals from different co-fragments, allowing any ambiguities to be resolved. For example, while the I/I* images noted above could not be used to determine branching ratios into the I and I* product channels, these branching ratios could easily be determined from the images of the methyl or ethyl co-fragment, subject to the assumption that all populated vibrational states of CH3/C2H5 products have very similar ionization cross-sections at 118 nm. The present work reinforces earlier conclusions5–13 regarding the effectiveness of ‘universal’ detection via single-photon ionization for photofragment imaging studies in which all the products of interest are amenable to ionization at the available VUV wavelength.
In the images presented in Fig. 4, 7, and 8, each fragment was imaged separately using a conventional CCD camera, but in the future we intend to harness the full power of multi-mass imaging by coupling the VUV detection scheme with the PImMS (pixel imaging mass spectrometry) multimass imaging detector14–16 in order to obtain images for every fragment on each time-of-flight cycle.
Acknowledgements
The authors gratefully acknowledge funding from the ERC through Starting Independent Researcher Grant 200733 ‘ImageMS’ (to CV), the EPSRC (Programme Grants EP/G00224X/1 and EP/L005913/1) and the Marie Curie Initial Training Network 238671 ‘ICONIC’.References
- A. J. Orr-Ewing, J. Chem. Soc., Faraday Trans., 1996, 92, 881 RSC.
- A. P. Clark, M. Brouard, F. Quadrini and C. Vallance, Phys. Chem. Chem. Phys., 2006, 8, 5591 RSC.
- M. Brouard, R. Cireasa, A. P. Clark, F. Quadrini and C. Vallance, in Atomic polarisation in the photodissociation of polyatomic molecule, of Gas-phase molecular reaction and photodissociation dynamics, ed. P. Kleiber and K. C. Lin, Research Signpost, 2007, pp. 267–232, ISBN 978-81-7895-305-2 Search PubMed.
- C. Vallance, Phys. Chem. Chem. Phys., 2011, 13, 14427 RSC.
- H. Fan and S. T. Pratt, J. Chem. Phys., 2005, 123, 204301 CrossRef PubMed.
- H. Fan and S. T. Pratt, J. Chem. Phys., 2006, 125, 144302 CrossRef CAS PubMed.
- H. Fan and S. T. Pratt, J. Phys. Chem. A, 2007, 111, 3901 CrossRef CAS PubMed.
- C. A. Taatjes, D. L. Osborn, T. M. Selby, G. Meloni, H. Fan and S. T. Pratt, J. Phys. Chem. A, 2008, 112, 9336 CrossRef CAS PubMed.
- V. A. Shubert, M. Rednic and S. T. Pratt, J. Phys. Chem. A, 2009, 113, 9057 CrossRef CAS PubMed.
- H. Xu and S. T. Pratt, J. Chem. Phys., 2013, 139, 214310 CrossRef PubMed.
- C.-K. Ni, C.-M. Tseng, M.-F. Lin and Y. Dyakov, J. Phys. Chem. B, 2007, 111, 12631 CrossRef CAS PubMed.
- Y. Pan, H. Gao, L. Yang, C. Y. Ng and W. M. Jackson, J. Chem. Phys., 2011, 135, 071101 CrossRef PubMed.
- B. Joalland, Y. Shi, A. D. Estillore, A. Kamasah, A. M. Mebel and A. G. Suits, J. Phys. Chem. A, 2014, 118(40), 9281 CrossRef CAS PubMed , and references therein.
- A. Nomerotski, M. Brouard, E. Campbell, A. Clark, J. Crooks, J. Fopma, J. J. John, A. J. Johnsen, C. S. Slater, R. Turchetta, C. Vallance, E. Wilman and W. H. Yuen, J. Instrum., 2010, 5, C07007 Search PubMed.
- A. Nomerotski, S. Adigun-Boaye, M. Brouard, E. Campbell, A. Clark, J. Crooks, J. J. John, A. J. Johnsen, C. S. Slater, R. Turchetta, C. Vallance, E. Wilman and W. H. Yuen, Nucl. Instrum. Methods Phys. Res., Sect. A, 2011, 633(suppl. 1), S243 CrossRef CAS PubMed.
- A. T. Clark, J. P. Crooks, I. Sedgwick, R. Turchetta, J. W. L. Lee, J. J. John, E. S. Wilman, L. Hill, E. Halford, C. S. Slater, B. Winter, W. H. Yuen, S. H. Gardiner, M. L. Lipciuc, M. Brouard, A. Nomerotski and C. Vallance, J. Phys. Chem. A, 2012, 116, 100897 Search PubMed.
- X. Llopart, R. Ballabriga, M. Campbell, L. Tlustos and W. Wong, Nucl. Instrum. Methods Phys. Res., Sect. A, 2007, 581(1–2), 485 CrossRef CAS PubMed.
- D. W. Chandler and P. L. Houston, J. Chem. Phys., 1987, 87, 1445 CrossRef CAS PubMed.
- F. G. Godwin, P. A. Gorry, P. M. Hughes, D. Raybone, T. M. Watkinson and J. C. Whitehead, Chem. Phys. Lett., 1987, 135(1–2), 163 CrossRef CAS.
- A. T. J. B. Eppink and D. H. Parker, J. Chem. Phys., 1998, 109(12), 4758 CrossRef CAS PubMed.
- A. B. Alekseyev, H.-P. Liebermann, R. J. Buenker and S. N. Yurchenko, J. Chem. Phys., 2007, 126, 234102 CrossRef PubMed.
- A. B. Alekseyev, H.-P. Liebermann and R. J. Buenker, J. Chem. Phys., 2007, 126, 234103 CrossRef PubMed.
- R. S. Mulliken, J. Chem. Phys., 1940, 8(5), 382 CrossRef CAS PubMed.
- R. S. Mulliken, Phys. Rev., 1935, 47(5), 413 CrossRef CAS.
- D. Porret and C. F. Goodeve, Trans. Faraday Soc., 1937, 33, 690 RSC.
- T. F. Hunter and K. S. Kristjansson, Chem. Phys. Lett., 1978, 58(2), 291 CrossRef CAS.
- R. K. Sparks, K. Shobatake, L. R. Carlson and Y. T. Lee, J. Chem. Phys., 1981, 75(8), 3838 CrossRef CAS PubMed.
- M. D. Barry and P. A. Gorry, Mol. Phys., 1984, 52(2), 461 CrossRef CAS.
- A. T. J. B. Eppink and D. H. Parker, Rev. Sci. Instrum., 1997, 68(9), 3477 CrossRef CAS PubMed.
- A. T. J. B. Eppink and D. H. Parker, J. Chem. Phys., 1999, 110(2), 832 CrossRef CAS PubMed.
- M. G. González, J. D. Rodriguez, L. Rubio-Lao, G. A. Garcia and L. Bañares, Phys. Chem. Chem. Phys., 2011, 13(36), 16404 RSC.
- R. de Nalda, J. G. Izquierdo, J. Durá and L. Bañares, J. Chem. Phys., 2007, 126(2), 021101 CrossRef CAS PubMed.
- R. De Nalda, J. Durá, G. A. Garcia, J. G. Izquierdo, J. González-Vázquez and L. Bańares, J. Chem. Phys., 2008, 128(24), 244309 CrossRef PubMed.
- R. A. Boschi and D. R. Salahub, Mol. Phys., 1972, 24(2), 289 CrossRef CAS.
- S. H. Gardiner, T. N. V. Karsili, M. L. Lipciuc, E. Wilman, M. N. R. Ashfold and C. Vallance, Phys. Chem. Chem. Phys., 2014, 16(5), 2167 RSC.
- S. J. Riley and K. R. Wilson, Faraday Discuss. Chem. Soc., 1972, 53, 132 RSC.
- P. Brewer, P. Das, G. S. Ondrey and R. Bersohn, J. Chem. Phys., 1983, 79(2), 720 CrossRef CAS PubMed.
- C. Paterson, F. G. Godwin and P. A. Gorry, Mol. Phys., 1987, 60(4), 729 CrossRef CAS.
- Q. Zhu, J. R. Cao, Y. Wen, J. Zhang, X. Zhong, Y. Huang, W. Fang and X. Wu, Chem. Phys. Lett., 1988, 144(5–6), 486 CrossRef CAS.
- S. Uma and P. K. Das, Can. J. Chem., 1994, 72(3), 865 CrossRef CAS PubMed.
- Y. Tang, W. B. Lee, Z. Hu, B. Zhang and K. C. Lin, J. Chem. Phys., 2007, 126(6), 064302 CrossRef PubMed.
- S. Uma and P. K. Das, J. Chem. Phys., 1996, 104(12), 4470 CrossRef CAS PubMed.
- W. Bi, X. Xu, J. Huang, D. Xiao and Q. Zhu, Sci. China, Ser. B: Chem., 2007, 50(4), 476 CrossRef CAS PubMed.
- X. P. Zhang, W. B. Lee and K. C. Lin, J. Phys. Chem. A, 2009, 113(1), 35 CrossRef CAS PubMed.
- W. S. Hopkins, M. L. Lipciuc, S. H. Gardiner and C. Vallance, J. Chem. Phys., 2011, 135, 034308 CrossRef PubMed.
- A. H. Kung, J. F. Young and S. E. Harris, Appl. Phys. Lett., 1973, 22, 301 CrossRef CAS PubMed.
- A. H. Kung, J. F. Young and S. E. Harris, Appl. Phys. Lett., 1976, 28, 294 CrossRef PubMed.
- G. Bjorklund, IEEE J. Quantum Electron., 1975, 11, 287 CrossRef.
- R. Mahon, T. McIlrath, V. Myerscough and D. Koopman, IEEE J. Quantum Electron., 1979, 15, 444 CrossRef.
- S. G. Lias, Ionization Energy Evaluation, in NIST Chemistry WebBook, ed. P. J. Linstrom and W. G. Mallard, 2013, NIST Standard Reference Database Number 69 Search PubMed.
- J. Tremblay, M. Larzilliere, F. Combet Farnoux and P. Morin, Phys. Rev. A: At., Mol., Opt. Phys., 1988, 38(7), 3804 CrossRef CAS.
- E. Luc-Koenig, C. Morillon and J. Vergès, Phys. Scr., 2007, 12(4), 199 CrossRef.
- S. G. Lias and J. F. Liebman, Ion Energetics Data, in NIST Chemistry WebBook, ed. P. J. Linstrom and W. G. Mallard, 2013, NIST Standard Reference Database Number 69, http://webbook.nist.gov Search PubMed.
- G. M. Roberts, J. L. Nixon, J. Lecointre, E. Wrede and J. R. R. Verlet, Rev. Sci. Instrum., 2009, 80, 053104 CrossRef CAS PubMed.
- J. Berkowitz, C. Batson and G. Goodman, Phys. Rev. A: At., Mol., Opt. Phys., 1981, 24(1), 149 CrossRef CAS.
- U. Fano, Phys. Rev., 1961, 124(6), 1866 CrossRef CAS.
- Y. Amamatsu, S. Yabushita and K. Morokuma, J. Chem. Phys., 1996, 104(24), 9783 CrossRef PubMed.
- W. H. Pence, S. L. Baughcum and S. R. Leone, J. Phys. Chem., 1981, 85, 3844 CrossRef CAS.
- G. N. A. van Veen, T. Boller, A. E. de Vries and N. J. A. van Veen, Chem. Phys., 1984, 87, 405 CrossRef CAS.
- W. P. Hess, S. J. Kohler, H. K. Haugen and S. R. Leone, J. Chem. Phys., 1986, 84(4), 2143 CrossRef CAS PubMed.
- R. Ogorzalek Loo, H. P. Haerri, G. E. Hall and P. L. Houston, J. Chem. Phys., 1989, 90, 4222 CrossRef PubMed.
- K. Kavita and P. K. Das, J. Chem. Phys., 2002, 117, 2038 CrossRef CAS PubMed.
- A. G. Sage, T. A. A. Oliver, D. Murdock, M. B. Crow, G. A. D. Ritchie, J. N. Harvey and M. N. R. Ashfold, Phys. Chem. Chem. Phys., 2011, 13, 8075 RSC.
| This journal is © the Owner Societies 2015 |