 Open Access Article
Fe/Ga-CFA-6 – metal organic frameworks featuring trivalent metal centers and the 4,4′-bipyrazolyl ligand†
Sebastian
Spirkl
a,
Maciej
Grzywa
a,
Christoph S.
Zehe
b,
Jürgen
Senker
b,
Serhiy
Demeshko
c,
Franc
Meyer
c,
Stefan
Riegg
d and
Dirk
Volkmer
*a
aUniversity of Augsburg, Institute of Physics, Chair of Solid State and Materials Science, Universitätsstrasse 1, 86135 Augsburg, Germany. E-mail: dirk.volkmer@physik.uni-augsburg.de; Fax: (+49) 821 598 5955
bUniversity of Bayreuth, Department of Inorganic Chemistry III, Universitätsstraße 30, 95440 Bayreuth, Germany
cGeorg-August-Universität Göttingen, Institute of Inorganic Chemistry, Tammannstraße 4, 37077 Göttingen, Germany
dUniversity of Augsburg, Institute of Physics, Experimental Physics V, Center for Electronic Correlations and Magnetism, Universitätsstraße 1, 86135 Augsburg, Germany
First published on 8th October 2014
Abstract
The synthesis and crystal structures of the new porous coordination polymers M-CFA-6 (M = Ga, Fe) are described. The structure motif of the M-CFA-6 framework (termed Coordination Framework Augsburg University-6, CFA-6) is closely related to that of the MIL-53 due to its octahedrally coordinated metal centers, bridging hydroxyl groups and the bifunctional 4,4′-bipyrazolyl ligand. Structural properties of the compounds were obtained via XRPD and single-crystal diffraction methods. Ga-CFA-6 and Fe-CFA-6 are isomorphous and crystallize in the orthorhombic crystal system within the space group Imma (no. 74), with the following unit cell parameters: Ga-CFA-6, a = 14.8281(16) Å, b = 6.4872(5) Å, c = 11.3503(12) Å, V = 1091.82(19) Å3; Fe-CFA-6·0.6DMAc, a = 14.8424(19) Å, b = 6.6238(9) Å, c = 11.7467(18) Å, V = 1154.9(3) Å3. Coordination polymers M-CFA-6 were characterized by elemental and thermogravimetric analyses. Variable temperature powder X-ray diffraction, diffuse reflectance infrared Fourier transform spectroscopy and BET measurements confirmed the stability of the frameworks up to 250 and 300 °C (Ga-CFA-6 and Fe-CFA-6, respectively) and the porous characters of these compounds. The connectivity of the framework and symmetry of the space group were confirmed by MAS-NMR spectroscopy of Ga-CFA-6. Mössbauer spectroscopy and magnetic measurements were applied to determine the oxidation state of the iron centers in Fe-CFA-6.
Introduction
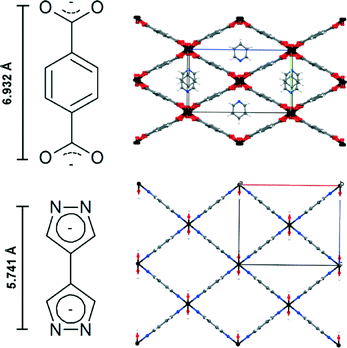
Porous coordination polymers (PCP) and metal–organic frameworks have recently become of interest in materials science due to their unique features, e.g. adjustable pore size, infinite combinations of metal centers and ligands, and precisely defined coordination environments.1,2 Based on these features, several applications such as gas storage, gas separation, gas sensing, heterogeneous catalysis and drug delivery are conceivable.3–7 Several metal organic frameworks incorporating terephthalic acid, e.g. MOF-5, MIL-53 and MIL-101, are described in the literature.8–10 Especially, MIL-53 has been intensively investigated because of its chemical versatility and chemical stability as well as high amplitude of breathing. The “as-synthesized” form of MIL-53 contains guest molecules, which can be removed by heating under vacuum, leading to a distortion of the network structure. This breathing effect may lead to a huge difference in the volume of the elemental cell (ΔV up to ~40%). Based on this effect, the proposed applications for MIL-53 compounds are gas, vapour and liquid phase separation as well as drug delivery.11 The high variability of metal centers in MIL-53 leads to a large family of MIL-53 (MIII) (M = Al, Ga, Fe, Cr, In, Sc, V) compounds.11 Each metal center in MIL-53 is octahedrally coordinated to two hydroxyl groups and four oxygen atoms of deprotonated terephthalic acids. Linear 1D, rhombic channels run along the chains of hydroxyl-bridged metal centers and are interconnected by four molecules of terephthalic acid.9Several PCPs based on the 4,4′-bipyrazolyl (BPZ) motif combined with mono- and bivalent metal atoms have been recently published.12 Here, we report the synthesis and characterization of the new structure motif [MIII(OH)(BPZ)], named M-CFA-6 (Coordination Framework Augsburg University), featuring the 4,4′-bipyrazolyl ligand, octahedrally coordinated trivalent metal centers (MIII = Ga, Fe) and bridging hydroxyl groups, as a pyrazolate-based counterpart to MIL-53. In contrast to the angulated coordination of the terephthalate linkers in MIL-53,9 the pyrazolate linkers in CFA-6 are not distorted. The planar geometry of the pyrazolate ligands assumingly accounts for the higher rigidity of the framework. Hence, breathing effects do not occur as in the case of MIL-53. The volume of the unit cell of MIL-53 (Ga, as/Fe, as) is slightly larger compared to that of Ga-/Fe-CFA-6 (~1400 Å3vs. ~1100 Å3) because of the similar network structure and the size difference of the linker molecules (see Fig. 1).13,14
Moreover, the thermal stability of PCPs based on nitrogen-containing linkers is well known.15,16 Therefore, the thermal stability of Fe-CFA-6 (300 °C) is higher than the stability of MIL-53 (FeIII) (270 °C, rapid decomposition). Assuming the rigid framework, the microporous structure and the relatively high thermal stability of the new compounds, the gas phase separation of small molecules, e.g. branched and unbranched alkanes, should be possible.17,18
The compounds were characterized by single-crystal X-ray diffraction and XRPD techniques. MAS-NMR spectroscopy, FT-IR and DRIFT spectroscopy, UV/Vis/NIR spectroscopy and BET measurements were used to gain additional information not available from diffraction methods. Mössbauer spectroscopy and magnetic measurements were applied to determine the oxidation state of the iron centers.
Experimental
Materials and methods
4,4′-Bipyrazole (H2BPZ) was prepared using a previously reported method.19 All of the other chemicals are commercially available. Further purification was not necessary. The utilized solvents were of analytical grade and used without further purification. Fourier transform infrared (FT-IR) spectroscopy was performed using an ATR unit in the range of 4000 to 400 cm−1 on a Bruker Equinox 55 FT-IR spectrometer. Diffuse reflectance infrared Fourier transform spectroscopy (DRIFTS) was performed under nitrogen in a temperature range between 50 and 600 °C (DRIFTS) covering the spectral range from 4000 to 400 cm−1 employing a Harrick Praying Mantis Diffuse Reflection Accessory. IR bands are declared as broad (br), very strong (vs), strong (s) and weak (w). The elemental composition (C, H, N) of the synthesized compounds was determined using a Perkin-Elmer 2400 elemental analyser. Thermal analysis was performed with a Mettler Toledo TGA/SDTA851 analyzer using platinum crucibles. The samples were heated under nitrogen flow (100 mL min−1) from room temperature to 800 °C at a heating rate of 10 K min−1. Argon sorption measurements of the evacuated samples at 77 K were performed with a Quantachrome Autosorb-1C instrument using high-purity argon (99.999%, Linde AG). Diffuse reflectance UV/Vis/NIR measurements were performed using a Perkin Elmer LAMBDA 750 UV/Vis/NIR Spectrophotometer equipped with a Labsphere 60 mm RSA ASSY integrating sphere. Labsphere Spectralon SRS-99 was used as a reference. The samples (5 mg) were ground with BaSO4 (45 mg) before measurement. Mössbauer spectra were recorded with a 57Co source in an Rh matrix using an alternating constant acceleration Wissel Mössbauer spectrometer operated in the transmission mode and equipped with a Janis closed-cycle helium cryostat. Isomer shifts are given relative to the iron metal at ambient temperatures. Simulation of the experimental data was performed with the Mfit program.20 Determination of the magnetic properties was performed with a Quantum Design MPMS-XL SQUID magnetometer by applying field cooling with liquid helium. The external field accounted for H = 1000 Oe.Solid-state NMR experiments
1H and 13C chemical shifts are referenced to TMS. For 71Ga an aqueous solution of Ga(NO3)3 was used. The 15N chemical shifts are reported relative to nitromethane, where all values shift by −380.5 ppm compared to liquid NH3. All experiments were performed in a 3.2 mm triple resonance probe with a Bruker Avance III HD spectrometer, where the field strength was B0 = 9.4 T. The spin rate for magic angle spinning was set to νrot = 10![[thin space (1/6-em)]](https://www.rsc.org/images/entities/char_2009.gif) 000 ± 2 Hz for all of the experiments.
000 ± 2 Hz for all of the experiments.
The 13C/15N cross polarisation (CP)21 spectra were recorded using a ramped lock pulse consisting of 100 intervals with a linear decrease from 66/54 kHz to 33/27 kHz on the 1H channel. The contact time was set to 3/5 ms and the power to 61/50 kHz for 13C/15N. Proton broadband decoupling was achieved using a SPINAL-6422 sequence during acquisition where the nutation frequency was set to 73 kHz.
For the DUMBO experiments on 1H the DUMBO pulse length was set to 29.5 μs and the nutation frequency to 100 kHz. The total window length between the DUMBO pulses was adjusted to 5.8 μs including a dead time delay of 2.5 μs before acquisition.23
The 71Ga Hahn echo experiment was performed using a nutation frequency of νnut = 18 kHz for the 90° pulse with an echo delay of 29 μs.
(VT-)X-ray powder diffraction
For the XRPD study, a portion of the sample was powdered with an agate mortar and pestle and was deposited in the hollow of a zero-background sample holder. Diffraction data were collected in the 2θ range of 5–65° with 0.02° step width, with a time of 3.5 s per step, using a Seifert XRD 3003 TT diffractometer equipped with a Meteor 1D detector (40 kV, 40 mA, Cu Kα (λ = 1.54178 Å)).VT-XRPD measurements were performed using a Bruker D8 Advance instrument. The samples were ground in an agate mortar and loaded into quartz capillaries (Hilgenberg) with 0.5 mm diameter and 0.01 mm wall thickness. The patterns were recorded in a temperature range of 30 to 500 °C, in the 5–60° 2θ range, with a step time of 1 s and a step width of 0.02° 2θ. Temperature program between measurements: 0.5 °C s−1 heating rate, then 10 min isotherm.
Syntheses
Powder and single-crystal X-ray diffraction investigations
Prior to the XRPD X-ray measurement, a sample of Ga-CFA-6 was heated at 250 °C under vacuum for 4 h to remove occluded solvent molecules. A crystalline sample of Ga-CFA-6 was ground using an agate mortar and pestle, and the fine powder was deposited in the hollow of a zero-background sample holder. X-ray diffraction data were collected in the 2θ range of 5–90° with 0.02° step width, with a time of 6 s per step, using a Seifert XRD 3003 TT diffractometer equipped with a Meteor 1D detector. The final coordinates from the Fe-CFA-6·0.6DMAc structure were applied as a starting model for the Rietveld refinement of Ga-CFA-6. The positions of the oxygen atoms from water molecules were determined from difference Fourier maps. The Rietveld refinement was carried out using the Jana2006 program.24 Weak geometric restraints on bond distances were used during the refinement process. The experimental details and crystal data for Ga-CFA-6 are listed in Table 1. The final Rietveld refinement plots are presented in Fig. S1 (ESI†).| a R 1 = ∑||F0| − |Fc||/∑|F0|. b wR2 = {∑[w(F02 − Fc2)2]/∑[w(F02)2]}1/2. | ||
|---|---|---|
| Chemical formula | GaN4C6OH5·2H2O | FeN4C6OH5·0.6C4H9NO |
| Formula weight/g mol−1 | 254.89 | 257.26 |
| T/K | 293(2) | 100(2) K |
| Diffractometer | Seifert XRD 3003 TT | Bruker D8 Venture |
| XRPD: 2θ range/°, step size; SCXRD: θ range/° | 5–90, 0.02 | 2.74–26.38 |
| X-ray source, wavelength/Å | Cu Kα, λ = 1.54178 | Mo Kα, λ = 0.71073 |
| Crystal system | Orthorhombic | Orthorhombic |
| Space group | Imma (no. 74) | Imma (no. 74) |
| a/Å | 14.8281(16) | 14.8424(19) |
| b/Å | 6.4872(5) | 6.6238(9) |
| c/Å | 11.3503(12) | 11.7467(18) |
| V/Å3 | 1091.82(19) | 1154.9(3) |
| Z, calculated density/g cm−3 | 4, 1.5501 | 4, 1.484 |
| Number of observations | 3000 | — |
| Unique reflections | 123 | — |
| R p | 6.04 | — |
| R wp | 8.51 | — |
| Reflections total | — | 4549 |
| Reflections unique | — | 670 |
| Completeness/% | — | 99.3 |
| h, k, l ranges | — | −16 ≤ h ≤ 18; −8 ≤ k ≤ 8; −14 ≤ l ≤ 14 |
| R int | — | 0.1086 |
| R 1 (I > 2σ(I))a | — | 0.0475 |
| wR2 (all data)b | — | 0.1165 |
| GooF | — | 1.040 |
| Data/restraints/parameters | — | 670/0/33 |
| Largest diff. peak and hole/e− Å−3 | — | 0.599 and −0.592 |
A single crystal of Fe-CFA-6·0.6DMAc of approx. dimensions 38 μm × 21 μm × 20 μm was taken from the mother liquid mounted on a MiTeGen MicroMount and measured using a Bruker D8 Venture diffractometer. Intensity measurements were performed using monochromated (doubly curved silicon crystal) Mo Kα radiation (0.71073 Å) from a sealed microfocus tube. Generator settings were 50 kV and 1 mA.
The data collection temperature was −173 °C. The frame width was 0.5°. APEX2 software was used for preliminary determination of the unit cell.25 Determination of integrated intensities and unit cell refinement were performed using SAINT.26 The integration of the data using an orthorhombic unit cell yielded a total of 4549 reflections to a maximum θ angle of 26.38° (0.80 Å resolution), of which 670 were independent (average redundancy 6.790, completeness = 99.3%, Rint = 10.86%, Rsig = 6.89%) and 512 (76.42%) were greater than 2σ(F2). The final cell constants, a = 14.8424(19) Å, b = 6.6238(9) Å, c = 11.7467(18) Å, and volume = 1154.9(3) Å3 are based upon the refinement of the XYZ-centroids of reflections above 20σ(I). The structure was solved and refined using the Bruker SHELXTL software package,27 using the space group Imma (no. 74), with Z = 4 for the formula unit C8.4H10.4FeN4.6O1.6. The final anisotropic full-matrix least-squares refinement on F2 with 33 variables converged at R1 = 4.75% for the observed data and wR2 = 11.65% for all data. The goodness of fit was 1.04. The largest peak in the final difference electron density synthesis was 0.599 e− Å−3 and the largest hole was −0.592 e− Å−3 with an RMS deviation of 0.108 e− Å−3. On the basis of the final model, the calculated density was 1.480 g cm−3 and F(000) = 527 e−. Selected crystal data and details of structure refinements for Fe-CFA-6 are provided in Table 1. Complete crystallographic data for the structures Ga-CFA-6 and Fe-CFA-6 reported in this paper are available in CIF format from the Cambridge Crystallographic Data Center CCDC 1014603 (Fe-CFA-6) and 1014604 (Ga-CFA-6).
Results and discussion
Syntheses
The compounds Ga-CFA-6 and Fe-CFA-6 were synthesized under solvothermal conditions using trivalent metal salts and 4,4′-bipyrazolyl as the ligand. Single crystals suitable for X-ray measurement of Fe-CFA-6 were obtained by variation of the molar ratios of the ligand, metal salts and base. All efforts to obtain single crystals of the compound Ga-CFA-6 were unsuccessful. Note that larger crystals were obtained by using N-methylformamide. ESEM images of the crystals of Ga-/Fe-CFA-6 are shown in Fig. S2 in the ESI.†Crystal structure analyses
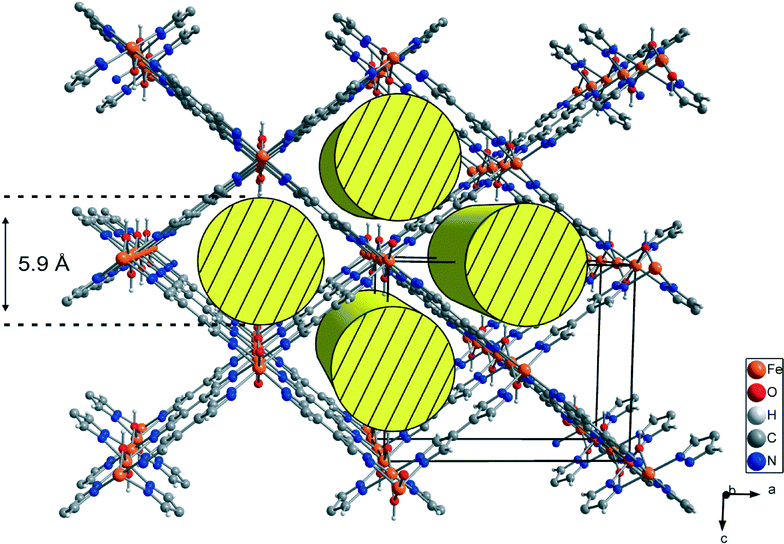
Compounds Ga-CFA-6 and Fe-CFA-6 are isomorphous and crystallize in the orthorhombic crystal system within the space group Imma (no. 74). The asymmetric unit contains one metal ion (Ga in Ga-CFA-6 and Fe in Fe-CFA-6, respectively), one oxygen atom from an OH group, one nitrogen, two carbon atoms and two hydrogen atoms from the BPZ ligand (two oxygen and four hydrogen atoms from water molecules in the case of Ga-CFA-6). The metal ions, oxygen atoms (OH group) and one of the carbon atoms are located on special positions (2/m, mm2 and m, respectively). An ORTEP style plot of the asymmetric unit of Fe-CFA-6 with atom labels is shown in Fig. S3 (ESI†). The metal ions are octahedrally coordinated by four tetradentate BPZ ligands via the nitrogen atoms and two oxygen atoms of the hydroxyl groups. The BPZ ligands and OH groups bridge the metal ions along linear chains of octahedrally coordinated gallium/iron centers propagating in the b direction. The 1D chains are connected by BPZ ligands creating a 3D porous framework with one-dimensional channels expanding along the b-direction of the crystal lattice (see Fig. 2). Taking the van der Waals radii of hydrogen atoms (1.2 Å) into account, the channel diameter calculated between the hydrogen atoms of the OH groups is 5.9 Å. Estimation with the program SQUEEZE28 reveals that the initial solvent-accessible void volume is 498.5 Å3, which is 43.2% of the unit cell volume (1154.9 Å3) for a probe radius of 1.68 Å, corresponding to the approximate van der Waals radius of argon.29 In the crystal structure of Ga-CFA-6, the micro-pores are occupied by water molecules from air (compare structure in Fig. S4†), while in the case of Fe-CFA-6·0.6DMAc, the pores are occupied by disordered DMAc molecules. The positions of the DMAc molecules were impossible to resolve and refine from the electron density distribution. According to the crystallographic data there is an electron count of 114 per unit cell, which corresponds to 2.4 DMAc molecules in the unit cell of Fe-CFA-6·0.6DMAc. For DMAc molecules with an approximate van der Waals radius of 2.9 Å, the value of the initial accessible void volume of 308.3 Å3 (26.7% of the unit cell volume) was calculated. Taking into account that the expected volume for one DMAc molecule is 102.2 Å3, the maximal number of DMAc molecules that can fully occupy the pore channels is about 3. The Fe–N and Fe–O distances are 2.100(3) and 1.983(3), respectively, and are in good agreement with those found in pentanuclear FeIII complexes with pyrazolate and hydroxyl bridges published by Meyer et al.30 The atomic coordinates and isotropic thermal parameters, selected bond lengths and angles for Fe-CFA-6·0.6DMAc and Ga-CFA-6 are collected in Tables S1–S2 (Fe) and S3–S4 (Ga) in the ESI.†Phase purity of Ga-CFA-6 and Fe-CFA-6 was confirmed by XRPD measurements under ambient conditions. The experimental XRPD pattern of Fe-CFA-6 was consistent with the simulated pattern obtained from the single-crystal X-ray diffraction data (Fig. S5, ESI†). Differences in peak intensities are due to occluded solvent molecules. Since the powder patterns of Ga-CFA-6 and Fe-CFA-6 show the same peak positions, both frameworks are isomorphous.
Symmetry considerations from solid-state NMR spectroscopy
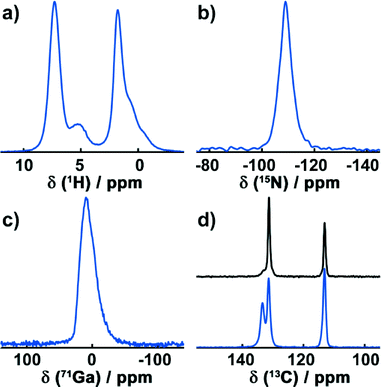
To confirm the results of the crystallographic structure determination of Ga-CFA-6, MAS-NMR techniques were utilized.The high-resolution 1H DUMBO experiment exhibits two distinct signals around 7.3 ppm and 5.1 ppm (Fig. 3a). Furthermore, a group below 4 ppm is present, consisting of a single resonance at 1.8 ppm and two shoulders at 0.83 ppm and 0.36 ppm. The peak at 7.3 ppm is typical for aromatic protons and can be assigned to the pyrazolate rings. The broad signal at 5.1 ppm exhibits a typical shift for hydroxyl groups and is, therefore, caused by the μ-OH groups bridging the gallium atoms.31 The group below 3.5 ppm can finally be assigned to water molecules contained in the pores of the structure.
In the 15N CP spectrum (Fig. 3b), one signal with a chemical shift of −111.3 ppm is visible, arising from the deprotonated aromatic nitrogen atoms.
The 71Ga Hahn echo (Fig. 3c) reveals one distinct signal at 9.6 ppm. Its asymmetric shape can be attributed to quadrupolar interactions with the local electric Ga environment that consists of four equatorial nitrogen atoms and two antipodal oxygen atoms in the octahedral coordination.
1H-13C CP spectra were recorded for the dried sample after exposure to air for several weeks (Fig. 3d, bottom) and for a sample heated to 250 °C under vacuum for 4 hours (Fig. 3d, top). In the 1H-13C CP experiment of the sample exposed to atmospheric moisture, three signals with chemical shifts of 133.4 ppm, 131.4 ppm and 113.1 ppm are present. The signals at 133.4 ppm and 131.4 ppm show a characteristic low-field shift due to nitrogen atoms directly bonded to these carbon atoms. Hence, the signal at 113.1 ppm arises from the two carbon atoms that connect the rings.
Since the asymmetric unit contains one nitrogen and two carbon atoms from the BPZ ligand in addition to one gallium ion, only a single signal for each crystallographically unique group in the 1H, 13C, 71Ga and 15N spectra is expected. This is true for all of the NMR resonances except for the aromatic carbons which are directly bonded to the nitrogen atoms. These exhibit two distinct lines and must therefore be crystallographically inequivalent. In the structure solution obtained, two oxygen atoms of the water molecules and one of the aromatic carbon atoms form an angle of ca. 109° (Fig. S6, ESI†) which is close to the binding angle of 104.5° in a water molecule. This indicates hydrogen bond interactions between the water molecules and with the aromatic ring system, resulting in two different 13C resonances. Since the hydrogen atoms cannot be resolved by powder X-ray diffraction analysis, the structure solution obtained from the powder diffraction data do not take them into account. In order to verify this, a sample of Ga-CFA-6 was heated under vacuum at 250 °C for 4 h to remove any solvent molecules. This reduced the signal at 133.4 ppm drastically while increasing the intensity of the resonance at 131.4 ppm, proving that the latter is caused by an interaction with water molecules.
Thermal analysis
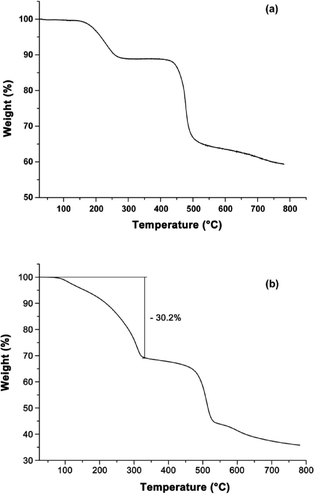
Thermogravimetric analysis (TGA) was performed to study the thermal stability of Ga-CFA-6 and Fe-CFA-6 under nitrogen. The Ga-CFA-6 compound shows a first weight loss between 150 and 250 °C because of the evaporation of solvent molecules (Fig. 4a). A second step in the temperature profile occurs at about 420 °C. At this temperature, the framework irreparably decomposes. The TGA of Fe-CFA-6 reveals two major temperature steps with a plateau between 300 °C and 400 °C (Fig. 4b). At higher temperatures the decomposition of the framework can be monitored by rapid mass loss. The first mass loss for Fe-CFA-6 equals 30.2%, which would be consistent with DMAc molecules leaving the framework (~29.8 wt%). The amount of DMAc molecules obtained by single crystal measurement is lower (Fe-CFA-6·0.6DMAc) than the value obtained from TGA, because a freshly synthesized sample was used for TGA without further drying. All attempts to regenerate the networks by adding solvents were unsuccessful.To confirm the results of the TGA measurements, variable temperature X-ray powder diffraction measurements (VTXRPD) of Ga-CFA-6 and Fe-CFA-6 were performed in air. Changes in the powder patterns first appear above 300 °C (Fig. 5). In the case of Ga-CFA-6 small changes in the unit cell parameters for the sample heated at temperatures 300, 350 and 400 °C are observed (see Table S5†). At 450 °C the decomposition of the compound begins. The Fe-CFA-6 sample exhibits a different behaviour. Substantial differences in the powder pattern are observed at the temperature of 300 °C indicating structural changes of the compound. According to the indexed XRPD pattern, the unit cell volume changes from 1154.9(3) to 838.5(4) Å3 which is connected with shortening of the c lattice constant from 11.7467(18) to 9.069(3) Å. This phase is stable up to 400 °C. Subsequent heating of the sample leads to gradual decomposition of the framework. At 450 °C a new phase, FeO (PDF no. 74-1886), is observed.
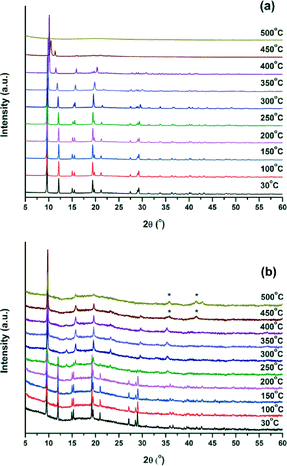 | ||
| Fig. 5 VT-XRPD measurement of Ga-CFA-6 (a) and Fe-CFA-6 (b) from room temperature to 500 °C. Temperature steps of 50 °C were applied. (*) Peaks corresponding to the FeO phase (PDF no. 74-1886). | ||
To gather further information about the thermal stability of Fe-CFA-6 diffuse reflectance, infrared Fourier transform spectroscopy was performed under nitrogen in a temperature range between 50 and 600 °C (Fig. S7 in the ESI†). The DRIFT spectra of Fe-CFA-6 reveal first changes in the connectivity of the framework above 300 °C. Two bands, representing the FeIII–OH stretch, disappear at 3680 and 750 cm−1.32 This is in good accordance with the results from TGA and VTXRPD measurements. At higher temperatures a new IR band appears at 2025 cm−1, possibly representing ketene imines as an intermediate during decomposition of the linker molecule.33 Above 500 °C a very broad band at 580 cm−1 may indicate an Fe–O stretch.32
Thermal analysis of Fe-CFA-6 reveals a 3D structural change of the framework above 250 °C. A change in the connectivity of the framework is detected by DRIFT measurements at temperatures above 300 °C, while the thermogravimetric analysis reveals slow decomposition between 320 °C and 420 °C, resulting in a large mass loss at around 500 °C. FeO is formed according to the diffraction pattern of the VTXRPD measurements due to the decomposition of the organic linker molecules.
BET measurements
To investigate the porous structure of both compounds, the surface areas of Ga-CFA-6 and Fe-CFA-6 were determined by Ar-BET measurements of the evacuated samples at 77 K. The gallium sample was evacuated at 280 °C, and the iron sample was evacuated at 310 °C. Ga-CFA-6 reveals a specific surface area of ~790 m2 g−1, and Fe-CFA-6 showed a specific surface area of ~730 m2 g−1 calculated from the Ar adsorption isotherms (Fig. 6). The pore size distribution calculated from the argon sorption isotherms utilizing a DFT equilibrium model revealed a maximum in the pore size distribution of the compound Ga-CFA-6 located at 5.5 Å. Fe-CFA-6 shows exclusively small pores with a diameter of about 5.7 Å (Fig. 7).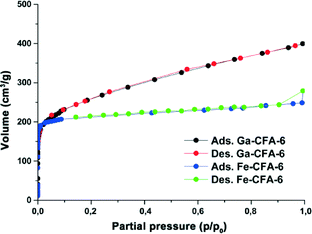 | ||
| Fig. 6 Argon adsorption and desorption isotherms of Ga-CFA-6 (black/red) and Fe-CFA-6 (blue/green) at 77 K. | ||
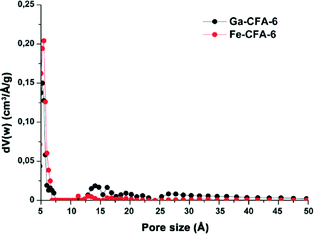 | ||
| Fig. 7 Pore size distribution calculated from the Ar BET measurements of Ga-CFA-6 (black) and Fe-CFA-6 (red) using a DFT equilibrium model. | ||
The pore sizes of Ga/Fe-CFA-6 fit closely to the expected value after removal of the solvent molecules from the pores (Fig. 2). The micro-pore volumes of Ga/Fe-CFA-6 were determined from the adsorption isotherms at a relative pressure p/p0 = 0.25. The pore volumes added up to 0.3298 mL g−1 for Ga-CFA-6 (calculated using PLATON:29 0.3380 mL g−1) and 0.2669 mL g−1 for Fe-CFA-6 (calculated: 0.2263 mL g−1) and reveal similar values to the calculated ones. The resulting void volume of Fe-CFA-6 of 363 Å3 corresponds to 3.5 DMAc molecules which is slightly higher than the value derived from crystallographic data.
Mössbauer spectroscopy and magnetic measurements
The structural properties of Fe-CFA-6 were investigated more deeply to examine whether FeII centers are present in the network. This would lead to a formal negative charge of the compound [FeIIxFeIII1−x(OH)(BPZ)]x−·xOC+. (x < 1; OC = organic cation inside the pores). The source of the organic cations could be decomposed solvent molecules. Thus solvent molecules such as DMAc or DMF might replace the hydroxyl groups, similar to MIL-53(Fe), resulting in the formula [FeIIxFeIII1−x(OH)1−x(BPZ)]·(DMAc)x.14 The determination of the FeII/FeIII ratio via Mössbauer spectroscopy was performed with a sample of Fe-CFA-6 that was heated in chloroform several times to remove weakly bound solvent molecules from the pores without removing ionically bonded cations or bridging DMAc molecules as in MIL-53(Fe). The measurements were performed at low temperatures (80 K) and at room temperature in order to investigate the putative occurrence of spin-crossover effects previously reported for similar dinuclear di-iron(II) complexes with octahedral coordination and bridging pyrazolate ligands.34At 80 K, the sample showed one doublet with isomer shift δ = 0.42 mm s−1 and quadrupole splitting ΔEQ = 0.34 mm s−1. The measurement at room temperature led to the same shape of the spectrum with δ = 0.34 mm s−1 and ΔEQ = 0.35 mm s−1, ruling out the possibility of a temperature-induced spin-crossover effect (Fig. 8). Such Mössbauer parameters are characteristic of either low-spin FeII or high-spin FeIII centers.35
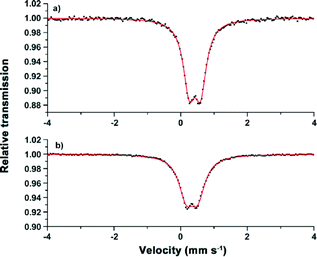 | ||
| Fig. 8 Mössbauer spectra of Fe-CFA-6 recorded at 80 K (a) and 295 K (b). The symmetric shape of the doublet represents either exclusively FeII (LS) or FeIII (HS) centres. | ||
To get further information about the electronic structure of the iron ions in Fe-CFA-6, the magnetic properties of Fe-CFA-6 were studied in the range of 300 to 2 K. The 1/χ curve is shown in Fig. 9. A diamagnetic signal would be expected if low-spin FeII were present, which evidently is not the case. Calculation of the Curie constant C suggests a spin state of 5/2 corresponding to FeIII ions in their high-spin state. Applying a linear fit between 100 and 300 K, according to the Curie–Weiss law, a negative Curie–Weiss temperature of −448.7 K was obtained, indicating an antiferromagnetic coupling between the FeIII centers.
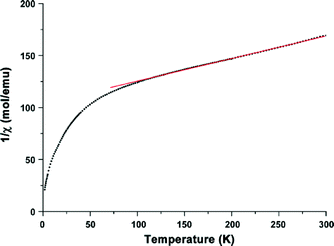 | ||
| Fig. 9 Magnetic properties of Fe-CFA-6 measured from 300 K to 4 K. A linear fit to determine the Curie–Weiss temperature and the Curie constant. | ||
UV/Vis/NIR spectroscopy
The black colour of Fe-CFA-6 might indicate a mixture of FeII and FeIII centers. To investigate the appearance of typical bands of either FeII or FeIII transitions, Fe-CFA-6 was analyzed by diffuse reflectance UV/Vis/NIR spectroscopy. The measurement revealed one broad absorption band covering the complete visible section of the spectrum (Fig. 10). The excitation maximum is located at 570 nm with a shoulder at about 900 nm, caused by the switching of the detectors in the region around 860 nm. At 570 nm, oxygen-to-metal charge transfer transitions are possible for both FeII and FeIII and also IVCT transitions for FeII/FeIII centers.36 Based on the accuracy of the Mössbauer measurements in our studies, the content of FeII centers is below 2–5% for Fe-CFA-6. Hence, the black colour of Fe-CFA-6 may be caused either by oxygen-to-metal CT or intense IVCT of FeII/FeIII centers.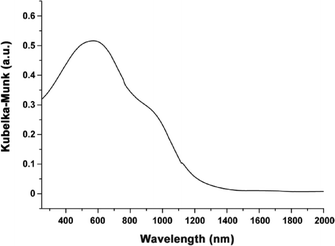 | ||
| Fig. 10 Diffuse reflectance spectrum of Fe-CFA-6 showing an absorption maximum at 570 nm with a shoulder at 900 nm. | ||
Conclusions
The synthesis and characterisation of the new structure motif [MIII(OH)(BPZ)] (CFA-6) were reported in this work. Structural determinations of Ga-CFA-6 and Fe-CFA-6 were performed by single-crystal and X-ray powder diffraction techniques. Further information was obtained by MAS-NMR spectroscopy of the Ga sample. The thermal behaviour was analyzed by thermogravimetric analysis, VT-IR spectroscopy and VT-XRPD measurements. The porous character of the compounds was investigated by argon sorption measurements, revealing surface areas of 790 m2 g−1 (Ga-CFA-6) and 730 m2 g−1 (Fe-CFA-6). Mössbauer spectroscopy and magnetic measurements of Fe-CFA-6 show that FeII ions are not included in the framework within the limits of accuracy of the methods. Moreover, diffuse reflectance UV/Vis/NIR measurements reveal a broad transition in the visible section of the spectrum.The presented CFA-6 is a new family of PCPs closely related to the well-characterised MIL-53 structures. Mutual features of MIL-53 and CFA-6 are their similar thermal stabilities, similar surface areas and similar pore sizes. Differences between the compounds include the breathing behaviour of MIL-53, which the more rigid network of CFA-6 does not demonstrate.
The high thermal stability of CFA-6 (Ga: 400 °C, Fe: 300 °C) combined with rigid, narrow-sized pores might be interesting for the gas chromatographic separation of linear and branched alkanes,17e.g. as filter material for isomerisation reactors.18 Furthermore, the absorption maximum of Fe-CFA-6 and the maximum in the UV/vis spectrum of solar radiation are in the same range and might therefore offer an application in photocatalysis.
Acknowledgements
This work was supported by the German Research Foundation (DFG) within the Priority Program “Porous Metal–Organic Frameworks” (SPP 1362, MOFs). Dr. Björn Bredenkötter is acknowledged for the synthesis of the 4,4′-bipyrazolyl ligand. Dana Vieweg is gratefully acknowledged for performing the magnetic measurements. The authors thank Benjamin Baumgärtner for the acquisition of the ESEM images. Dmytro Denysenko is acknowledged for his help with the BET measurements.Notes and references
- J. Zhang, Y. Zhang, J. Lin and X. Chen, Chem. Rev., 2012, 112, 1001 CrossRef CAS PubMed.
- D. Denysenko, T. Werner, M. Grzywa, A. Puls, V. Hagen, G. Eickerling, J. Jelic and K. Reuter, Chem. Commun., 2012, 48, 1236 RSC.
- Y. E. Cheon and M. P. Suh, Angew. Chem., Int. Ed., 2009, 48, 2899 CrossRef CAS PubMed.
- J. Teufel, H. Oh, M. Hirscher, M. Wahiduzzaman, L. Zhechkov, A. Kuc, T. Heine, D. Denysenko and D. Volkmer, Adv. Mater., 2013, 4, 635 CrossRef PubMed.
- M. D. Allendorf, R. J. T. Houk, L. Andruszkiewicz, A. A. Talin, J. Pikarsky, A. Choudhury, K. A. Gall and P. J. Hesketh, J. Am. Chem. Soc., 2008, 130, 14404 CrossRef CAS PubMed.
- M. Tonigold, Y. Lu, B. Bredenkötter, B. Rieger, S. Bahnmüller, J. Hitzbleck, G. Langstein and D. Volkmer, Angew. Chem., Int. Ed., 2009, 48, 7546 CrossRef CAS PubMed.
- K. Khaletskaya, J. Reboul, M. Meilikhov, M. Nakahama, S. Diring, M. Tsujimoto, S. Isoda, F. Kim, K. Kamei, R. A. Fischer, S. Kitagawa and S. Furukawa, J. Am. Chem. Soc., 2013, 135, 10998 CrossRef CAS PubMed.
- H. Li, M. Eddaoudi, T. L. Groy and O. M. Yaghi, J. Am. Chem. Soc., 1998, 120, 8571 CrossRef CAS.
- T. Loiseau, C. Serre, C. Huguenard, G. Fink, F. Taulelle, M. Henry, T. Bataille and G. Férey, Chem. – Eur. J., 2004, 10, 1373 CrossRef CAS PubMed.
- G. Férey, C. Mellot-Draznieks, C. Serre, F. Millange, J. Dutour, S. Surblé and I. Margiolaki, Science, 2005, 309, 2040 CrossRef PubMed.
- F. Nouar, T. Devic, H. Chevreau, N. Guillou, E. Gibson, G. Clet, M. Daturi, A. Vimont, J. M. Grenèche, M. I. Breeze, R. I. Walton, P. L. Llewellyn and C. Serre, Chem. Commun., 2012, 48, 10237 RSC.
- C. Pettinari, A. Tăbăcaru, I. Boldog, K. V. Domasevitch, S. Galli and N. Masciocchi, Inorg. Chem., 2012, 51, 5235 CrossRef CAS PubMed.
- G. Chaplais, A. Simon-Masseron, F. Porcher, C. Lecomte, D. Bazer-Bachi, N. Bats and J. Patarin, Phys. Chem. Chem. Phys., 2009, 11, 5241 RSC.
- T. R. Whitfield, X. Wang, L. Liu and A. J. Jacobson, Solid State Sci., 2005, 7, 1096 CrossRef CAS PubMed.
- J. Zhang and S. Kitagawa, J. Am. Chem. Soc., 2008, 130, 907 CrossRef CAS PubMed.
- D. Denysenko, M. Grzywa, M. Tonigold, B. Streppel, I. Krkljus, M. Hirscher, E. Mugnaioli, U. Kolb, J. Hanss and D. Volkmer, Chem. – Eur. J., 2011, 17, 1837 CrossRef CAS PubMed.
- B. Chen, C. Liang, J. Yang, D. S. Contreras, Y. L. Clancy, E. B. Lobkovsky, O. M. Yaghi and S. Dai, Angew. Chem., Int. Ed., 2006, 45, 1390 CrossRef CAS PubMed.
- Z. R. Herm, B. M. Wiers, J. A. Mason, J. M. van Baten, M. R. Hudson, P. Zajdel, C. M. Brown, N. Masciocchi, R. Krishna and J. R. Long, Science, 2013, 340, 960 CrossRef CAS PubMed.
- I. Boldog, J. Sieler, A. N. Chernega and K. V. Domasevitch, Inorg. Chim. Acta, 2002, 338, 69 CrossRef CAS.
- E. Bill, Mfit program, Max-Planck Institute for Chemical Energy Conversion, Mülheim/Ruhr, Germany, 2008 Search PubMed.
- S. R. Hartmann and E. L. Hahn, Phys. Rev., 1962, 128, 2042 CrossRef CAS.
- B. M. Fung, A. K. Khitrin and K. Ermolaev, J. Magn. Reson., 2000, 142, 97 CrossRef CAS PubMed.
- D. Sakellariou, A. Lesage, P. Hodgkinson and L. Emsley, Chem. Phys. Lett., 2000, 319, 253 CrossRef CAS.
- V. Petricek, M. Dusek and L. Palatinus, 2006, Jana2006, Structure Determination Software Programs, Institute of Physics, Praha, Czech Republic, 2006 Search PubMed.
- APEX2 Version 2013.1, Bruker AXS Inc., Karlsruhe, Germany, 2013 Search PubMed.
- SAINT Version 8.32B, Bruker AXS Inc., Karlsruhe, Germany, 2013 Search PubMed.
- (a) G. M. Sheldrick, Acta Crystallogr., Sect. A: Found. Crystallogr., 2008, 64, 112 CrossRef CAS PubMed , XS Version 2013/1; (b) G. M. Sheldrick, Acta Crystallogr., Sect. A: Found. Crystallogr., 2008, 64, 112 CrossRef CAS PubMed , XL Version 2013/3.
- A. L. Spek, J. Appl. Crystallogr., 2003, 36, 7 CrossRef CAS.
- Quantachrome Autosorb, Version 1.56, Quantachrome GmbH & Co. KG, Odelzhausen, Germany, 2009 Search PubMed.
- S. Fischer, S. Demeshko, S. Dechert and F. Meyer, Z. Anorg. Allg. Chem., 2012, 638, 621 CrossRef CAS.
- J. Wack, R. Siegel, T. Ahnfeldt, N. Stock, L. Mafra and J. Senker, J. Phys. Chem. C, 2013, 117, 19991 CAS.
- X. Wang and L. Andrews, J. Phys. Chem. A, 2006, 110, 10035 CrossRef CAS PubMed.
- M. Hesse, H. Meier and B. Zeeh, in Spektroskopische Methoden in der organischen Chemie, Thieme, Stuttgart, New York, 6th edn, 2002, ch. 2, pp. 46–55 Search PubMed.
- K. Nakano, N. Suemura, S. Kawata, A. Fuyuhiro, T. Yagi, S. Nasu, S. Morimoto and S. Kaizaki, Dalton Trans., 2004, 982 RSC.
- P. Gütlich, E. Bill and A. X. Trautwein, in Mössbauer Spectroscopy and Transition Metal Chemistry, Springer-Verlag, Berlin Heidelberg, 2011 Search PubMed.
- R. Bosînceanu and N. Suliţanu, J. Optoelectron. Adv. Mater., 2008, 10, 3482 Search PubMed.
Footnote |
| † Electronic supplementary information (ESI) is available: Rietveld refinement plots for Ga-CFA-6, asymmetric unit of Fe-CFA-6, atomic coordinates and isotropic thermal parameters, selected bond lengths and angles for Fe-CFA-6 and Ga-CFA-6. CCDC 1014603 and 1014604. For ESI and crystallographic data in CIF or other electronic format see DOI: 10.1039/c4ce01583e |
| This journal is © The Royal Society of Chemistry 2015 |

