 Open Access Article
Creative Commons Attribution 3.0 Unported Licence
Growth of an oriented Bi40−xInxTe60 (x = 3, 7) thermoelectric material by seeding zone melting for the enhancement of chemical homogeneity
Dongmei
Liu
*a,
Hannes
Engelhardt
a,
Xinzhong
Li
ab,
Andrea
Löffler
a and
Markus
Rettenmayr
a
aOtto Schott Institute of Materials Research, Friedrich Schiller University, Löbdergraben 32, D-07743 Jena, Germany. E-mail: dongmei.liu@uni-jena.de; Tel: +49(0)3641 947798
bSchool of Materials Science and Engineering, Harbin Institute of Technology, 150001 Harbin, PR China
First published on 27th June 2014
Abstract
A zone melting technique with seeding has been developed to prepare oriented Bi40−xInxTe60 (at%, x = 3; 7) thermoelectric material with enhanced chemical homogeneity. The respective initial compositions of the sample and the seed were chosen according to the pseudo-binary Bi2Te3–In2Te3 phase diagram that was experimentally redetermined with the aid of a former mushy zone that was resolidified in a temperature gradient. An oriented Bi40−xInxTe60 bulk material with a uniform composition close to the target value over the entire length of the zone-melted region along the growth direction has been successfully manufactured.
1. Introduction
Bismuth telluride (Bi2Te3) crystallizes in a rhombohedral lattice and exhibits a layered structure consisting of five individual atomic layers in the sequence Te(1)–Bi–Te(2)–Bi–Te(1) perpendicular to the c-axis in the unit cell. Bi2Te3-based materials are the most prominent thermoelectric materials operating near room temperature. Possible methods for producing Bi2Te3-based materials include different varieties of directional solidification and powder sintering using milling, hot pressing and so on. Among these methods, directional solidification, based on, e.g. zone melting, and Bridgman and Czochralski growth methods, can produce a thermoelectric material exhibiting better thermoelectric properties than its counterparts prepared by the other methods. This is due to the effective exploitation of the specific anisotropy of the thermoelectric properties generated from the layered structure of the Bi2Te3 crystal, of which the transport properties are best optimized perpendicular to the <001> direction.1–3 Such advantage of directional solidification techniques for anisotropic thermoelectric materials to improve performance has been confirmed again in the SnSe system, in which an unprecedented figure of merit zT = 2.6 has been obtained in SnSe single crystals synthesized by the Bridgman method.4 However, owing to convection instabilities in the melt and to the related inhomogeneous solute redistribution processes during crystal growth, chemical homogeneity in the Bi2Te3-based oriented material is not easy to accomplish.5–11 Such chemical inhomogeneity introduces a variation of the site occupancy in the grown crystal that entails locally less favorable thermoelectric properties or even transformation of the conductivity type from positive to negative along the growth direction of a bulk ingot,10 which would lead to loss of the desired thermoelectric properties.In the present work, a tailored zone melting technique is presented in which a seeding alloy is used to regulate the solute redistribution during zone melting, with the aim of preparing bulk oriented Bi2Te3-based samples with a constant composition over the entire length of the sample. The Bi2Te3–In2Te3 system, in which a multi-scale hierarchical structure from atomic doping12–14 to nanoscale15,16 and mesoscale17 and the accompanying enhanced thermoelectric properties can be generated, is chosen. It is important to note that the thermoelectric properties of Bi40−xInxTe60 (at%) are very sensitive to the In concentration in the range from 0 to 7 at%18 and that inversion of the conductivity type from positive to negative is expected in crystals grown by conventional directional solidification techniques, as has been observed for Bi2Te3 crystals.10 Hence, it is indispensable to precisely control the composition of Bi40−xInxTe60 crystals.
The selection of the composition of the seed crystal for a chosen target composition of the thermoelectric material is crucial for the seeding zone melting technique. Prior work on this alloy system has focused on the maximum solubility of In in Bi2Te3, which is confirmed to be ~8 at%,19,20 and in the quite limited available pseudo-binary Bi2Te3–In2Te3 phase diagrams,20,21 there are conflicting data concerning the solubility of In2Te3 in Bi2Te3. Hence, the liquidus and solidus lines in the Bi2Te3-rich part of the pseudo-binary phase diagram of the Bi2Te3–In2Te3 system were first experimentally reassessed using the temperature and concentration distribution in a former mushy zone that resolidified in a temperature gradient.22–27
2. Experimental
2.1 Annealing of the mushy zone in a temperature gradient
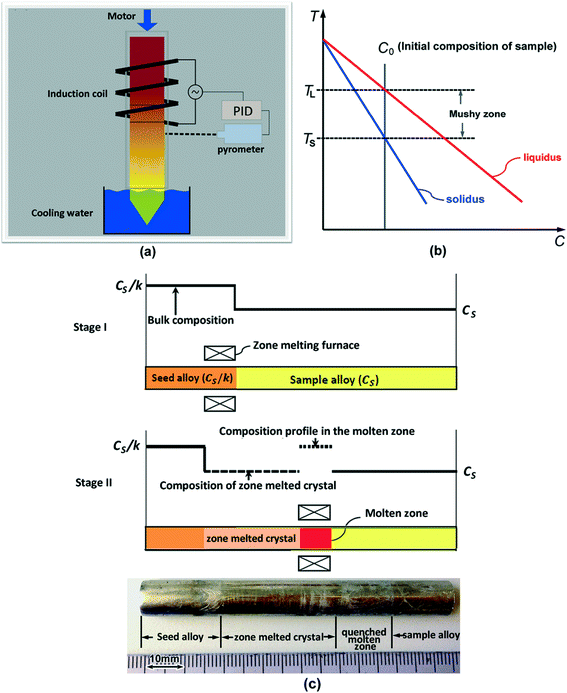
To obtain the major part of the solidus and liquidus lines of the pseudo-binary Bi2Te3–In2Te3 phase diagram, two Bi–In–Te alloys, particularly Bi33In7Te60 and Bi28In12Te60 (at%), were subjected to temperature gradient thermal annealing experiments. Bi28In12Te60 is expected to be in the hypoeutectic composition range. As-cast ingots were produced from pure Bi, Te and In by induction melting in vacuum-sealed quartz, during which strong convection in the melt was stimulated to guarantee overall homogeneity of the as-cast ingot. The dimensions of the samples were ~10 mm in diameter and ~90 mm in length. As-cast rods were then exposed to a steep temperature gradient. A schematic illustration of the experimental set-up is shown in Fig. 1(a). One end of the sample was heated to a temperature above the liquidus temperature and the other end was kept below the solidus temperature, leading to the formation of a mushy zone between the non-melted as-cast zone and the completely melted liquid zone, as illustrated in Fig. 1(b). The mush was held in the temperature gradient for 4 hours to reach complete resolidification of the mushy zone. Due to thermodynamic equilibration in the temperature gradient and the accompanying formation of concentration gradients, upward solute diffusion and further processes such as temperature gradient zone melting (TGZM) occur, and the mushy zone transforms to a completely solid zone with a solute concentration that follows the local solidus concentration.22–27 After complete resolidification of the mushy zone, a longitudinal section of the rod was ground and polished, and the microstructure and composition distribution along the axis direction were determined using scanning electron microscopy (SEM) equipped with energy dispersive spectroscopy (EDS).2.2 Seeding zone melting
In the present work, a seeding zone melting technique was developed aiming to produce Bi33In7Te60- and Bi37In3Te60 (at%)-oriented homogeneous ingots. The seeding zone melting experiments were performed using an experimental set-up that is very similar to that shown in Fig. 1(a). During the zone melting, the ingot consisted of two parts, the seed ingot and the sample ingot, as illustrated in Fig. 1(c). The overall compositions of the sample, CS, and of the seed alloy, CS/k, (where k is the solute redistribution coefficient) were chosen based on the data obtained from the annealing experiments in the temperature gradient. Crystal growth at the trailing edge of the melted zone was processed from the seeding ingot to the sample ingot. During zone melting, the liquid zone was melted by high-frequency induction heating, which at the same time stimulates convection in the liquid through Lorentz forces and lateral temperature gradients, so that a uniform solute concentration distribution in the liquid zone is achieved. The heating and cooling zones are separated by adiabatic Al2O3 plates. The quartz crucible was initially placed in the system such that the boundary between the seed and the sample ingots was located at the top interface between the heating zone and the cooling zone, as shown as stage I in Fig. 1(c). Hence, the zone melting growth proceeds from the seed ingot to the sample ingot. After initial melting, thermal holding for 60 min followed to ensure a planar solid/liquid interface on which uniform crystal growth can be attained. Following these steps, the liquid zone was pulled through the sample at the desired pulling velocity of 2 μm s−1 for a freezing distance of 30 mm. In the proceeding molten zone, a part of the sample ingot of composition CS melts, and simultaneously the same length of the solid phase with equal composition CS solidifies, as shown as stage II in Fig. 1(c). Hence, the concentration in the molten zone remains at CS/k, at all times, guaranteeing continuous precipitation of the solid phase with composition CS. An inset picture of a typical crystal obtained via such seeding zone melting is shown in Fig. 1(c).A longitudinal section of the zone-melted rod was ground and polished. X-ray diffraction (XRD) was carried out for phase analysis in the zone-melted region. The microstructure and composition distribution along the axis direction were analyzed in the same manner as mentioned above.
3. Results and discussion
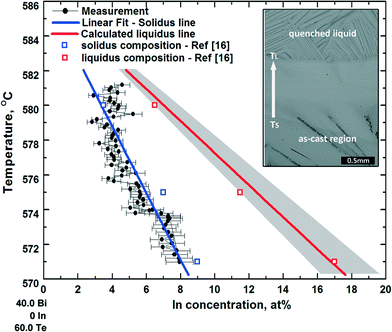
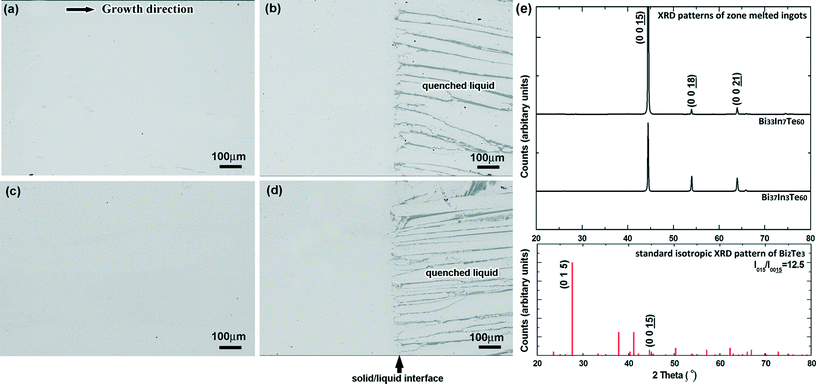
During temperature gradient thermal annealing experiments of Bi40−xInxTe60 (x = 7, 12) alloys (i.e. after 4 hours of thermal stabilization), the former mushy zone between the as-cast region and the molten zone transforms into a single Bi2Te3 region, as shown by the inset microstructure in Fig. 2, in which the corresponding temperature of the upper interface is the melting point of the alloy TL, and that of the lower interface is the solidus temperature TS. The measured concentration of In across this completely resolidified mushy zone and the temperatures that are assigned to the measurement position are represented by the black circles in Fig. 2. Based on the experimental results and related previous literature on pseudo-binary Bi2Te3–In2Te3 phase diagram,20,21 the solidus and liquidus lines are assumed to be straight lines. Consequently, the solidus line of the Bi2Te3-rich side of the pseudo-binary Bi2Te3–In2Te3 phase diagram is approximated by a linear least square fit, as illustrated by the blue line in Fig. 2. The average concentrations of the solid CS and liquid CL phases across the quenched solid/liquid interface (TL) were measured, yielding the partition coefficient, k = CS/CL. For the thermal annealing experiment on Bi33In7Te60, the In concentration of the solid at the TL interface was about 3.0 ± 0.5 at% and a value of k = 0.43 ± 0.07 was calculated. For the Bi28In12Te60 alloy, the In concentration of the solid at the TL interface was 6.2 ± 0.5 at% and a value of k = 0.52 ± 0.04 was calculated. In the following, a constant value of k being covered by the two independent measurements is used, particularly k = 0.48. It is worth noting that the In concentration at the lowest interface of the resolidified single phase Bi2Te3 region of Bi28In12Te60, i.e. the maximum solubility of In in Bi2Te3 was measured to be 8.0 ± 0.5 at%. Considering the experimental In concentration range of 3.0 to 8.0 at%, taking over the majority of the total solidus of the Bi2Te3-rich part of the pseudo-binary Bi2Te3–In2Te3 phase diagram, the two measured values of k were used to determine a possible range of liquidus concentrations that correspond to the respective solidus concentrations by dividing the fitted solidus concentration by k, as illustrated by the grey region in Fig. 2. The experimentally assessed phase diagram is closer to that determined by Scherpereel et al. in 1968.20 Several compositions of the solidus and liquidus lines deduced from ref. 16 are shown as squares in Fig. 2.Based on the experimental data of the pseudo-binary Bi2Te3–In2Te3 phase diagram, Bi33In7Te60 and Bi37In3Te60 (at%), were grown by zone melting with seeding, and the concentration along the crystal growth direction was measured. The composition Bi26.5In13.5Te60 (at%) was selected as the concentration of the seeding alloy for Bi33In7Te60 (at%), and Bi33In7Te60 (at%) for Bi37In3Te60 (at%). During zone melting, the pulling velocity was chosen as 2 μm s−1 to maintain a plain front throughout the growth process. Fig. 3 shows backscattered electron images of Bi33In7Te60 after conventional zone melting, i.e. without seed alloy, and after zone melting with seeding. Single-phase Bi2Te3 in the zone-melted region and growth with a planar solid/liquid interface are confirmed. In the XRD pattern of the zone-melted sample, as shown in Fig. 3(f), apparently, the peak (0 0 15) of Bi2Te3 is the strongest peak and the other two peaks (0 0 18) and (0 0 21) are much weaker. Compared with the standard isotropic pattern of Bi2Te3 in which the peak (0 1 5) is the strongest, the intensity of the peak (0 0 15) of Bi2Te3 is much higher. The XRD results suggest that the zone-melted samples, Bi37In3Te60 and Bi33In7Te60, exhibit a preferential orientation of a {001} plane parallel to the growth axis, allowing full exploration of the anisotropic thermoelectric property of this material.1–3
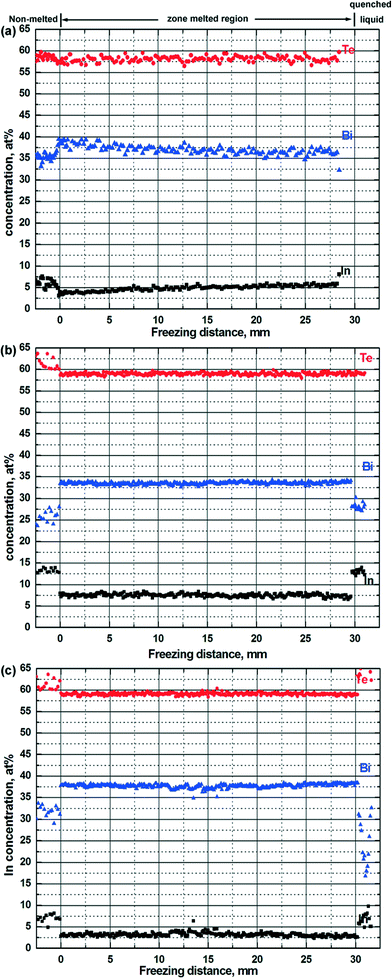
The composition of the zone-melted ingots along the growth direction is plotted as a function of the freezing distance from the bottom end (in Fig. 4). For the Bi33In7Te60 ingot after conventional zone melting, with increasing freezing distance up to 30 mm the In concentration increases from ~3.5 at% to ~5 at%. After employing the seed alloy Bi26.5In13.5Te60, the In concentration of the zone-melted ingot is close to the target level of ~7.0 at% in almost the entire zone-melted region. For the second alloy (Bi37In3Te60), seeding also proved to be successful, as the In is homogeneously distributed in the zone-melted ingot with a concentration close to 3 at%.
A comparison of the composition distribution of the grown crystal prepared by the seeding zone melting and that prepared by other traditional crystal growth methods is summarized in Table 1. For alloys with a large solidification interval and a solute redistribution coefficient k distinctly different from unity, as, e.g. Bi2Te3–In2Te3, when prepared by Czochralski, Bridgman and zone melting methods, a pronounced composition gradient must form in the initial transient region before the steady state is established and solidification occurs with constant composition.5–11 The final transient is associated with the solute pile-up in front of the growing interface that eventually will solidify with a higher concentration. The length Li of the initial transient region can be calculated according to28
 | (1) |
| Method | Mass transport in melt | Composition distribution in the grown crystal | Ref. |
|---|---|---|---|
| Czochralski | Convection | Initial concentration kC0 → continually increasing (length of the concentration gradient depending on the melt volume) → initial and final transients are connected | 8, 9 |
| Bridgman | Diffusion/convection | Initial concentration kC0 → concentration continually increasing till C0 → C0 during steady-state growth → concentration increasing during final transients (length of the initial transient depends on the growth speed and great increase in the presence of convection) | 10, 11 |
| Zone melting | Diffusion/convection | 5–7 | |
| Seeding zone melting | Convection | C 0 across the whole grown crystal | Present work |
During preparation of a thermoelectric crystal via such methods, the growth rate is generally very low to guarantee planar growth of the crystal. This will lead to a relatively long initial transient zone, especially for alloy systems with relatively small k values. It has been reported that the initial transient even occupied the first quarter length of the prepared Bi2Te3–Se2Te3 crystal via the zone melting method.7 Moreover, when produced by such methods, convection in the melt must be suppressed for reliable and reproducible results, which in practice is hard to accomplish. The existence of convection in most cases is connected with a non-uniform concentration and the non-existence of steady-state growth. When produced by seeding zone melting, the initial transient zone can be eliminated by proper selection of the seed alloy, and a uniform composition close to the target value is obtained over the entire length of the zone-melted region. During this seeding zone melting process, the necessary strong convection in the melt is far easier to achieve in practice than in pure diffusion control.
For the Bi40−xInxTe60 crystals, the thermoelectric properties are very sensitive to the In concentration in the range from 0 to 7 at%, and an inversion of the conductivity type from positive to negative occurs at a composition of ~2 at% In.18 Hence, it is especially necessary to precisely control the In composition of the Bi40−xInxTe60 crystals to generate the desired thermoelectric properties. Additionally, the introduction of nanoscale In-rich precipitates (of several nanometers in size)15 or mesoscale In2Te3 precipitates of an extension between 0.1 and 1 μm17 as secondary precipitates via solid-state transformation has the potential to enhance the thermoelectric properties of this material via a multi-scale hierarchical structure. Such an enhancement strategy requires a fundamental understanding of the relationship between the structure and the thermoelectric properties of these materials. Up to the present, this understanding has not been worked out because bulk oriented homogeneous Bi2Te3 crystals were not available. In this view, the seeding zone melting technique not only can contribute to the optimization of thermoelectric properties of Bi–In–Te based materials by simultaneously exploiting the anisotropy of the thermoelectric properties and improving the chemical homogeneity, but also can shed light on the fundamental questions concerning the control of meso- and nanoscale structures in the intermetallic phases which in turn will stimulate further enhancement of thermoelectric performance.
4. Conclusion
In the present work, based on accurate phase diagram data, a crystal growth method applying seeding and zone melting is established to prepare oriented Bi2Te3 crystals as a thermoelectric material with optimized chemical homogeneity. The method, from the determination of the phase diagram to the seeding zone melting process, in principle can be applied to other thermoelectric materials, irrespective of crystal anisotropy, by improving the thermoelectric performance of the respective ingots and/or allowing a more profound understanding of the structure evolution of thermoelectrics.Acknowledgements
Financial support from the German Research Foundation (DFG) for two of the authors (HE and AL) under grant no. Re1261/7 is gratefully acknowledged.References
- H. J. Goldsmid, J. Appl. Phys., 1961, 32, 2198 CrossRef CAS PubMed.
- T. Caillat, L. Gailliard, H. Scherrer and S. Scherrer, J. Phys. Chem. Solids, 1993, 54, 575 CrossRef CAS.
- M. Carle, P. Pierrat, C. Lahalle-Gravier, H. Scherrer and S. Scherrer, J. Phys. Chem. Solids, 1995, 56, 201 CrossRef CAS.
- L. D. Zhao, S. H. Lo, Y. S. Zhang, H. Sun, G. J. Tan, C. Uher, C. Wolverton, V. P. Dravid and M. G. Kanatzidis, Nature, 2014, 508, 373 CrossRef CAS PubMed.
- F. König, Cryst. Res. Technol., 1998, 33, 219 CrossRef.
- G. Kavei and M. A. Karami, Mater. Res. Bull., 2008, 43, 239 CrossRef CAS PubMed.
- M. Allahkarami, L. Seyed-Faraji, G. Kavei and Y. Zare, Mater. Chem. Phys., 2010, 119, 145 CrossRef CAS PubMed.
- V. S. Zemskov, A. D. Belaya, U. S. Beluy and G. N. Kozhemyakin, J. Cryst. Growth, 2000, 212, 161 CrossRef CAS.
- G. N. Kozhemyakin, D. V. Lutskiy, M. A. Rom and P. V. Mateychenko, J. Cryst. Growth, 2009, 311, 1466 CrossRef CAS PubMed.
- K. A. Kokh, A. V. Makarenko, V. A. Golyashov, O. A. Shegai and O. E. Tereshchenko, CrystEngComm, 2014, 16, 581 RSC.
- D. Perrion, M. Chitroub, S. Scherrer and H. Scherrer, J. Phys. Chem. Solids, 2000, 61, 1687 CrossRef.
- H. J. Goldsmid, Proc. Phys. Soc., London, 1958, 71, 633 CrossRef CAS.
- N. B. Brandt and V. A. Kulbachinskii, Semicond. Sci. Technol., 1992, 7, 907 CrossRef CAS.
- S. B. Ovsyannikov, V. V. Shchennilov, G. V. Vorontsov, A. Y. Manakov, A. Y. Likhacheva and V. A. Kulbachinskii, J. Appl. Phys., 2008, 104, 053713 CrossRef PubMed.
- Y. Zhai, T. Zhang, Y. Xiao, J. Jiang, S. Yang and G. Xu, J. Alloys Compd., 2013, 563, 285 CrossRef CAS PubMed.
- N. Peranio, Structural, chemical, and thermoelectric properties of Bi2Te3 Peltier materials: bulk, thin films, and superlattices, PhD thesis, Eberhard-Karls-Universität Tübingen, Germany, 2008 Search PubMed.
- N. A. Heinz, T. Ikeda and G. J. Snyder, Acta Mater., 2012, 60, 4461 CrossRef CAS PubMed.
- S. Karamazov, P. Lošťák, J. Horák and R. Kužel, Phys. Status Solidi A, 1995, 148, 229 CrossRef CAS.
- A. J. Rgsenberg and A. J. Strauss, Phys. Chem. Solids, 1961, 19, 105 CrossRef.
- L. R. Scherpereel, P. L. Palumbo and E. A. Peretti, J. Less-Common Met., 1968, 14, 41 CrossRef CAS.
- D. P. Belotskii, S. M. Dodik, I. N. Antipov and Z. I. Nefedova, Ukr. Khim. Zh., 1970, 36, 897 CAS.
- H. Nguyen Thi, B. Drevet, J. M. Debierre, D. Camel, Y. Dabo and B. Billia, J. Cryst. Growth, 2003, 253, 539 CrossRef.
- M. Buchmann and M. Rettenmayr, J. Cryst. Growth, 2005, 284, 544 CrossRef CAS PubMed.
- U. Bösenberg, M. Buchmann and M. Rettenmayr, J. Cryst. Growth, 2007, 304, 281 CrossRef PubMed.
- Y. Q. Su, D. M. Liu, X. Z. Li, L. S. Luo, J. J. Guo and H. Z. Fu, J. Cryst. Growth, 2010, 312, 2441 CrossRef CAS PubMed.
- D. M. Liu, Y. Q. Su, X. Z. Li, L. S. Luo, J. J. Guo and H. Z. Fu, J. Cryst. Growth, 2010, 312, 3658 CrossRef CAS PubMed.
- H. Engelhardt, B. Hallstedt, M. Drüe, A. Löffler, M. Schick and M. Rettenmayr, Adv. Eng. Mater., 2013, 14, 319 CrossRef.
- V. G. Smith, W. A. Tiller and J. W. Rutter, Can. J. Phys., 1955, 33, 723 CrossRef CAS.
| This journal is © The Royal Society of Chemistry 2015 |


