 Open Access Article
Creative Commons Attribution 3.0 Unported Licence
Aggregation-induced emission fluorogens as biomarkers to assess the viability of microalgae in aquatic ecosystems†
Feng
Guo
abc,
Wei-Ping
Gai
c,
Yuning
Hong
d,
Ben Zhong
Tang
e,
Jianguang
Qin
*a and
Youhong
Tang
*b
aSchool of Biological Sciences, Flinders University, Adelaide 5042, Australia. E-mail: jian.qin@flinders.edu.au
bCentre for NanoScale Science and Technology, School of Computer Science, Engineering and Mathematics, Flinders University, Adelaide 5042, Australia. E-mail: youhong.tang@flinders.edu.au
cDepartment of Surgery, Centre for Neuroscience, School of Medicine, Flinders University, Adelaide 5042, Australia
dSchool of Chemistry, The University of Melbourne, Melbourne 3010, Australia
eDepartment of Chemistry, The Hong Kong University of Science and Technology, Kowloon, Hong Kong, China
First published on 29th September 2015
Abstract
Microalgae can be a valuable indicator for monitoring water pollution due to their sensitivity to the changes induced by pollutants in the environment. In this study, an aggregation-induced emission fluorogen was used as a novel tool to differentiate dead and live microalgae and quantify the link between live algal concentration and fluorogen intensity. Protein in the cell protoplasm is the key component contributing to fluorescence emission in algae.
For the past few decades the oceans have been regarded as a giant dumping area for all types of disposal, from organic carbon, plastic, toxins and heavy metals to radioactive waste with the misconception that the gigantic size of the oceans is sufficient to dilute pollutants and render harmless any materials dumped in.1 In fact, the ocean ecosystem is currently under enormous stress from a variety of pollution sources. The oceans have a considerable self-purification function but that ability is not infinite. By dumping excessive pollutants into the oceans, humans may permanently alter the ocean ecosystem. Moreover, a number of manufactured chemicals can threaten human health, causing cancer, immune deficiency, nerve disorders and low fertility.
Biological monitoring uses biological responses to evaluate changes in the environment with the intention of establishing a qualitative control program. Through systematic and regular monitoring, the responses of organisms are used to assess the impact of pollutants on the health and function of an aquatic ecosystem. Microalgae are vitally important to the food web in the aquatic ecosystem and can be a valuable indicator for monitoring water pollution due to their sensitivity to chemical changes in the environment. Moreover, microalgae are pivotal in the biogeochemical cycling of nutrients and pollutants in the ocean.2 Microalgae have been referred to as a ‘‘green liver’’ of the ocean, acting as an important sink for chemical compounds. Nannochloropsis is a genus of small green microalgae and is well known for its nutritional value and ability to produce valuable lipophilic and lipophobic materials. In the aquaculture industry, Nannochloropsis is extensively used as live feed to grow small zooplanktons such as rotifers and copepods in fish hatcheries. Nannochloropsis oculata (N. oculata) is one of the six species in this genus. Nannochloropsis is a unicellular green alga having a spherical shape and 2–5 μm in diameter. In this study, this ubiquitous species was used to test whether a new and unique luminogen can be a biomarker to assess the viability of microalgae.
Various species of microalgae have been used for the bioassessment of pollution in water.3 Recently, some methods have been developed to assess phytoplankton viability in marine and coastal environments, such as SYTOX green,4,5 fluorescein diacetate (FDA),6–9 FDA + 5-chloromethylfluorescein diacetate (CMFDA)10 and neutral red.11,12 Among these assays, fluorescein formed by intracellular hydrolysis of FDA leaks rapidly from cells13 and SYTOX green does not reveal the mechanism causing cell death. Auto-fluorescence in chlorophyll pigments overlaps with the fluorescence of propidium iodide (PI)14 whereas neutral red is not effective for staining some phytoplankton species due to leaching or cell shrinkage.15,16 So far, no efficient staining method has been found to easily differentiate live from dead algae.17
We previously discovered a group of unique luminogens which are nonluminescent when molecularly dissolved but highly fluorescent when aggregated.18 Aggregation-induced emission (AIE) describes this novel phenomenon and the restriction of intramolecular motions is the main cause of the AIE phenomenon.19 Over the past decade, AIE luminogens have been successfully employed in a variety of biological applications,19–21 such as long-term cell tracking, non-self-quenching DNA labelling, inhibition of amyloid fibrillation, differentiation of protein monomers, oligomers and fibrils,22 monitoring of cell apoptosis and long-term bacterial viability assays.23 AIE luminogens exhibit high quantum efficiency, good biocompatibility and appreciable photostability, and these features have motivated us to further explore their application in the thriving field of aquatic ecology.
Recently we discovered an AIE-active molecule, 1,2-bis[4-(3-sulfonatopropoxyl)phenyl]-1,2-diphenylethene salt (BSPOTPE), for staining live particles.24 BSPOTPE is a water-soluble and biocompatible fluorogen without fluorescence in physiological buffers. In the current study, we discovered an important function of BSPOTPE as a fluorescent probe to quantitatively differentiate live and dead N. oculata in algal culture.
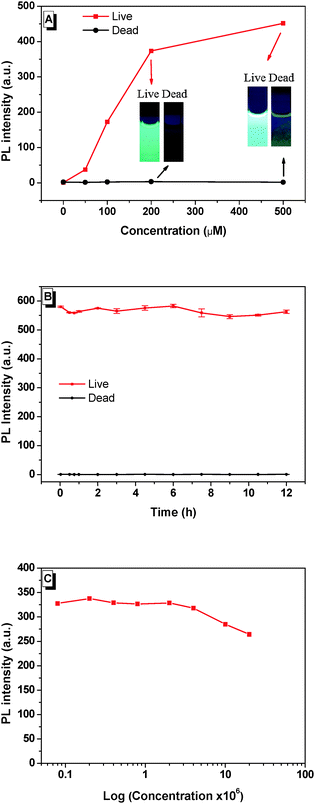
Dead N. oculata (10 × 106 ml−1) was obtained after preservation in 75% ethanol for 30 min, followed by BSPOTPE/PI staining for 20 min. Our major finding was that BSPOTPE induced an increase of fluorescence (>300-fold) at BSPOTPE (200 μM) by binding with live N. oculata, whereas dead cells released minimum emission stained with BSPOTPE (Fig. 1A). To obtain stable emission, optimising the binding condition with an increment of dye concentration was conducted. The photoluminescence (PL) intensity of BSPOTPE-bound live N. oculata increased with the increase of BSPOTPE concentration (Fig. 1A) and reached a plateau at 200–500 μM. No obvious change in PL intensity was observed in BSPOTPE-bound dead N. oculata. The 200 μM BSPOTPE was chosen to further differentiate dead and live cells. Live N. oculata could be instantly stained by BSPOTPE after gentle mixing, which is much quicker than that by the neutral red staining method (1–2 h).12,15 Staining time with FDA usually takes <10 min, but not all organisms can be stained, and the fluorescence signal is not stable.7,25 Peperzak and Brussaard assessed the vitality of phytoplankton with six dyes by flow cytometry. Only Calcein-AM stained Nannochloropsis, but the signals were not strong.9 Flow cytometry has been used for particle quantification in aquatic ecosystems since the 1980s. Despite its high sensitivity and rapid quantification in cell densities,26 it is unlikely to differentiate dead algal cells from live algae.
The time profiles of PL intensity of BSPOTPE binding with live and dead N. oculata were compared. The PL intensity of BSPOTPE with live N. oculata was very high at the beginning and showed little variation over time (Fig. 1B). The combination of dead N. oculata with BSPOTPE binding led to very low but constant PL intensity. As BSPOTPE had high stability for staining live N. oculata for at least 7 days, BSPOTPE could provide a long-term viability assay for staining live N. oculata. Furthermore, the algal cell shape remained intact after verification with trypan blue staining. Salinity may affect the binding efficiency of BSPOTPE on live N. oculata. We controlled salinity by fixing a total of 500 μl of N. oculata/seawater and 2 ml of phosphate-buffered saline (PBS) at 13.8‰ salinity. The PL intensity was stable in a high concentration of live N. oculata (Fig. 1C). BSPOTPE could measure live algal concentration under light conditions regardless of salinity.
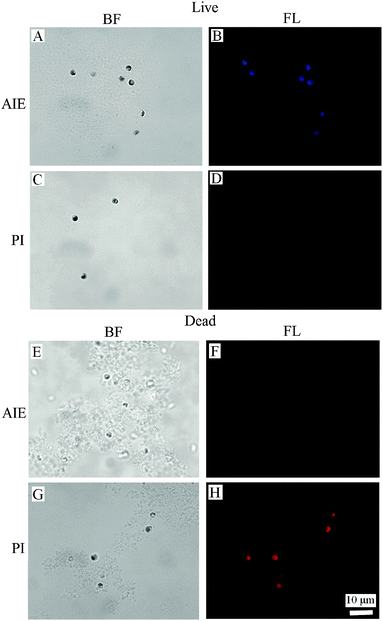
The binding of BSPOTPE to live cells can be visualised by fluorescence microscopy with strong blue fluorescence (Fig. 2B). The binding shows no overlap with the auto-fluorescence of chlorophyll pigments. On the other hand, the dead cells are almost non-emissive after binding to BSPOTPE (Fig. 2F). It is possible that 75% ethanol may denature the proteins on the cell membrane that could have been bound by BSPOTPE. In the present study, strong red fluorescence was achieved by the binding of PI and dead cells (Fig. 2H), though PI was non-emissive binding to live cells (Fig. 2D). It is well known that PI can stain dead cells as it is an impermeant nucleic acid dye that only stains cells with a damaged membrane, and the enhanced fluorescence can thus indicate the dead status of a cell. However, the method is not suitable for microalgae because of the overlap between auto-fluorescence of chlorophyll pigments and PI.14 PI is not capable of passing through the membranes of intact cells, and therefore should not be able to stain live cells,27,28 which explains why PI could not stain live N. oculata.
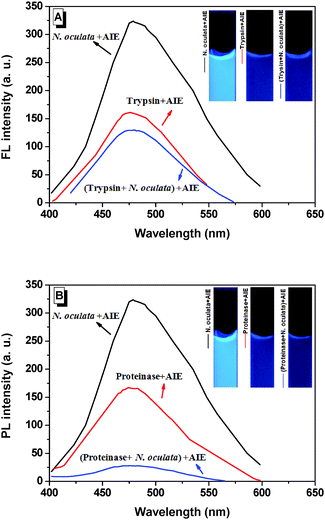
It is of interest to further explore the emission mechanisms in live N. oculata bound with BSPOTPE. The PL intensity was stable (within 300–350 a.u.) in a broad range of concentration of live N. oculata (Fig. 1C). Trypsin is a common enzyme that digests proteins into peptides and it only hydrolyses the peptide bonds in which the carbonyl group is contributed either by an arginine or lysine residue. BSPOTPE reduces fluorescence emission once it is combined with trypsin. The fluorescence was 157 a.u. prior to trypsin digestion and reduced to 128 a.u. after digestion by 1% trypsin for 2 h (Fig. 3A). Trypsin digestion reduced fluorescence by 18%. In contrast to trypsin, proteinase K is a broad-spectrum serine protease.27 The predominant site of cleavage is the peptide bond adjacent to the carboxyl group of aliphatic and aromatic amino acids with blocked alpha amino groups. The fluorescence was 163 a.u. prior to proteinase K digestion and 28 a.u. after 0.5% proteinase digestion for 2 h. Proteinase digestion reduced fluorescence by 83%, suggesting that proteinase is stronger than trypsin in proteinlysis (Fig. 3B). Our data suggest that the fluorescence of live N. oculata may exist in the cell protoplasm. We can thus assume that protoplasm proteins inside the cell are the main binding sites of BSPOTPE, rather than the proteins on the cell surface. The staining mechanism may be similar to neutral red which can be accumulated in the cytoplasm and/or vacuoles in plant cells.15
 | ||
| Fig. 3 Change of photoluminescence (PL) intensity in live N. oculata before and after (A) trypsin or (B) proteinase K digestion. | ||
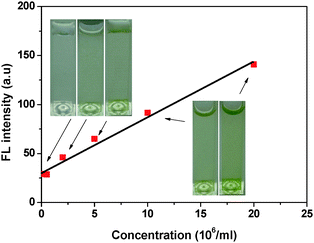
The BSPOTPE solution in PBS emitted dim luminescence at 390 nm in the absence of N. oculata. When the density of N. oculata was low in PBS, the BSPOTPE solution became luminescent. The FL intensity at 485 nm kept rising with an increase in the N. oculata concentration diluted with PBS. The rate of FL enhancement kept almost constant up to 20 × 106N. oculata per ml (Fig. 4). At a N. oculata concentration of 20 × 106 ml−1, the FL intensity increased five-fold. The detection threshold reduced to 0.2 × 10⁶ per ml of N. oculata. In the N. oculata range of 0.2–20 × 106 ml−1, the plot of FL enhancement as a function of N. oculata concentration is linear with a high correlation coefficient (r2 = 0.989), indicating that the AIE luminogen can be used for a quantitative assay for N. oculata concentration in a PBS buffer.
Cell density and chlorophyll a concentration are conventional measures for algal abundance but are insufficient to accurately reflect the physiological responses to ambient stress.29,30 For instance, algae may be deformed, decrease in cell size, or cease cell division in response to exposure to lethal metals or phytotoxic chemicals.29–31 Furthermore, chlorophyll a concentrations may overestimate the viability of algae because of interference by other pigments (e.g. pheophytins).32,33 This study contributes to the understanding of the accuracy, precision and utility of the BSPOTPE as a viability measure. Compared with commercial viability probes, this dye is highly emissive, photostable and ease to use, making it suitable for long-term microalgae viability assays. To our best knowledge, this is the first study reported using an AIE fluorogen in microalgae. The great difference in fluorescence signals prompted us to conclude that BSPOTPE can be used for the N. oculata viability assay and may be employed as a biomarker for assessing the functional performance of other primary producers in aquatic ecosystems.
F.G., Y.H., W.G. and B.Z.T. thank NHMRC Early Career Fellowship (APP1037798), McKenzie Fellowship of the University of Melbourne, NHMRC Research Fellowship (535014) and Guangdong Innovative Research Team Program (201101C0105067115) for support.
Notes and references
- Ocean disposal of radioactive waste: Status report. Dominique P. Calmet. IAEA Bulletin, 4, 1989.
- C. A. Van Gestel and T. C. Van Brummelen, Ecotoxicology, 1996, 5, 217 CrossRef CAS PubMed.
- J. Ma, R. Zheng, L. Xu and S. Wang, Ecotoxicol. Environ. Saf., 2002, 52, 5 CrossRef PubMed.
- L. C. Rai, J. P. Gaur and C. J. Soeder, Adv. Limnol., 1994, 42, 283 Search PubMed.
- M. J. W. Veldhuis, G. W. Kraay and K. R. Timmermans, Eur. J. Phycol., 2001, 36, 167 CrossRef PubMed.
- A. C. Baudoux, M. J. W. Veldhuis, A. A. M. Noordeloos, G. van Noort and C. P. D. Brussaard, Aquat. Microb. Ecol., 2008, 52, 69 CrossRef.
- J. D. Brookes, S. M. Geary, G. G. Ganf and M. D. Burch, Mar. Freshwater Res., 2000, 51, 817 CAS.
- M. Garvey, B. Moriceau and U. Passow, Mar. Ecol.: Prog. Ser., 2007, 352, 17 CrossRef.
- L. Peperzak and P. D. Brussaard, J. Phycol., 2011, 47, 692 CrossRef PubMed.
- M. C. Villac and I. Kaczmzrska, Mar. Ecol.: Prog. Ser., 2011, 425, 47 CrossRef.
- M. K. Steinberg, E. J. Lemieux and L. A. Drake, Mar. Biol., 2011, 158, 1431 CrossRef.
- D. T. Elliott and K. W. Tang, Limnol. Oceanogr.: Methods, 2009, 7, 585 CrossRef.
- E. M. Zetsche and F. J. R. Meysman, J. Plankton Res., 2012, 34, 493 CrossRef CAS PubMed.
- R. P. Haugland, J. Gregory and T. Z. Spence Michelle, Handbook of Fluorescent Probes and Research Products, Molecular Probes, Inc, OR, 9th edn, 2002, p. 605 Search PubMed.
- M. Sato, Y. Murata, M. Mizusawa, H. Iwahashi and S. Oka, Cult. Coll., 2004, 53 Search PubMed.
- R. W. Crippen and J. L. Perrier, Biotech. Histochem., 1974, 49, 97 CrossRef CAS.
- Z. Pavlic, Z. Vidakovic-Cifrek and D. Puntaric, Chemosphere, 2005, 61, 1061 CrossRef CAS PubMed.
- J. Luo, Z. Xie, J. W. Y. Lam, L. Cheng, B. Z. Tang, H. Chen, C. Qiu, H. S. Kwok, X. Zhan, Y. Liu and D. Zhu, Chem. Commun., 2001, 1740 RSC.
- D. Ding, K. Li, B. Liu and B. Z. Tang, Acc. Chem. Res., 2013, 46, 2441 CrossRef CAS PubMed.
- J. Huang, N. Sun, J. Yang, R. Tang, Q. Li, D. Ma and Z. Li, Adv. Funct. Mater., 2014, 24, 7645 CrossRef CAS PubMed.
- J. Yang, N. Sun, J. Huang, Q. Li, Q. Peng, X. Tang, Y. Dong, D. Ma and Z. Li, J. Mater. Chem. C, 2015, 3, 2624 RSC.
- C. W. T. Leung, F. Guo, Y. Hong, E. Zhao, R. T. Kwok, N. L. Leung, S. Chen, N. N. Vaikath, O. M. El-Agnaf, Y. Tang, W. P. Gai and B. Z. Tang, Chem. Commun., 2015, 51, 1866 RSC.
- E. Zhao, Y. Hong, S. Chen, C. W. T. Leung, C. Y. Chan, R. T. Kwok, J. W. Lam and B. Z. Tang, Adv. Healthcare Mater., 2014, 3, 88 CrossRef CAS PubMed.
- F. Wang, J. Wen, L. Huang, J. Huang and J. Ouyang, Chem. Commun., 2012, 48, 7395 RSC.
- A. Reynolds, G. Mackiernan and S. Van Valkenburg, Estuaries Coasts, 1978, 1, 192 CrossRef CAS.
- J. Dorsey, C. M. Yentsch, S. Mayo and C. McKenna, Cytometry, 1989, 10, 622 CrossRef CAS PubMed.
- C. M. Yentsch and S. A. Pomponi, Int. Rev. Cytol., 1986, 105, 183 Search PubMed.
- E. Kraus, H. H. Kiltz and U. F. Femfert, Hoppe-Seyler's Z. Physiol. Chem., 1976, 357, 233 CrossRef CAS.
- L. Shi, S. Günther, T. Hübschmann, L. Y. Wick, H. Harms and S. Müller, Cytometry, Part A, 2007, 71, 592 CrossRef PubMed.
- N. Nyholm, Water Res., 1998, 19, 273 CrossRef.
- M. Chao and C. Chen, J. Hazard. Mater., 2001, 82, 129 CrossRef CAS.
- D. Mares, A. Bonora, G. Sacchetti, M. Rubini and C. Romagnoli, Cell Biol. Int., 1997, 21, 397 CrossRef CAS.
- H. Rai, Arch. Hydrobiol., Beih. Ergeb. Limnol., 1980, 14, 3313 Search PubMed.
Footnote |
| † Electronic supplementary information (ESI) available: Materials, algae strain and culture conditions, BSPOTPE monitoring live and dead N. oculata, monitoring PL intensity of live and dead N. oculata according to different time profiles, measurement of N. oculata staining by BSPOTPE under the control of salinity, evaluating the PL intensity of BSPOTPE with different densities of N. oculata in PBS buffer, live and dead N. oculata staining with BSPOTPE or propidium iodine and elucidation of the staining mechanism of N. oculata by BSPOTPE. See DOI: 10.1039/c5cc07012k |
| This journal is © The Royal Society of Chemistry 2015 |


