 Open Access Article
Creative Commons Attribution 3.0 Unported Licence
Squaraine as a bright, stable and environment-sensitive far-red label for receptor-specific cellular imaging†
J. Karpenkoa,
A. S. Klymchenko*b,
S. Gioriac,
R. Krederb,
I. Shulovb,
P. Villac,
Y. Mélyb,
M. Hiberta and
D. Bonnet*a
aLaboratoire d'Innovation Thérapeutique, UMR 7200 CNRS/Université de Strasbourg, Faculté de Pharmacie, Labex Medalis, 74 route du Rhin, 67401 Illkirch, France. E-mail: dominique.bonnet@unistra.fr
bLaboratoire de Biophotonique et Pharmacologie UMR 7213 CNRS/Université de Strasbourg, Faculté de Pharmacie, 74 route du Rhin, 67401 Illkirch, France. E-mail: andrey.klymchenko@unistra.fr
cPCBIS, FMTS, UMS 3286, CNRS-UdS, ESBS Pôle API Bld Sébastien Brant, 67401 Illkirch Cedex, France
First published on 7th January 2015
Abstract
Herein, we show that a far-red arylidene–squaraine dye is stable against nucleophiles, in contrast to arene–squaraines. Owing to the fluorescence enhancement in apolar media together with high brightness and photostability, this dye was successfully applied to detect the oxytocin G protein-coupled receptor and monitor its internalization in living cells.
Addressing important questions in chemical biology requires the use of non-invasive high-resolution detection and imaging techniques. Due to its non-destructive and real-time character combined with a detection limit reaching single-molecule scales,1 fluorescence is often a method of choice to evaluate ligand–protein interactions. Ideally, fluorescent probes used in bioimaging should meet the following requirements: (1) high quantum yield combined with high chemical stability and photostability; (2) absorption and emission spectra in the far-red region to avoid signal contamination by cellular autofluorescence and to enhance tissue penetration2 and (3) a fluorogenic character of the label, i.e. a capacity to turn on its fluorescence after interaction with the target, which allows wash-free imaging.3 Environment-sensitive dyes, which change their intensity as a function of solvent polarity4a,b and viscosity,4c,d are particularly useful for achieving fluorogenic response. We have recently described the first red fluorescent turn-on ligands based on environment-sensitive Nile Red for imaging G protein-coupled receptors (GPCRs) in living cells.5 However, these probes suffer from the limited photochemical stability and brightness of the Nile Red fluorophore.
Among the known far-red dyes, cyanines are the most widely used due to their strong absorption, straightforward chemistry and tunable optical parameters.3b,6 Although cyanines display some environment sensitivity,7 their fluorogenic character is not pronounced as they also fluoresce efficiently in aqueous media.8
In search for photostable far-red dyes with environmental sensitivity for the detection of membrane GPCRs, we turned our attention to squaraine dyes. Discovered in 1965,9 squaraines have been largely used as organic solar cell materials, two-photon absorbing materials and sensitizers for photodynamic therapy.10
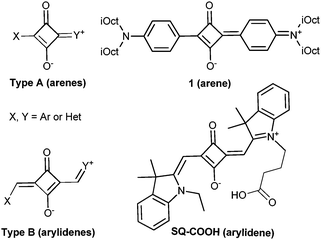
Chemically, squaraines result from the condensation of squaric acid with two electron-rich moieties. Based on their chemical nature, squaraines can be referred to either arenes (Fig. 1, type A) or arylidenes (Fig. 1, type B). Despite their exceptional brightness (an extinction coefficient of ∼330![[thin space (1/6-em)]](https://www.rsc.org/images/entities/char_2009.gif) 000 M−1 cm−1) and photostability,8b,10c only a few reports showed their applications for bioimaging,10b,d and their use for studying membrane receptors was not explored. One of the reasons could be the chemical instability of type A squaraines in a biological medium, caused by nucleophilic attack on the electron-deficient cyclobutene ring.11 This feature stimulated the development of stable but non-fluorogenic and bulky squaraine–rotaxanes.12 In contrast, the stability of type B squaraines in biological media has never been evaluated so far. Moreover, these dyes have never been used as environment-sensitive labels to monitor ligand–receptor interactions. Herein, we demonstrate that a bright far-red squaraine of type B is stable against nucleophiles, in contrast to squaraine–arene (type A), and exhibits fluorescence enhancement in apolar media combined with high photostability. These features enabled wash-free imaging of the oxytocin G protein-coupled receptor (OTR) in living cells with excellent contrast.
000 M−1 cm−1) and photostability,8b,10c only a few reports showed their applications for bioimaging,10b,d and their use for studying membrane receptors was not explored. One of the reasons could be the chemical instability of type A squaraines in a biological medium, caused by nucleophilic attack on the electron-deficient cyclobutene ring.11 This feature stimulated the development of stable but non-fluorogenic and bulky squaraine–rotaxanes.12 In contrast, the stability of type B squaraines in biological media has never been evaluated so far. Moreover, these dyes have never been used as environment-sensitive labels to monitor ligand–receptor interactions. Herein, we demonstrate that a bright far-red squaraine of type B is stable against nucleophiles, in contrast to squaraine–arene (type A), and exhibits fluorescence enhancement in apolar media combined with high photostability. These features enabled wash-free imaging of the oxytocin G protein-coupled receptor (OTR) in living cells with excellent contrast.
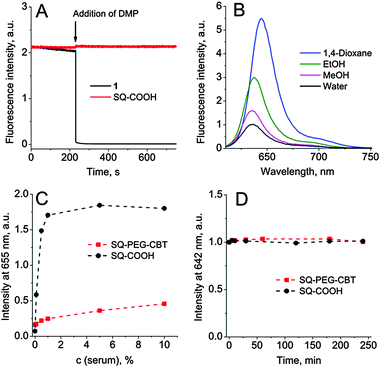
We first compared the chemical stability of the two types of squaraines against strong nucleophiles, using two model dyes, i.e. type A squaraine–arene 1 and type B squaraine–arylidene SQ–COOH (Fig. 1). Squaraine–arenes were reported to be unstable in the presence of thiols (cysteine or glutathione) and cyanide, and were used for their quantitative detection.11 Since the direct consequence of the nucleophilic addition to the squaraine core is the disruption of the conjugation, resulting in a complete loss of fluorescence, their chemical stability was assessed by monitoring their fluorescence intensity with time. As shown in Fig. 2A and Fig. S2 in the ESI,† a fast and nearly complete loss of fluorescence was detected when 10 mM dithiol dimercaprol (DMP) was added to 200 nM ethanol solution of 1, whereas under the same conditions the fluorescence intensity of SQ–COOH remained constant.
Being encouraged by the stability of SQ–COOH in the presence of DMP, we designed a squaraine-derived probe for the oxytocin G protein-coupled receptor (OTR) using the OTR peptide ligand carbetocin (CBT), following a previously described strategy.5 The introduction of a polar PEG8 spacer between the dye and the peptide was shown to enhance the solubility of the probe and to decrease non-specific interactions with serum proteins and lipid membranes.
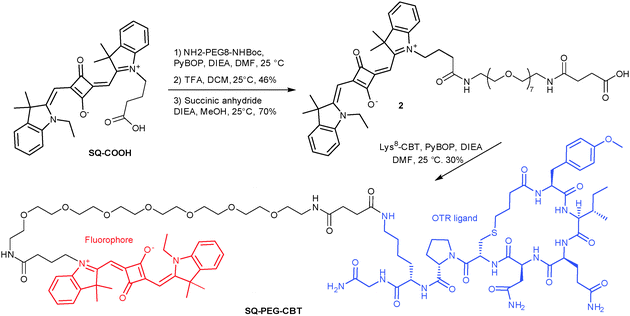
SQ–COOH was coupled to a monoprotected diamine, NH2–PEG8–NH–Boc, under in situ PyBOP activation, followed by the reaction of the resulting amine with succinic anhydride. The resulting pegylated squaraine-acid 2 was then coupled to Lys8-CBT (synthesized as previously described5) to afford the desired OTR ligand, SQ–PEG–CBT, in 30% yield (Scheme 1). The binding affinity of the probe for OTR was then evaluated by time-resolved FRET, as previously described.13 Despite the incorporation of the squaraine dye, SQ–PEG–CBT displayed high affinity for OTR (Kd = 0.42 ± 0.20 nM, see ESI† for the experimental protocol) in the same range as that reported for unmodified CBT (Ki = 1.96 nM).
Next, we evaluated the effect of the polarity of various solvents on the spectroscopic properties of SQ–PEG–CBT compared to SQ–COOH and compound 2. In organic solvents, all molecules exhibited a sharp absorption band, which was only slightly shifted to blue (10 nm) in polar methanol with respect to apolar dioxane (Table S1 in the ESI†). All three squaraines exhibited a large extinction coefficient of up to 350![[thin space (1/6-em)]](https://www.rsc.org/images/entities/char_2009.gif) 000 M−1 cm−1, in line with previous reports.8b,10c In water, the absorption band was blue shifted and slightly broadened with some decrease in the extinction coefficient. As this effect was more pronounced for SQ–COOH, which should be less soluble in water, we suggest that it might undergo partial aggregation in water. The emission maxima of the dyes also showed weak blue shift (∼8 nm) upon increasing solvent polarity from dioxane to methanol (Fig. 2B and Table S1 in the ESI†). Thus, squaraine–arylidenes similarly to cyanines cannot be considered as solvatochromic dyes. On the other hand, the fluorescence quantum yields (QYs) decreased systematically with the increase in solvent polarity from dioxane to methanol. The QY value was the lowest in water with the following order SQ–COOH < 2 < SQ–PEG–CBT. We speculate that the additional PEG and CBT groups likely decreased the aggregation of the dye in water12 and/or screened partially the squaraine from bulk water. Although these squaraine derivatives cannot be called fluorogenic because of their non-negligible fluorescence in water (2.4–8.6%), they showed a clear environment-sensitive fluorescence enhancement, i.e. a 6–21-fold increase from water to apolar 1,4-dioxane (Table S1, ESI†). This attractive property, required for background-free cellular imaging, is an advantage over cyanines, exhibiting efficient fluorescence in water, and thus much lower environment-driven fluorescence enhancement.8,10d Moreover, taking into account the extinction coefficients and quantum yields in apolar media (up to 50%) of these squaraines, their exceptional brightness (157
000 M−1 cm−1, in line with previous reports.8b,10c In water, the absorption band was blue shifted and slightly broadened with some decrease in the extinction coefficient. As this effect was more pronounced for SQ–COOH, which should be less soluble in water, we suggest that it might undergo partial aggregation in water. The emission maxima of the dyes also showed weak blue shift (∼8 nm) upon increasing solvent polarity from dioxane to methanol (Fig. 2B and Table S1 in the ESI†). Thus, squaraine–arylidenes similarly to cyanines cannot be considered as solvatochromic dyes. On the other hand, the fluorescence quantum yields (QYs) decreased systematically with the increase in solvent polarity from dioxane to methanol. The QY value was the lowest in water with the following order SQ–COOH < 2 < SQ–PEG–CBT. We speculate that the additional PEG and CBT groups likely decreased the aggregation of the dye in water12 and/or screened partially the squaraine from bulk water. Although these squaraine derivatives cannot be called fluorogenic because of their non-negligible fluorescence in water (2.4–8.6%), they showed a clear environment-sensitive fluorescence enhancement, i.e. a 6–21-fold increase from water to apolar 1,4-dioxane (Table S1, ESI†). This attractive property, required for background-free cellular imaging, is an advantage over cyanines, exhibiting efficient fluorescence in water, and thus much lower environment-driven fluorescence enhancement.8,10d Moreover, taking into account the extinction coefficients and quantum yields in apolar media (up to 50%) of these squaraines, their exceptional brightness (157![[thin space (1/6-em)]](https://www.rsc.org/images/entities/char_2009.gif) 000 M−1 cm−1) reaches the highest limits reported to date for fluorophores whether they are fluorogenic or not.14 In comparison, our previous fluorogenic OTR probe derived from Nile Red displayed a molar absorption coefficient in dioxane of 38
000 M−1 cm−1) reaches the highest limits reported to date for fluorophores whether they are fluorogenic or not.14 In comparison, our previous fluorogenic OTR probe derived from Nile Red displayed a molar absorption coefficient in dioxane of 38![[thin space (1/6-em)]](https://www.rsc.org/images/entities/char_2009.gif) 000 M−1 cm−1,15 which together with a quantum yield of 0.716 resulted in a brightness of only 26
000 M−1 cm−1,15 which together with a quantum yield of 0.716 resulted in a brightness of only 26![[thin space (1/6-em)]](https://www.rsc.org/images/entities/char_2009.gif) 600 M−1 cm−1.
600 M−1 cm−1.
We next examined the interaction of the parent dye, SQ–COOH, and the OTR probe, SQ–PEG–CBT, with bovine serum. To this end, we titrated both compounds in HEPES buffered saline with bovine serum (Fig. 2C). For SQ–COOH, the fluorescence reached a plateau at 1% serum, indicating a strong binding of the dye to serum components. In sharp contrast, for SQ–PEG–CBT the fluorescence increase was moderate, indicating that the PEG and CBT groups decreased drastically non-specific interactions, as we observed earlier for a similar Nile Red-based compound.5 Moreover, no squaraine degradation was detected in the presence of 10% serum proteins after 4 hours of incubation in the dark, confirming the excellent chemical stability of the developed probe.
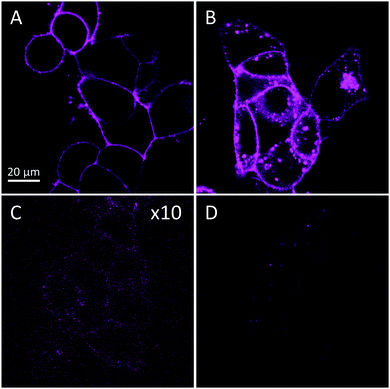
Next, confocal imaging with SQ–PEG–CBT was performed on HEK293 cells expressing wild-type OTR (wtOTR cells, Fig. 3). After only 5 min of incubation, clear membrane staining was detected with 20 nM of SQ–PEG–CBT (Fig. 3A). Competition with a large excess (2 μM) of unlabeled CBT led to the disappearance of the membrane fluorescence, demonstrating the receptor-specific binding of SQ–PEG–CBT (Fig. 3C). The specificity of the probe was also confirmed by using cells expressing OTR fused to a green fluorescent protein (GFP-OTR cells). In this experiment, SQ–PEG–CBT was perfectly colocalized with GFP (Fig. S3, ESI†).
To highlight the capacity of the probe to track OTR in the cells, SQ–PEG–CBT was incubated with wtOTR cells for 30 min at 37 °C. As a result, the internalization of OTR was clearly observed (Fig. 3B), whereas the pretreatment of the cells with an excess of CBT (2 μM) prevented the probe from binding and internalization (Fig. 3D). Thereby, SQ–PEG–CBT can trigger OTR internalization. As we showed earlier for the NR–PEG–CBT conjugate, CBT preserved its functional activity due to the PEG spacer.5 Noteworthily, due to its environmental sensitivity and its accumulation on cell membranes as a result of the binding to OTR, the SQ–PEG–CBT ligand allowed wash-free imaging of OTR-expressing cells without considerable background fluorescence.
To understand the response of the squaraine moiety to OTR binding, the spectroscopic properties of SQ–PEG–CBT were evaluated in suspensions of wtOTR cells. Following excitation at 620 nm, the fluorescence emission of SQ–PEG–CBT was red shifted from 635 nm in the buffer to 642 nm in the presence of the cells (Fig. S4, ESI†). The fluorescence intensity underwent a 4-fold increase at 655 nm in the presence of wtOTR compared to the buffer. These results confirmed that after binding to OTR, the dye localized in a relatively apolar lipid–receptor environment, as we have showed earlier for the Nile Red probe.5
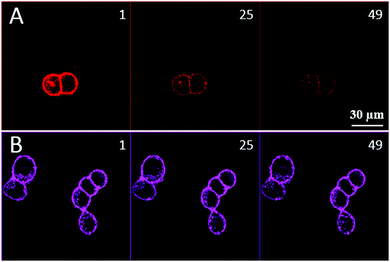
Next, to evaluate the photostability of the squaraine-based probe, photobleaching experiments in comparison with the previously reported Nile Red derivative, NR–PEG–CBT, were performed (see ESI† for the details). The GFP-OTR cells were stained with 20 nM of either NR–PEG–CBT or SQ–PEG–CBT and subjected to continuous laser irradiation (50 consecutive double-average scans). As the extinction coefficients of squaraine and Nile Red dyes differ nearly 10-fold, while their quantum yields in apolar media are close, the intensities of two lasers (488 nm for Nile Red and 635 nm for squaraine) were adjusted to get similar fluorescence intensities with the same photomultiplier gain. These conditions ensured that approximately the same number of photons was absorbed by these dyes during the photobleaching experiment. As shown in Fig. 4, NR–PEG–CBT rapidly lost its fluorescence after the first scans (with a stability half-time of 6 scans), whereas SQ–PEG–CBT displayed a much higher photostability losing only 25% of its initial intensity after 50 scans (Fig. S5, ESI†).
For the first time, the chemical stability of squaraine–arylidenes against strong nucleophiles was demonstrated. Exceptionally high brightness, far-red absorption and emission, fluorescence enhancement in apolar media, combined with an excellent photostability allowed us to consider this class of dyes as attractive labels for fluorescence imaging of biomolecules and cellular processes. In particular, these dyes are suited for monitoring ligand–receptor interactions and for tracking receptor internalization, as demonstrated for the membrane oxytocin receptor, a prototype of G protein-coupled receptors.
This work was supported by the French “Ministère de la Recherche”, the Centre National de la Recherche Scientifique (CNRS), the Université de Strasbourg (UDS), the ANR JC (ANR-11-JS07-014-01), and the “Innovations Thérapeutiques pour les Maladies Mentales” (ITMM) program. We are grateful to Patrick Wehrung from the Service de Chimie Analytique (SCA) for MS analyses. Julie Karpenko was supported by a fellowship from the Ministère de l'Education Nationale, de l'Enseignement Supérieur et de la Recherche (MENSER).
Notes and references
- (a) A. P. Demchenko, Introduction to Fluorescence Sensing, Springer, 2009 Search PubMed; (b) M. Sauer, J. Hofkens and J. Enderlein, Handbook of Fluorescence Spectroscopy and Imaging: From Ensemble to Single Molecules, John Wiley & Sons, Ltd., 2010 Search PubMed.
- (a) J. O. Escobedo, O. Rusin, S. Lim and R. M. Strongin, Curr. Opin. Chem. Biol., 2010, 14, 64–70 CrossRef CAS PubMed; (b) L. Yuan, W. Lin, K. Zheng, L. He and W. Huang, Chem. Soc. Rev., 2013, 42, 622–661 RSC.
- (a) A. Nadler and C. Schultz, Angew. Chem., Int. Ed., 2013, 52, 2408–2410 CrossRef CAS PubMed; (b) J. B. Grimm, L. M. Heckman and L. D. Lavis, Prog. Mol. Biol. Transl. Sci., 2013, 113, 1–34 CrossRef CAS PubMed; (c) X. Li, X. Gao, W. Shi and H. Ma, Chem. Rev., 2014, 114, 590–659 CrossRef CAS PubMed.
- (a) G. S. Loving, M. Sainlos and B. Imperiali, Trends Biotechnol., 2010, 28, 73–83 CrossRef CAS PubMed; (b) A. S. Klymchenko and Y. Mely, Prog. Mol. Biol. Transl. Sci., 2013, 113, 35–58 CAS; (c) M. A. Haidekker and E. A. Theodorakis, Org. Biomol. Chem., 2007, 5, 1669–1678 RSC; (d) I. López-Duarte, T. T. Vu, M. A. Izquierdo, J. A. Bull and M. K. Kuimova, Chem. Commun., 2014, 50, 5282–5284 RSC.
- I. A. Karpenko, R. Kreder, C. Valencia, P. Villa, C. Mendre, B. Mouillac, Y. Mély, M. Hibert, D. Bonnet and A. S. Klymchenko, ChemBioChem, 2014, 15, 359–363 CrossRef CAS PubMed.
- M. S. T. Gonçalves, Chem. Rev., 2009, 109, 190–212 CrossRef PubMed.
- L. Kurzawa, M. Pellerano, J. B. Coppolani and M. C. Morris, PLoS One, 2011, 6, e26555 CAS.
- (a) D. S. Pisoni, L. Todeschini, A. C. A. Borges, C. L. Petzhold, F. S. Rodembusch and L. F. Campo, J. Org. Chem., 2014, 79, 5511–5520 CrossRef CAS PubMed; (b) L. I. Markova, E. A. Terpetschnig and L. D. Patsenker, Dyes Pigm., 2013, 99, 561–570 CrossRef CAS PubMed.
- A. Treibs and K. Jacob, Angew. Chem., Int. Ed., 1965, 4, 694 CrossRef.
- (a) L. Beverina and P. Salice, Eur. J. Org. Chem., 2010, 1207–1225 CrossRef CAS; (b) J. J. McEwen and K. J. Wallace, Chem. Commun., 2009, 6339–6351 RSC; (c) S. Sreejith, P. Carol, P. Chithra and A. Ajayaghosh, J. Mater. Chem., 2008, 18, 264–274 RSC; (d) B. Oswald, L. Patsenker, J. Duschl, H. Szmacinski, O. S. Wolfbeis and E. Terpetschnig, Bioconjugate Chem., 1999, 10, 925–931 CrossRef CAS PubMed.
- (a) J. V Ros-Lis, R. Martínez-Máñez and J. Soto, Chem. Commun., 2002, 2248–2249 RSC; (b) J. V Ros-Lis, B. García, D. Jiménez, R. Martínez-Máñez, F. Sancenón, J. Soto, F. Gonzalvo and M. C. Valldecabres, J. Am. Chem. Soc., 2004, 126, 4064–4065 CrossRef PubMed.
- E. Arunkumar, C. C. Forbes, B. C. Noll and B. D. Smith, J. Am. Chem. Soc., 2005, 127, 3288–3289 CrossRef CAS PubMed.
- J. M. Zwier, T. Roux, M. Cottet, T. Durroux, S. Douzon, S. Bdioui, N. Gregor, E. Bourrier, N. Oueslati, L. Nicolas, N. Tinel, C. Boisseau, P. Yverneau, F. Charrier-Savournin, M. Fink and E. Trinquet, J. Biomol. Screening, 2010, 15, 1248–1259 CrossRef CAS PubMed.
- L. D. Lavis and R. T. Raines, ACS Chem. Biol., 2008, 3, 142–155 CrossRef CAS PubMed.
- M. Davis and H. Helzer, Anal. Chem., 1966, 38, 451–461 CrossRef.
- D. L. Sackett and J. Wolff, Anal. Biochem., 1987, 167, 228–234 CrossRef CAS.
Footnote |
| † Electronic supplementary information (ESI) available: Detailed experimental procedures and analytical data for all the compounds. See DOI: 10.1039/c4cc09113b |
| This journal is © The Royal Society of Chemistry 2015 |

