 Open Access Article
Creative Commons Attribution 3.0 Unported Licence
Fluorographane (C1HxF1−x−δ)n: synthesis and properties†
Zdeněk
Sofer
a,
Petr
Šimek
a,
Vlastimil
Mazánek
a,
Filip
Šembera
b,
Zbyněk
Janoušek
b and
Martin
Pumera
*c
aDepartment of Inorganic Chemistry, University of Chemistry and Technology Prague, Technická 5, 166 28 Prague 6, Czech Republic
bInstitute of Organic Chemistry and Biochemistry AS CR, v.v.i., Flemingovo náměstí 2, 166 10 Prague 6, Czech Republic
cDivision of Chemistry & Biological Chemistry, School of Physical and Mathematical Sciences, Nanyang Technological University, Singapore 637371, Singapore. E-mail: pumera.research@gmail.com
First published on 19th February 2015
Abstract
Fluorographane (C1HxF1−x−δ)n was obtained from graphene by hydrogenation via the Birch reaction with consequent fluorination of the resulting graphane. Fluorographane exhibits fast heterogeneous electron transfer rates and hydrophobicity, which increase with increasing fluorination.
Hydrogenated graphene is a material with many interesting properties.1 Hydrogenation of graphene introduces a band gap, which can be tuned from 0 to 3.7 eV for graphene and fully hydrogenated graphene (graphane), respectively.2 Hydrogenated graphene exhibits fluorescence and paramagnetism,3 properties that are not seen in graphene.1 In addition, hydrogenated graphenes exhibit fast heterogeneous electron transfer rates.4 The properties of hydrogenated graphene can be tuned by the level of hydrogenation.5–9 In a similar manner fluorographene (C1F1)n shows a large band-gap which is tunable based on the level of fluorination.10 Fluorographene11 shows fluorescence and enhanced electrochemical properties12–14 and its 3D analogue, fluorographite, found applications in electrochemistry decades ago.15 In order to add additional vectors to tune the properties of hydrogenated graphene, one can consider covalently bonding a simple electronegative element to the graphane backbone. Since most of the properties of hydrogen are similar to those of halogens, recently performed theoretical studies on fluorinated graphane showed that the incorporation of fluorine into graphane would lead to additional opening of the band gap16 and that such materials exhibit a large piezoelectric effect.17 Fluorination of materials in general is an excellent way to tune their catalytic properties.18,19 To the best of our knowledge, no experimental report on the synthesis and properties of fluorographane has been published. Here, we report the synthesis of fluorographane via a two-step method, first involving the creation of C–H bonds in a graphene framework with consequent fluorination of the resulting hydrogenated graphene to create fluorographane. We report detailed characterization of fluorographane via combustible elemental analysis, X-ray photoelectron spectroscopy (XPS), scanning electron microscopy/X-ray energy dispersive spectroscopy, and infrared spectroscopy along with the heterogeneous electron transfer rates at various (C1HxF1−x−δ)n by cyclic voltammetry. We will show that while it is challenging to fluorinate graphite and graphene, which requires the use of high temperatures (∼200–400 °C), the hydrogenated graphene (graphane) is highly reactive and significant fluorination of graphane proceeds even at atmospheric pressure fluorination with the F2/N2 mixture for 1 h. Very high content of fluorine in fluorographane can be obtained at longer fluorination times and higher pressures.
The synthesis of hydrogenated graphene was performed via the Birch reduction process. Graphite was oxidized to graphite oxide (GPO) via the permanganate route (Hummers);20 GPO was reduced using hydrazine and by hydrogenation via the Birch method.3 The resulting hydrogenated graphene (graphane) with composition 45.54 at% of C, 49.81 at% of H, 4.40 at% of O and 0.26 at% of N of summary formula C1H1.09 was then exposed to various fluorination conditions: hydrogenated graphene was exposed to a fluorine/nitrogen gas mixture (20 vol% F2) at a pressure of 1 bar for 1 h; 5 bar for 24 h, and 5 bar for 24 h with consequent fluorination at 12 bar for another 24 h. The resulting materials, labeled accordingly as CHF [1 h:1 bar], CHF [24 h:5 bar], and CHF [24 + 24 h:5 + 12 bar], were characterized in detail.
We found that significant fluorination occurs at partial pressures of F2 as low as 0.2 bar for 1 h and that F2 1 bar for 24 h saturates graphane so that a consequent increase of pressure and time does not lead to a significant increase in the fluorine content in graphane, reaching a F/C ratio of 0.75. We performed a detailed characterization of the fluorine content as well as of the morphology of the resulting fluorographanes.
According to a combustible elemental analysis, the fluorographane materials prepared by this method contained for CHF [1 h:1 bar]: 50.10 at% of C, 37.21 at% of H, 8.77 at% of F, 3.69 at% of O and 0.22 at% of N; for CHF [24 h:5 bar]: 50.77 at% of C, 6.50 at% of H, 38.94 at% of F, 2.68 at% of O and 1.11 at% of N; and for CHF [24 + 24 h:5 + 12 bar]: 47.86 at% of C, 6.78 at% of H, 36.30 at% of F, 8.91 at% of O and 1.24 at% of N. This transfers to a summary formula of C1H0.74F0.17, C1H0.13F0.77, and C1H0.14F0.73, respectively. Delta (δ) in (C1HxF1−x−δ)n stands for the remaining elements, mostly O and traces of N, which were introduced during the synthesis. It is obvious from the results that with the increase of time and pressure of fluorination, there is a significant increase in the amount of fluorine at the expense of the amount of hydrogen; one can expect substitution reaction occurring during the fluorination of graphane. It can also be seen that fluorination proceeds under very mild conditions (0.2 bar F2, 1 h, room temperature) where the F/C ratio is 0.17 and dramatically increases to the saturation point at higher pressures of 1 bar (24 h) to an F/C ratio of ∼0.75. A further increase of pressure and time did not lead to higher content of F in graphane. A schematic of the proposed structure of fluorographane is shown in Scheme S1 (ESI†).
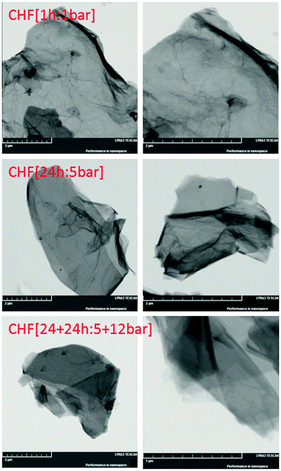
Scanning electron microscopy and X-ray energy dispersive spectroscopy (SEM/EDX) were carried out to investigate the morphology as well as the composition of the sample (Fig. S1, ESI†). SEM images confirmed that fluorinated graphane sheets are well exfoliated to single-to-few layered structures. SEM/EDX elemental mapping demonstrated that the graphane sheets are fluorinated homogeneously. EDX spectra showed a F/C ratio of 0.045 in CHF [1 h:1 bar], 0.62 in CHF [24 h:5 bar], and 0.75 in CHF [24 + 24 h:5 + 12 bar]. Small differences between the combustible elemental analyses are caused by the surface sensitivity of the SEM/EDX method, the morphology of the material, and the size of the sample. Note that H content cannot be determined by the EDX method. The presence of single- and few-layered sheets of fluorographane is clear in the STEM images (Fig. 1).
 | ||
Fig. 1 STEM image of fluorographane. The left column was obtained at 25![[thin space (1/6-em)]](https://www.rsc.org/images/entities/char_2009.gif) 000× magnification and the right column was obtained at 50 000× magnification and the right column was obtained at 50![[thin space (1/6-em)]](https://www.rsc.org/images/entities/char_2009.gif) 000× magnification. 000× magnification. | ||
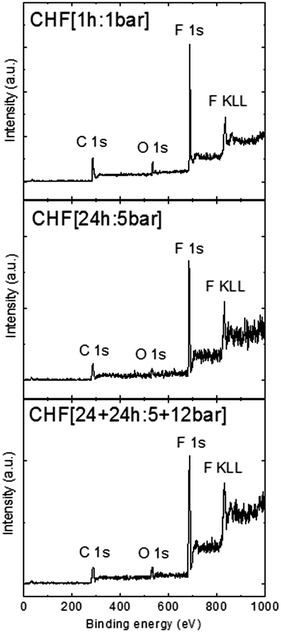
XPS analysis of the material was performed to reconfirm the incorporation of fluorine into fluorographane. Wide spectra XPS (Fig. 2) shows that fluorographanes exhibit the following F/C ratios: 0.59 for CHF [1 h:1 bar], 0.91 for CHF [24 h:5 bar], and 1.01 for CHF [24 + 24 h:5 + 12 bar]. High resolution spectra of C1s can provide deeper insight into the bond arrangement on the carbon lattice. Fig. S2 (ESI†) shows the fitting of the C1s peaks, demonstrating that with increasing time and pressure, there is a shift in the type of fluorinated bonds from C–F to CF2 and CF3 (see Table S1, ESI†). This can be explained by partial etching of carbon atoms and formation of perfluorinated terminal carbon atoms. Note that XPS cannot provide direct evidence of a C–H bond. We also performed high resolution XPS spectra measurement on the F 1s peak (see Fig. S3, ESI†). The results confirmed the presence of the C–F bond. A slight difference between F/C ratios as determined by various methods originates from different sensitivities of these methods. Combustible analysis takes into account the whole sample composition, while XPS is surface sensitive, taking into account only a few atomic layers whilst SEM/EDX provides analysis of a small portion of the sample.
We performed FTIR measurements of the fluorographanes, which indicate the presence of both C–H and C–F bonds (Fig. S4, ESI†). More specifically, for sample CHF [1 h:1 bar], C–H vibrations are clearly observable at 2845 cm−1 and 2915 cm−1 with overtones at 1420 cm−1. C–F vibrations are visible at 1040 cm−1. The twinning of C–H bonds indicates the presence of C–H and C–H2 functional groups. One can observe that the relative intensity of the C–H bond vibrations decreases with an increase in fluorination pressure/time and that only a weak band at 2950 cm−1 originating from the C–H bond can be observed in comparison to a very strong C–F vibration band at 1090 cm−1 with a weak shoulder at 1200 cm−1. This indicates the formation of CF2 and CF3 functional groups under higher pressure/higher temperature fluorine. Details of C–H bonds are shown in Fig. S5 (ESI†). Such observations are consistent with elemental combustible analysis as well as other spectroscopic data.
The Raman spectra of fluorinated graphene are shown in Fig. S6 (ESI†). The Raman spectra of graphene are dominated by two main bands termed as the D-band at 1340 cm−1 and the G-band located at 1565 cm−1. The D/band is associated with the defect in the sp2 hybridized carbon atom lattice, while the G-band is associated with the in-plane vibration in the graphene skeletal. In addition we can also observe the 2D band at 2670 cm−1 and the D + G band at 2920 cm−1. The peak observed at 1605 cm−1 as a shoulder of the G-band is termed as a D′ band. The intensity of the D′ band significantly increases with a higher fluorine concentration. An increase of the D′ band intensity can be associated with the defect induced by graphene etching by high pressure fluorine. This is also documented by AFM images discussed in the following paragraph. The ID/IG ratio indicates the disorder and defect concentration. The ratio increases with the increase of fluorine content from 1.08 for CHF [1 h:1 bar] to 1.21 for CHF [24 h:5 bar] and 1.22 for the CHF [24 + 24 h:5 + 12 bar] sample. We suggest that the structure of the fluorographane based on the presented analysis is similar to graphane with part of the hydrogen atoms exchanged for fluorine atoms, as shown in Scheme S1 (ESI†).
The atomic force microscopy (AFM) was used to obtain more information about the structure of the obtained fluorographane and the influence of the increase of pressure and time used for fluorination. The AFM images are shown in Fig. S7 (ESI†). The thickness of fluorographane slightly increases with a higher fluorine concentration from about 0.7–0.8 nm for sample CHF [1 h:1 bar] to about 0.9–1.0 nm for other two samples with a higher fluorine concentration. The fluorographane sheets have a flower-like structure which indicates intensive etching during the fluorination procedure.
Fluorographane has high hydrophobic properties. These properties can be used for the surface modification of various materials. We performed coating of silicon wafer and measured water contact angles for samples with different fluorine contents. The contact angle of CHF [1 h:1 bar] was 109°. The contact angle of CHF [24 h:5 bar] was 128° and the contact angle of CHF [24 + 24 h:5 + 12 bar] was 134°. This demonstrates the possible application of fluorographane for the development of protective layers with tailored wetability. The water droplets used for contact angle measurement are shown in Fig. 3. The solubility of fluorographane in non-polar solvents is demonstrated in Fig. S8 (ESI†). In addition the surface area of fluorgraphane with various degrees of fluorination is measured. The surface area of CHF [1 h:1 bar] is 21.55 m2 g−1, 16.30 m2 g−1 for CHF [24 h:5 bar] and 16.57 m2 g−1 for CHF [24 + 24 h:5 + 12 bar] samples.
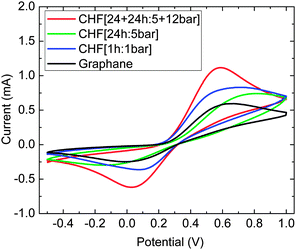
We have studied the electrochemical behavior of fluorographanes. For any electrochemical application, it is important to determine heterogeneous electron transfer of the material. We used ferro/ferricyanide as an electrochemical probe (Fig. 4). Cyclic voltammograms exhibited peak-to-peak (ΔE) separation of 522, 553, and 815 mV for CHF [1 h:1 bar], CHF [24 h:5 bar], and CHF [24 + 24 h:5 + 12 bar], respectively. For comparison also peak to peak separation for graphane with ΔE of 663 mV is shown. Heterogeneous electron transfer constant (k0) was calculated based on DE values using Nicolson's approach.21 The k0 found were 1.41 × 10⁻⁵, 9.24 × 10⁻⁶, and 2.64 × 10⁻⁷ cm s−1 for CHF [1 h:1 bar], CHF [24 h:5 bar], and CHF [24 + 24 h:5 + 12 bar], respectively. One can see that with increasing fluorine content in fluorographane the k0 increases. This trend is similar to the trend observed for fluorinated graphites and graphenes, where the HET rates increased with an increased amount of fluorine in the structure.22,23
 | ||
| Fig. 4 The cyclic voltammetry of fluorographanes and graphane investigated using the [Fe(CN)6]3−/4− redox probe (background electrolyte 50 mM PBS, pH = 7.0, 10 mM K4[Fe(CN)6], 100 mV s−1). | ||
In conclusion, for the first time we have successfully prepared fluorographanes with varied ratios of H and F. We used the Birch method for the preparation of hydrogenated graphene (graphane) followed by fluorination of the graphane. This new member of the graphene family shows fast heterogeneous electron transfer properties. We expect that fluorographane will find a variety of applications. Changes in the fluorine concentration can be used for the development of surface coating with tailored hydrophobic properties.
The project was supported by Czech Science Foundation (Project GACR No. 15-09001S) and by Specific university research (MSMT No. 20/2015). M.P. thanks Ministry of Education Singapore for Tier 2 grant.
Notes and references
- M. Pumera and C. H. Wong, Chem. Soc. Rev., 2013, 42, 5987 RSC.
- J. O. Sofo, A. S. Chaudhari and G. D. Barber, Phys. Rev. B: Condens. Matter Mater. Phys., 2007, 75, 153401 CrossRef.
- A. Y. S. Eng, H. L. Poh, F. Šaněk, M. Maryško, S. Matějková, Z. Sofer and M. Pumera, ACS Nano, 2013, 7, 5930 CrossRef CAS PubMed.
- A. Y. S. Eng, Z. Sofer, P. Simek, J. Kosina and M. Pumera, Chem. – Eur. J., 2013, 19, 15583 CrossRef CAS PubMed.
- R. A. Schafer, J. M. Englert, P. Wehrfritz, W. Bauer, F. Hauke, T. Seyller and A. Hirsch, Angew. Chem., Int. Ed., 2013, 52, 754 CrossRef PubMed.
- J. D. Jones, C. F. Morris, G. F. Verbeck and J. M. Perez, Appl. Surf. Sci., 2013, 264, 853 CrossRef CAS PubMed.
- H. Nejati and M. Dadsetani, Micron, 2014, 67, 30 CrossRef CAS PubMed.
- B.-L. Gao, Q.-Q. Xu, S.-H. Ke, N. Xu, G. Hu, Y. Wang, F. Liang, Y. Tang and S.-J. Xiong, Phys. Lett. A, 2014, 378, 565 CrossRef CAS PubMed.
- L. B. Drissi, K. Sadki, F. El Yahyaoui, E. H. Saidi, M. Bousmina and O. Fassi-Fehri, Comput. Mater. Sci., 2015, 96, 165 CrossRef CAS PubMed.
- R. Zboril, F. Karlicky, A. B. Bourlinos, T. A. Steriotis, A. K. Stubos, V. Georgakilas, K. Safarova, D. Jancik, C. Trapalis and M. Otyepka, Small, 2010, 6, 2885 CrossRef CAS PubMed.
- F. Karlický, K. K. R. Datta, M. Otyepka and R. Zbořil, ACS Nano, 2013, 7, 6434 CrossRef PubMed.
- R. R. Nair, W. Ren, R. Jalil, I. Riaz, V. G. Kravets, L. Britnell, P. Blake, F. Schedin, A. S. Mayorov, S. Yuan, M. I. Katsnelson, H.-M. Cheng, W. Strupinski, L. G. Bulusheva, A. V. Okotrub, I. V. Grigorieva, A. N. Grigorenko, K. S. Novoselov and A. K. Geim, Small, 2010, 6, 2877 CrossRef CAS PubMed.
- H. L. Poh, Z. Sofer, K. Klımova and M. Pumera, J. Mater. Chem. C, 2014, 2, 5198 RSC.
- S. Boopathi, T. N. Narayanan and S. S. Kumar, Nanoscale, 2014, 6, 10140 RSC.
- R. Yazami, in Electrochemical Properties of Graphite Fluorides, Metal Fluorides, and Oxide Fluoride-GICs, in Fluorine–Carbon and Fluoride–Carbon Materials, Chemistry, Physics and Applications, ed. T. Nakajima, Marcel Dekker, New York, 1995, pp. 251–281 Search PubMed.
- R. Paupitz, P. A. S. Autreto, S. B. Legoas, S. G. Srinivasan, A. C. T. van Duin and D. S. Galvão, Nanotechnology, 2013, 24, 035706 CrossRef CAS PubMed.
- R. A. Brazhe, A. I. Kochaev and A. A. Sovetkin, Phys. Solid State, 2013, 55, 2094 CrossRef CAS.
- J. C. Yu, J. Yu, W. Ho, Z. Jiang and L. Zhang, Chem. Mater., 2002, 14, 3808–3816 CrossRef CAS.
- W. Ho, J. C. Yu and J. Yu, Langmuir, 2005, 21, 3486–3492 CrossRef CAS PubMed.
- W. S. Hummers and R. E. Offeman, J. Am. Chem. Soc., 1958, 80, 1339 CrossRef CAS.
- R. S. Nicholson, Anal. Chem., 1965, 37, 1351 CrossRef CAS.
- X. Chia, A. Ambrosi, M. Otyepka, R. Zboril and M. Pumera, Chem. – Eur. J., 2014, 20, 6665 CrossRef CAS PubMed.
- S. Boopathi, T. N. Narayanan and S. S. Kumar, Nanoscale, 2014, 6, 10140 RSC.
Footnote |
| † Electronic supplementary information (ESI) available. See DOI: 10.1039/c4cc08844a |
| This journal is © The Royal Society of Chemistry 2015 |


