 Open Access Article
Creative Commons Attribution 3.0 Unported Licence
Comparison of antioxidant capacity assays with chemometric methods
Anita
Rácz
ab,
Nóra
Papp
a,
Emőke
Balogh†
a,
Marietta
Fodor
a and
Károly
Héberger
*b
aCorvinus University of Budapest, Faculty of Food Science, Department of Applied Chemistry, Villányi út 29-43, H-1118 Budapest XI., Hungary
bResearch Centre for Natural Sciences, Hungarian Academy of Sciences, Institute of Materials and Environmental Chemistry, Department of Plasma Chemistry, Magyar Tudósok krt. 2, H-1117 Budapest XI., Hungary. E-mail: heberger.karoly@ttk.mta.hu
First published on 8th April 2015
Abstract
Seven antioxidant capacity assays were compared and evaluated (ranked and grouped) using several statistical methods. The aim of the research was to compare the results of different antioxidant capacity assays and choose preferably one (or two) method(s), which could reproduce on its own the consensus results of all of the others. The two datasets (berries and sour cherries) gave quite similar results. Cluster analysis and principal component analysis could point out the methods that are most similar and best connected to each other. Not only are the groupings of the methods novel in this study but also the application of sum of ranking differences (SRD) and the generalized pair correlation method (GPCM) to compare and rank the various antioxidant capacity assays independently. In the case of berry samples, ferric ion reducing antioxidant power assay (FRAP) was the most successful as demonstrated by the results of SRD and GPCM. Moreover, GPCM (with conditional exact Fisher's test and probability weighted ordering) could distinguish between 2,2-diphenyl-1-picrylhydrazyl free radical scavenging (DPPH) and lipid soluble antioxidant capacity (ACL) methods, which was not revealed by the SRD procedure. In the case of sour cherry samples the total polyphenolic content (TPC) was the most appropriate method and FRAP was the second to replace all the other assays. GPCM could differentiate between FRAP and trolox equivalent antioxidant capacity (TEAC) methods. The suggested techniques were FRAP and TPC for both datasets to replace all the others, whereas the ACL and water soluble antioxidant capacity (ACW) techniques give extremely distant results.
Introduction
Antioxidant activity
Examination of antioxidant capacities has become a hot topic nowadays as health-conscious lifestyles are becoming more popular. Consequently, although the number of determination techniques increases rapidly, as of now, they are not able to determine the antioxidant capacity in vivo precisely.1Free radicals in cells are formed in biochemical processes under natural conditions, especially in oxidation processes. Some amounts of free radicals are required for the normal maintenance in vivo. A greater amount may damage lipids, proteins, nucleic acids and carbohydrates.2,3 Free radical formation is induced by internal and external factors (smoke, stress, alcohol, etc.). Antioxidants are able to decrease the free radical concentration or inhibit their formation. They are part of an integrated defense system for cellular components.4,5 Some well-known antioxidant components are for example vitamin E, vitamin C, polyphenols, carotenoids, zinc and copper.
Determination of antioxidant activity
Research dealing with antioxidants in foods, free radical scavenging of antioxidants and the determination of antioxidant capacity is becoming more intense.6–9 Consequently, the number of elaborated methods is over one hundred.1 The reason for this large variety is that they are unable to measure and model all of the natural in vivo reactions precisely.10 Different reactions perturb the measured values differently according to the reaction mechanism and the system used. Every method is selective for some antioxidant components and reactions and none of them are able to measure the capacity of all antioxidants properly.11The techniques can be grouped in many ways. Depending on what kind of reaction is involved, the methods can be classified into two groups: based on hydrogen atom transfer (HAT) and electron transfer (ET). HAT methods (for example ACL, ACW, and ORAC) are related to free radicals and based on reaction kinetics. Most of the HAT methods are based on a competitive reaction scheme, where the antioxidant and substrate compounds compete for thermally generated peroxyl radicals. The scheme of the reaction is as follows:12
| ROO˙ + AH → ROOH + A˙ | (1) |
ET methods (for example FRAP, TPC, TEAC, etc.) are based on the measurement of the capacity of an antioxidant in the reduction of an oxidant, which has a different color in its reduced form. From the change in color and from the extent of this change the antioxidant capacity can be determined.13 The reaction scheme of ET methods is as follows:12
| M(n) + e− (from AH) → AH˙+ + M(n − 1) | (2) |
All antioxidant capacity assays measure the same thing, the radical scavenging ability. However they produce different results, as the assays use different model compounds with various side reactions and other disturbing factors. Numerous antioxidant capacity assays are commonly applied. However, a justified answer is missing about which one(s) should be preferred. Some authors use only one assay without the knowledge of its systematic and random errors. Therefore, a justified substitution of all methods with a less biased (less erroneous) one is a desirable aim. The measurement of the antioxidant activity in fruits is a very popular topic nowadays, especially in berries, because generally their antioxidant effect is higher than for other fruits.14,15 In the present study, we measured the antioxidant capacity of berry and sour cherry cultivars. The aim of the study was to compare the antioxidant capacity assays using statistical methods (HCA, PCA, SRD and GPCM) and select the most representative method or methods for the available datasets based on time and cost efficiency. Grouping and detection of similarities and differences among the methods will also be revealed. The statistical methods presented below are suitable for comparison of other antioxidant capacity assays and datasets.
Results and discussion
Antioxidant capacity values for thirteen berry genotypes and twelve sour cherry cultivars were measured by seven antioxidant capacity assays in total (FRAP, TPC, TRSC, DPPH, ACL, and ACW for the berry samples and FRAP, TPC, TEAC, ACL, and ACW for the sour cherry samples). Every sample had two duplicates and each duplicate was measured three times. The average value of the measurements for each sample was used for the further statistical analysis.The first matrix (13 × 6) contained the berry sample antioxidant capacity values for six determination techniques (FRAP, TRSC, TPC, DPPH, ACL, and ACW). The second data matrix (12 × 5) contained the sour cherry sample antioxidant activity values for five techniques (TPC, FRAP, TEAC, ACL, and ACW). Both datasets were standardized before statistical evaluation. The software applied was the StatSoft, Inc. (2005) STATISTICA® (data analysis software system), version 7.1 for PCA and HCA and a custom-made Microsoft EXCEL VBA macros for SRD and GPCM. The macros are available on the internet: http://aki.ttk.mta.hu/srd and http://aki.ttk.mta.hu/gpcm.
First the comparisons and connections between the methods are shown in the results with PCA and HCA. Finally, the rankings by SRD and GPCM methods are presented.
HCA results
Fig. 1 presents the different clusters and connections between the antioxidant capacity methods in the case of berry samples. The Euclidian distance was used as distance measure and Ward's method as the linkage rule.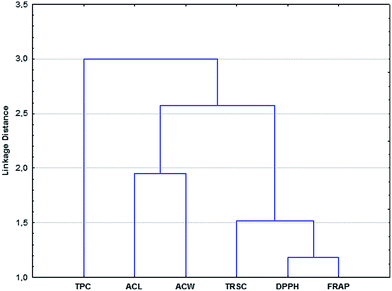 | ||
| Fig. 1 Grouping pattern of six different antioxidant activity assays (dendrogram) for berry dataset. Euclidean distance and Ward's method were used. | ||
Two groups are separated clearly, one contains the ACL and ACW techniques, and the other one contains the TRSC, DPPH and FRAP methods. It means that the results of these techniques are more similar (related more closely) to each other in the two separate groups.
Fig. 2 presents the grouping pattern for the sour cherry dataset. It compares and clusters five antioxidants capacity methods. The distance measure and the linkage rule were the same as for the previous case.
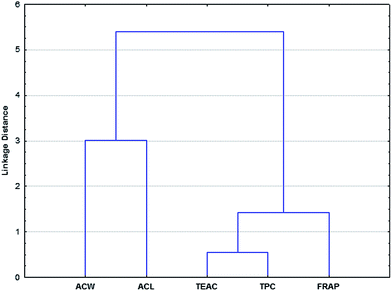 | ||
| Fig. 2 Grouping pattern of five different antioxidant activity assays (dendrogram) for sour cherry samples. Euclidean distance and Ward's method were used. | ||
Two clusters are also observed in this case. The ACW and ACL methods clearly form a distinct group and the other three are more closely connected to each other.
Cluster analysis can reveal similarities, but is not able to rank the different techniques, only to infer the connections. The coupling between the methods and the grouping pattern will be proved by PCA.
PCA results
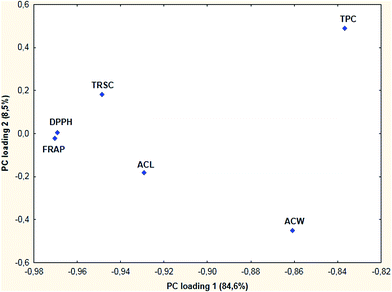
When PCA was applied to the berry data matrix the first two principal components were sufficient to explain the majority of the overall variance in the dataset (over 90%). When plotting the first and second PC loading vectors, the following observations can be summarized (Fig. 3).Most of the methods in the plot are scattered, but DPPH and FRAP are in close proximity. ACL, ACW and TPC are not grouped in the projection of PC loading 1 vs. PC loading 2.
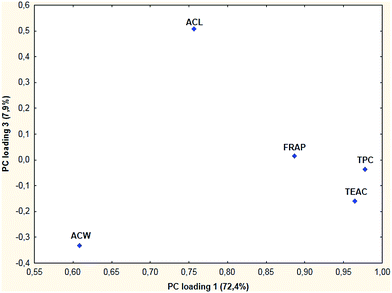
In the second case, when sour cherry samples were analyzed, the first three principal components were used for evaluation. Three principal components explained 98% of the variance in the data. The second and third components are “individual” components which means, that only one original variable carries most of the variance in that principal component. The projection of points for antioxidant capacity methods onto the plane defined by the first and third PC loading vectors shows the most characteristic clustering (Fig. 4).
The pattern can verify the results of cluster analysis (where ACW and ACL formed an individual cluster), because here ACW and ACL are detected as outliers (here PC loadings of less than 0.8 were considered as outliers). The points for the other three methods are close to each other as in the previous case.
Although the first dataset was not sufficient on its own for making conclusions, the PCA and HCA results together have shown that the ACW and ACL methods are very different from the others. The TPC, FRAP and TEAC methods have close resemblance, similar to the FRAP and DPPH methods in the case of berry samples. This is not so surprising if we consider the similarities between TPC and other ET-based assays (FRAP, TEAC) and the differences between ET-based and HAT-based assays (ACL, ACW). In the case of berry samples, the FRAP and DPPH methods are highly correlated with each other, the correlation coefficient is 0.941 (significant at the α = 0.05 level). Although in that case the correlation coefficients were significant for both ET-based and HAT-based methods, these results have shown that there are differences between the two types of antioxidant capacity assays.
SRD results
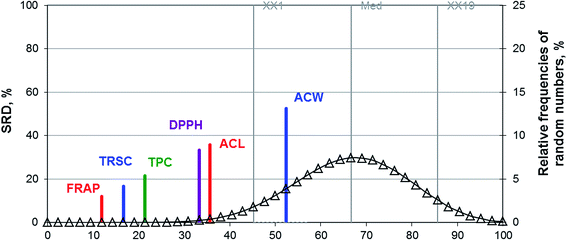
Before the evaluation, the data matrix had to be preprocessed. The number of rows and columns had to be added in the header and the “golden reference” had to be pasted as the last column of the table. In this case, the average was chosen as reference for all of the datasets. It can also be called consensus in accordance with the maximum likelihood principle, which yields a choice of the estimator as the value for the parameter that makes the observed data most probable (the average).16SRD is implemented in an Excel VBA program. SRD values are given in two scales. The first is the original one and the second is the scaled one denoted by SRDnor. In the diagram (Fig. 5) the scaled results are used, which makes the methods comparable, because the number of samples are different in the two datasets. The scaled SRD values are between 0 and 100. The equation of the scaling is as follows
| SRDnor = 100SRD/SRDmax, | (3) |
We have assumed that all methods measure the same antioxidant capacity with random and systematic errors (biases). Then the row-average (or row-sum) is the best way of data fusion. We can plausibly expect that the random errors and biases at least partially cancel each other out.
The lower the SRD value is, the closer it is to the reference (to the average). Thus, FRAP can substitute all methods for antioxidant capacity with the smallest error. We have also plotted the random probability distribution curve (a Gauss like one), which helps us decide whether the applied method is better than or similar to the use of random numbers. All of the methods produce better results than random numbers, except for ACW.
Validation of the ranking has been carried out using a randomization test and a seven-fold cross-validation. For the latter, the dataset was split into subsets and then each subset's SRD values were calculated. SRDs calculated on the seven 6/7th portion and the original SRD values define the uncertainty of the SRD values for each method. Otherwise, we would not know whether the colored lines on the diagram are indistinguishable or not (whether the distances between lines are negligible or statistically significant). The Box & Whisker plot shows the SRD ranges (minimum and maximum), the second and third quartiles (box in which the 50% of the data are located) and the median small box.
Fig. 6 shows that the median of DPPH and ACL is very close to each other. The null hypothesis is that the mean values of the methods are equal (assuming normality). The two sample t-test compares the mean SRD values pair-wise for all methods. Similarly, the nonparametric Sign and the Wilcoxon matched pair tests will reveal the differences in median values without distributional assumptions. The nonparametric tests were suitable, because not all SRD values followed normal distribution. The t-test and the nonparametric tests clearly indicated SRDs for DPPH and ACL are derived from the same distribution. The median SRDs for all other methods are significantly different.
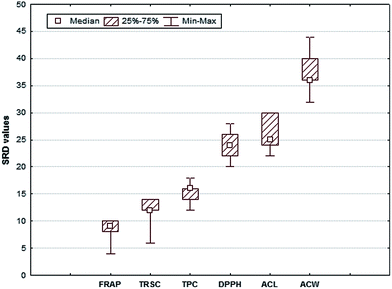 | ||
| Fig. 6 Box & Whisker plot of SRD % values for six antioxidant capacity methods of the berry dataset. The uncertainties for SRDs are derived from a seven-fold-cross-validation. | ||
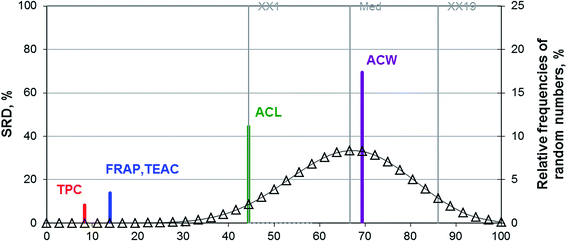
For the sour cherry dataset, SRD analysis was applied in the same manner as for the previous case. Scaled SRD values for the five methods are shown on Fig. 7.
Fig. 7 suggests that TPC has the smallest error out of the five applied methods and hence it can be used to replace all of the other methods. ACL and ACW methods are outside the acceptable region of the graph. FRAP and TEAC had the same SRD value, and their medians are indistinguishable according to the Sign and the Wilcoxon matched pair tests. The pattern found for the berry dataset is very similar to the one for the sour cherry dataset as evidenced by the Box & Whisker plot and the aforementioned tests.
The Box & Whisker plot and the above tests produced univocal results. Fig. 8 shows that the medians of FRAP and TEAC's SRD values are the same, and the parametric and nonparametric tests reject the null hypothesis, i.e. there is no significant difference between the SRD values of these two methods.
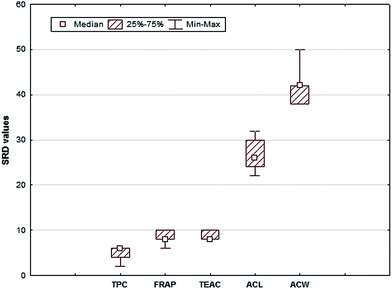 | ||
| Fig. 8 Box & Whisker plot of SRD % values for five antioxidant capacity methods of the sour cherry dataset. The uncertainties for SRDs are derived from a seven-fold-cross-validation. | ||
In addition, SRD could rank the different antioxidant activity methods for berry and sour cherry samples. For both datasets FRAP and TPC have the lowest SRD values, while ACW and ACL the highest.
GPCM results
GPCM may also be used for ranking antioxidant activity techniques. We wanted to verify the SRD results with another ranking method, which is based on entirely different calculations (and a different way of thinking). GPCM can be run using an Excel VBA program, so the dataset is quite similar to the SRD dataset, but the reference has to be in the first column for the evaluation. Again, the row average was selected as the “golden standard” (as in the case of SRD methodology).The analysis was completed for all possible variable pairs. Probability weighted ordering and conditional Fisher's exact test were chosen for GPCM analysis. In the case of probability weighted ordering, wins and losses are counted, but they are weighted with the calculated confidence level (= 1 − calculated significance level) based on a suitably chosen test statistic (in this work conditional Fisher's exact test).
Table 1 contains a selected GPCM result for the berry dataset. The variables are ordered according to the probability weighted differences between the number of wins and number of losses. FRAP and TRSC are associated the most with the Y variable, which contained the mean of the antioxidant capacity values. The probability corrected numbers of wins were very close to each other in the case of these two methods. The TPC method was the third one, just a little behind them. The ACW proved to be the worst method for this case.
| FRAP | TRSC | TPC | DPPH | ACL | ACW | |
|---|---|---|---|---|---|---|
| pWinner | 2.996796 | 2.995086 | 0.999994 | 0.995555 | 0.992692 | 0 |
| pLoser | 0 | 0 | 0 | 1.996419 | 1.995464 | 4.988241 |
| No decision | 2 | 2 | 4 | 2 | 2 | 0 |
| Rank by pWin-pLos | 1 | 2 | 3 | 4 | 5 | 6 |
| α (user) | 0.05 | α (emp.) | 0 | |||
| CondExact | No differences in Y | Crit. sum | 6.65 | 7 |
Table 2 contains the same selection of GPCM results for the sour cherry dataset as in the case of berry data. This time the TPC and FRAP assays were practically indistinguishable and superior to the other methods. The difference between the probability weighted numbers of wins minus numbers of losses for the two methods was very small. The third in line was TEAC and ACW was the last for this case, too.
| TPC | FRAP | TEAC | ACL | ACW | |
|---|---|---|---|---|---|
| pWinner | 1.999863 | 1.998376 | 1.989535 | 0.999711 | 0 |
| pLoser | 0 | 0 | 0 | 2.987774 | 3.999711 |
| No decision | 2 | 2 | 2 | 0 | 0 |
| Rank by pWin-pLos | 1 | 2 | 3 | 4 | 5 |
| α (user) | 0.05 | α (emp.) | 0 | ||
| CondExact | No differences in Y | Crit. sum | 5.7 | 6 |
The results are highly similar to the SRD results, but GPCM could even distinguish the methods DPPH and ACL in the first case, and FRAP and TEAC in the second case.
Experimental
Antioxidant capacity methods
The antioxidant capacity was determined by different assays. FRAP, which is based on the ferric reducing power of the antioxidants in the sample, was developed by Benzie and Strain.17 The reaction is based on the reduction of the Fe3+–TPTZ complex to the ferrous form (Fe2+–TPTZ) by the antioxidants at pH 3.6.| [Fe(III)(TPTZ)2]3+ + e− → [Fe(II)(TPTZ)2]2+ | (4) |
The reduced complex has a blue color, thus the reaction can be followed with a spectrophotometer at 593 nm.12
The total polyphenolic content was measured using the Folin–Ciocalteu's reagent according to the method of Singleton and Rossi.18,19 The reagent is a mixture of tungsten and molybdenum oxides and its color is yellow, while the product of the metal oxide reduction has a blue color. In the electron transfer reaction molybdenum(VI) is reduced to molybdenum(V). Contrary to its name the measurement is not selective for the polyphenolic components.13 The reaction can be followed at 760 nm.
The TEAC method was developed by Miller et al.20 The key reaction is that the antioxidants reduce the quantity of the 2,2′-azinodi-(3-ethylbenzothiazoline)-6-sulfonic acid free radical (ABTS˙+). The ABTS˙+ radical cation has a dark green color, but if antioxidants are in the reaction medium, the radical cation is transformed to ABTS2− and loses its color. The reaction can be followed with a spectrophotometer at 734 nm.21
The radical-scavenging activity was measured by DPPH22 and TRSC23 methods. The DPPH is one of the earliest methods, which uses the 2,2-diphenyl-1-picrylhydrazyl commercially available stable radical. Upon reduction the color of the solution fades. It can be measured with a spectrophotometer at 515 nm. The TRSC method is based on the inhibition of the H2O2/OH microperoxidase-luminol system. This system is emitting light in alkaline solution and OH˙ is generated from H2O2 in a Fenton type reaction by the iron complex (microperoxidase). The total scavenger capacity was measured by a chemiluminescence assay at 420 nm.24
The ACW and ACL antioxidant capacity was measured using methods described by Popov and Lewin.25,26 This assay involves the photochemical generation of superoxide anion free radicals (O2˙−) combined with chemiluminescence detection. The superoxide anion free radicals react with the antioxidant compounds present in the sample, while the quantity of the free radicals decreases. Luminol is activated by the residue of the superoxide radical anions and exhibits luminescence. Based on these reactions the method is suitable for the measurement of radical scavenging properties. The results are expressed in Trolox equivalent in the case of lipid soluble and in ascorbic acid equivalent in the case of water soluble antioxidant capacity.
Nicolet Evolution 300 BB (Thermo Electron Corporation, Cambridge, UK) was used for all spectrophotometric measurements. The TRSC is measured with a Lumat 9501 luminometer (Berthold, Bad Wildbad, Germany) and the ACW and ACL assays with a Photochem instrument (Analytik Jena AG, Jena, Germany). In the latter case the hydrophilic antioxidants were measured with the ACW kit, which contains 1.5 mL reagent 1 (carbonate buffer solution pH 10.5), 1 mL reagent 2 and 25 μL reagent 3 (luminol as the photosensitizer). The lipophilic antioxidants were measured with the ACL kit. The main components of the kit are as follows: Merck methanol (reagent 1), carbonate buffer solution (reagent 2) and working solution of reagent 3 (luminol as the photosensitizer).25,26
Statistical methods
A basic assumption in the use of PCA is that the score and loading vectors corresponding to the largest eigenvalues contain the most useful information related to a specific problem and that the remaining ones comprise mainly the noise. The points (samples) are projected onto a subspace of smaller dimensions, where dominant groups (clusters) and outliers can be observed. The similarity of variables can also be evaluated (i.e. from the directions, PC loadings) only their scaling is different – between −1 and +1 – in the case of a standardized input matrix. In the present study the variables (assays), were grouped and evaluated, though the pattern (similarity) of samples was also calculated (data not shown).
The general comparison of the four statistical methods is shown in Table 3. The methods are compared according to the type, used software, distance measure, significance test and robustness.
| HCA | PCA | SRD | GPCM | |
|---|---|---|---|---|
| Method type | Unsupervised | Unsupervised | Supervised | Supervised |
| Parametric | Parametric | Non-parametric | Non-parametric | |
| Pattern recognition | Pattern recognition | Ranking/pattern recognition | Ranking | |
| Used distance measure | Euclidean | Euclidean | Manhattan | Non-distance based |
| Software | Statistica 12 | Statistica 12 | MS Excel (with specially developed macro) | MS Excel (with specially developed macro) |
| Significance test | — | Cross-validation | Wilcoxon matched Pair test | McNemar's/conditional Fisher's test |
| Robustness | Non-robust | Non-robust | Non-robust/robust | Robust |
Conclusion
Although the chemometric methods provide somewhat deviating results, credible general conclusions can be drawn: the principal component analysis (PCA) and hierarchical cluster analysis (HCA) prove that the antioxidant capacity assays based on similar principles are connected to each other closely. All statistical methods suggest that water soluble antioxidant capacity (ACW) and lipid soluble antioxidant capacity (ACL) methods differ from the others. It can be a confirmation of the difference between the reaction mechanism of the group of ACL, ACW and the other used methods. Ferric ion reducing antioxidant power assay, FRAP, (and total polyphenolic content methods, TPC) was recommended to substitute all the other antioxidant capacity methods for both datasets. Our goal was to determine which assay(s) can be used with the least error, if we have to choose only one technique. Sum of ranking differences and the pairwise correlation method order antioxidant capacity assays in a statistically correct way using Wilcoxon's matched pair test, Conditional Fisher's exact test, McNemar's test, etc. The mentioned methods based on different ways of thinking and different ways of calculation still support each other in revealing the order of assays.Abbreviations
| ACL | Lipid soluble antioxidant capacity |
| ACW | Water soluble antioxidant capacity |
| HCA | Hierarchical cluster analysis |
| DPPH | 2,2-Diphenyl-1-picrylhydrazyl free radical scavenging effect |
| FRAP | Ferric ion reducing antioxidant power assay |
| PCA | Principal component analysis |
| GPCM | Pairwise correlation method |
| SRD | Sum of ranking differences |
| TEAC | Trolox equivalent antioxidant capacity |
| TPC | Total polyphenolic content |
| TRSC | Total radical scavenging capacity |
Acknowledgements
This work was supported by the OTKA 84290 grant. The authors thank Christos Argyropoulos and Dávid Bajusz for their helpful advice.References
- U. Cornelli, Clin. Dermatol., 2009, 27, 175–194 CrossRef PubMed.
- Z. Djuric, J. B. Depper, V. Uhley, D. Smith, S. Lababidi, S. Martino and L. K. Heilbrun, J. Am. Diet. Assoc., 1998, 98, 524–528 CrossRef CAS.
- E. Cadenas, Annu. Rev. Biochem., 1989, 58, 79–110 CrossRef CAS PubMed.
- I. F. F. Benzie, Eur. J. Nutr., 2000, 39, 53–61 CrossRef CAS.
- B. Halliwell and J. M. C. Gutteridge, Free Radical Biol. Med., 1995, 18, 125–126 CrossRef CAS.
- E. N. Frankel and J. W. Finley, J. Agric. Food Chem., 2008, 56, 4901–4908 CrossRef CAS PubMed.
- H. J. C. Froufe, R. M. V Abreu and I. C. F. R. Ferreira, Chemom. Intell. Lab. Syst., 2011, 109, 192–196 CrossRef CAS PubMed.
- V. M. Moo-Huchin, I. Estrada-Mota, R. Estrada-León, L. Cuevas-Glory, E. Ortiz-Vázquez, M. De Lourdes Vargas Y Vargas, D. Betancur-Ancona and E. Sauri-Duch, Food Chem., 2014, 152, 508–515 CrossRef CAS PubMed.
- K. I. Berker, K. Güçlü, B. Demirata and R. Apak, Anal. Methods, 2010, 2, 1770–1778 RSC.
- E. N. Frankel and A. S. Meyer, J. Sci. Food Agric., 2000, 80, 1925–1941 CrossRef CAS.
- E. Niki, Nutrition, 2002, 18, 524–525 CrossRef.
- D. Huang, O. U. Boxin and R. L. Prior, J. Agric. Food Chem., 2005, 53, 1841–1856 CrossRef CAS PubMed.
- R. Apak, K. Güçlü, B. Demirata, M. Özyürek, S. E. Çelik, B. Bektaşoǧlu, K. I. Berker and D. Özyurt, Molecules, 2007, 12, 1496–1547 CrossRef CAS.
- H. Wang, G. Cao and R. L. Prior, J. Agric. Food Chem., 1996, 44, 701–705 CrossRef CAS.
- X. Wu, G. R. Beecher, J. M. Holden, D. B. Haytowitz, S. E. Gebhardt and R. L. Prior, J. Agric. Food Chem., 2004, 52, 4026–4037 CrossRef CAS PubMed.
- T. Hastie, R. Tibshirani and J. Friedman, in The Elements of Statistical Learning; Data Mining, Inference, and Prediction, Springer, New York, 2001, p. 31 Search PubMed.
- I. F. F. Benzie and J. J. Strain, Anal. Biochem., 1996, 239, 70–76 CrossRef CAS PubMed.
- V. L. Singleton and J. A. Rossi, Am. J. Enol. Vitic., 1965, 16, 144–158 CAS.
- V. L. Singleton, R. Orthofer and R. M. Lamuela-Raventós, Methods Enzymol., 1998, 299, 152–178 Search PubMed.
- N. J. Miller, C. Rice-Evans, M. J. Davies, V. Gopinathan and A. Milner, Clin. Sci., 1993, 84, 407–412 CAS.
- P. Stratil, B. Klejdus and V. Kubáň, Talanta, 2007, 71, 1741–1751 CrossRef CAS PubMed.
- M. S. Blois, Nature, 1958, 4617, 1198–2000 Search PubMed.
- A. Blázovics, A. Kovács, A. Lugasi, K. Hagymási, L. Bíró and J. Fehér, Clin. Chem., 1999, 45, 895–896 Search PubMed.
- E. Balogh, A. Hegedus and É. Stefanovits-Bányai, Sci. Hortic., 2010, 125, 332–336 CrossRef CAS PubMed.
- I. N. Popov and G. Lewin, Free Radicals Biol. Med., 1994, 17, 267–271 CrossRef CAS.
- I. N. Popov and G. Lewin, J. Biochem. Biophys. Methods, 1996, 31, 1–8 CrossRef CAS.
- S. Wold, K. Esbensen and P. Geladi, Chemom. Intell. Lab. Syst., 1987, 2, 37–52 CrossRef CAS.
- M. Radunić, M. Jukić Špika, S. Goreta Ban, J. Gadže, J. C. Díaz-Pérez and D. MacLean, Food Chem., 2015, 177, 53–60 CrossRef PubMed.
- L. N. Ceci and A. a. Carelli, J. Am. Oil Chem. Soc., 2007, 84, 1125–1136 CrossRef CAS PubMed.
- T. Hastie, R. Tibshirani and J. Friedman, in The Elements of Statistical Learning; Data Mining, Inference, and Prediction, Springer, New York, 1st edn, 2001, pp. 472–475 Search PubMed.
- M. Otto, in Chemometrics, Wiley–VCH, Weinheim, Germany, 1st edn, 1999, pp. 148–156 Search PubMed.
- F. Andrić and K. Héberger, J. Chromatogr., 2015, 1380, 130–138 CrossRef PubMed.
- P. Melgarejo-Sánchez, J. J. Martínez, P. Legua, R. Martínez, F. Hernández and P. Melgarejo, Sci. Hortic., 2015, 182, 65–72 CrossRef PubMed.
- K. Héberger, TrAC, Trends Anal. Chem., 2010, 29, 101–109 CrossRef PubMed.
- K. Héberger and K. Kollár-Hunek, J. Chemom., 2011, 25, 151–158 CrossRef PubMed.
- W. Nowik, S. Héron, M. Bonose and A. Tchapla, Analyst, 2013, 138, 5801–5810 RSC.
- N. S. H. N. Moorthy, N. M. F. S. A. Cerqueira, M. J. Ramos and P. A. Fernandes, Chemom. Intell. Lab. Syst., 2015, 140, 102–116 CrossRef CAS PubMed.
- K. Héberger and R. Rajkó, J. Chemom., 2002, 16, 436–443 CrossRef PubMed.
- R. Rajkó and K. Héberger, Chemom. Intell. Lab. Syst., 2001, 57, 1–14 CrossRef.
- W. J. Conover, in Practical Nonparametric Statistics, John Wiley & Sons, New York, USA, 2nd edn, 1980,pp. 130–133 Search PubMed.
- W. J. Conover, in Practical Nonparametric Statistics, John Wiley & Sons, New York, USA, 2nd edn, 1980, pp. 189–199 Search PubMed.
Footnote |
| † Present address: Richter Gedeon Plc., Gyömrői út 19-21, H-1103 Budapest X., Hungary. |
| This journal is © The Royal Society of Chemistry 2015 |

