 Open Access Article
Creative Commons Attribution 3.0 Unported Licence
Real-world carbon nanoparticle exposures induce brain and gonadal alterations in zebrafish (Danio rerio) as determined by biospectroscopy techniques†
Junyi
Li
a,
Guang-Guo
Ying
b,
Kevin C.
Jones
a and
Francis L.
Martin
*a
aCentre for Biophotonics, Lancaster Environment Centre, Lancaster University, Lancaster LA1 4YQ, UK. E-mail: f.martin@lancaster.ac.uk; Tel: +44 (0)1524 510206
bState Key Laboratory of Organic Geochemistry, Guangzhou Institute of Geochemistry, Chinese Academy of Sciences, Guangzhou 510640, China
First published on 24th February 2015
Abstract
Carbon-based nanoparticles (CNPs) have emerged as novel man-made materials with diverse applications, which may present significant risks to organisms. To bridge the gap in our knowledge of nanotoxicology, a number of in vitro or in vivo studies have been carried out. However, toxicity data remains limited. Herein, we employed a biospectroscopy approach to assess CNP-induced effects in zebrafish (Danio rerio). Zebrafish were exposed to Fullerene (C60), long or short multi-walled carbon nanotubes (MWCNTs), or single-walled carbon nanotubes (SWCNTs) for 21 days at two concentrations: 0.1 mg L−1 or 0.001 mg L−1. Following exposure, the brain, gills, gonads and liver from zebrafish were interrogated by attenuated total reflection Fourier-transform infrared (ATR-FTIR) or Raman spectroscopy. Computational analysis was then applied to the acquired infrared (IR) spectra, and distinct biochemical segregations between the exposed tissues vs. control were observed with spectral biomarkers of alterations identified. In addition, lipid-to-protein ratios in all four tissues were calculated by the IR spectra; unsaturated lipid levels in brain and gonad were assessed by Raman spectroscopy. Marked lipid alterations were observed. These findings show that biospectroscopy approaches have the potential to detect CNP-induced biochemical alterations in zebrafish.
1. Introduction
Nanotechnology has introduced a wide range of man-made materials into the environment. Fullerene (C60) and carbon nanotubes (CNTs) are the most promising manufactured carbon-based nanomaterials. With their unique physico-chemical properties, these materials offer extraordinary opportunities for applications in industry, biomedicine or everyday life.1–5 Increasing interest commercially or scientifically is leading to massive production and application of these materials. However, little is known of their potential toxicity, or even how these materials will behave during the manufacturing process and in the environment.6,7 Consequently, this emerging issue is drawing more and more attention worldwide from scientists and governments.Increasingly, numerous investigators are examining the toxic interactions of carbon nanoparticles (CNPs) with cells. Jia et al. observed that carbon nanomaterials (SWCNTs, MWCNTs or C60) with different geometric structures induce varying levels of cytotoxicity in alveolar macrophages.8 Additional studies showed that CNPs cause cytotoxicity in HaCat human keratinocytes,9 human osteoblasts and fibroblasts,10 and human T-lymphocytes.11 Other biological models such as bacteria,12,13 algae,14Daphnia magna15 and, even, fish16 or rats17 have been employed to study such adverse effects. However, in vitro observations do not always faithfully extrapolate to the in vivo situation. Also, sometimes conventional assays are limited in their ability to assess nanoparticles.18 To date, the understanding of CNPs’ toxicity remains limited and a paradigm-shifting methodology is required to offset such challenges.
Spectroscopy is increasingly used as a powerful tool in biological research. Infrared (IR) spectroscopy, including attenuated total reflection Fourier-transform infrared (ATR-FTIR) spectroscopy, has been applied in disease diagnosis19 and toxic assessment of environmental contamination within cells.20,21 In ATR-FTIR instrumentation, a mid-IR beam (λ = 2–20 μm) is transmitted through an internal reflection element (e.g., diamond, zinc selenide, germanium, silicon) in contact with the samples and penetrates a small distance beyond the sample surface, allowing the generation of biochemical fingerprint spectra (1800–900 cm−1). Raman spectroscopy is a complimentary spectral method, which can also detect a wide range of chemical bonds in cells and tissues.22 Some excellent studies have already shown that Raman spectroscopy can also be applied to assess nanotoxicity.23,24 Such biospectroscopy tools employed in biological investigations may generate a large amount of spectral data, which requires computational analysis in order to extract information.25
Previously, we employed ATR-FTIR spectroscopy coupled with computational analysis to detect CNP-induced alterations in MCF-7 cells; dose-related effects were observed.26 This suggests biospectroscopy as a novel tool capable of identifying the effects of CNPs.27 Aquatic environments may act as a sink for environmental contaminants including CNPs,28 and some studies have already reported that single-walled CNTs and C60 exert toxic effects in rainbow trout (Oncorhynchus mykiss),29 and that MWCNTs induce toxicity in zebrafish embryos.30 Thus, it is essential to develop sensitive and reliable methods to assess biological effects of CNPs in fish. Additionally, zebrafish are a well-established model organism widely applied in biological medicine31 and toxicological assessment.32 In order to address the limitations of in vitro tests and extrapolate to the in vivo situation, we conducted tests on zebrafish (Danio rerio) following exposure to CNPs and interrogated the tissues using spectroscopy. In this study, zebrafish were exposed to four CNPs (C60, short and long MWCNTs or SWCNTs) at concentrations of 0.1 mg L−1 or 0.001 mg L−1. Following 21-day exposure, alterations in tissues including brain, gills, gonads and liver were then assessed via biospectroscopy with computational analysis. Our aim was to ascertain real-world CNP effects in a model system.
2. Materials and methods
Chemicals and carbon nanoparticles
Bovine serum albumin (BSA) obtained from Sigma was ≥98%. All CNPs were purchased from Sigma. Short MWCNTs were >90% pure being 10–15 nm in diameter and 0.1–10 μm in length. Long MWCNTs were >90% pure also, but were 110–170 nm in diameter and 5–9 μm in length. C60 had a purity >99.5% and particle size of 1 nm. SWCNTs were described as CarboLex AP-grade (the purity of AP-grade products ranges from 50% to 70% by volume); major impurities are carbon nanospheres and carbon-encapsulated catalyst nanoparticles – the diameter was 1.2–1.5 nm. All CNPs were analysed by Raman spectroscopy (Renishaw PLC, UK) with a 785 nm laser, and determined to be of high purity. Additionally, images of CNPs were taken using a scanning electron microscope (SEM) [JSM 5600 (JEOL)] [see ESI Fig. S1†]. CNPs were dispersed in 1% BSA solution with a 15 min ultrasonication and stock solutions were made at concentrations of 100 mg L−1 and 1 mg L−1. CNT solutions were stable and well-dispersed, while C60 appeared to agglomerate.Fish maintenance and experimental conditions
All experiments were carried out following approval from the local Institutional Review Board. Zebrafish were maintained in the Aquatic Toxicology Laboratory at the Guangzhou Institute of Geochemistry, Chinese Academy of Sciences. All fish were kept in 50 L flow-through tanks filled with dechlorinated tap water in a temperature-controlled room maintained at 27 ± 1 °C. The room was on a 14![[thin space (1/6-em)]](https://www.rsc.org/images/entities/char_2009.gif) :
:![[thin space (1/6-em)]](https://www.rsc.org/images/entities/char_2009.gif) 10 h light
10 h light![[thin space (1/6-em)]](https://www.rsc.org/images/entities/char_2009.gif) :
:![[thin space (1/6-em)]](https://www.rsc.org/images/entities/char_2009.gif) dark cycle, and fish were fed once a day with a quantity of commercial food at 5% of the wet weight.
dark cycle, and fish were fed once a day with a quantity of commercial food at 5% of the wet weight.
Fish exposures were conducted in 10 L glass tanks, and each experimental tank contains 5 L dechlorinated tap water and 4 fish (2 males, 2 females). Prior to exposure, zebrafish in 50 L tanks were randomly transferred to the experimental tank for a 7-day adaptive period. Following this, CNP exposure was initiated and run for 21 days. There were nine randomly assigned tanks for each exposure (control and treatment with one of four CNPs at 0.1 mg L−1 or 0.001 mg L−1). Exposure concentrations were chosen based on previous in vitro studies,26 which showed that speculated real-world environmental levels induced alterations in exposed cell populations detectable by biospectroscopy techniques. To minimize contamination, fish were only fed in the morning every day and in the afternoon, each tank was cleaned to eliminate fish faeces and food remains by siphoning the water out of the tanks. Then all tanks were filled with fresh water and treatment. All fish were terminated at the end of the exposure and were sacrificed within seconds by immersion in melting ice prior to body size measurements (weight and length) (see ESI Fig. S2†). From each fish, gills, brain, liver and gonads were independently harvested and fixed in 70% ethanol. Exposure experiments were conducted in triplicate.
Biospectroscopy analysis
Each fixed fish tissue for spectral interrogation was thinly sliced by hand and mounted on IR-reflective low-E slides (Kevley Technologies, USA), allowed to air-dry and stored in a desiccator prior to spectral acquisition. All tissue samples were interrogated using a Bruker TENSOR 27 FTIR spectrometer (Bruker Optics Ltd., UK) equipped with a Helios ATR attachment containing a diamond internal reflection element (IRE). Instrument parameters were set at 32 scans, 16 cm−1 resolution. For each slide, 10 IR spectra were acquired at different points across the sample. Prior to starting a new slide, the ATR crystal was cleaned with deionized water and a background taken. Additionally, the brain and gonad tissues from the control group and the high-dose treatment groups for the four CNPs were further interrogated by Raman spectroscopy. Raman spectra were recorded using an InVia Renishaw Raman spectrometer (Renishaw plc, UK) equipped with a 785 nm streamline focus laser and a Renishaw-automated 100 nm encoded XYZ stage. The system parameters consisted of 50 μm entrance slit, 830 lines mm−1 (∼1.69 cm−1 spectral resolution) diffraction grating dispersing Raman signal onto a master Renishaw Pelletier cooled charge detector (CCD, 1024 pixel × pixel). The system calibration was carried out using an internal Renishaw silicon calibration source for wavenumber shift. A white light camera mounted on the microscope was used to visualize the locations of the spectral acquisition. Spectra were collected using a Leica ×50 objective lens (numeral aperture 0.75) at 50% laser power (≤100 mW prior to lens) of 20-second exposure and spectral range covering 2000–500 cm−1. Approximately 30 spectra were obtained from different sites from each sample.Data analysis
All spectral data acquired from both ATR-FTIR and Raman spectroscopy were processed using our IRootLab toolbox (http://irootlab.googlecode.com)33 running on MATLAB r2010a (The MathWorks, Inc., US). IR spectra were pre-processed as follows: cut to 1800–900 cm−1 (the biochemical fingerprint range), rubberband baseline correction and normalization to the Amide I peak (1650 cm−1). Computational analysis using multivariate techniques including principal component analysis (PCA) and linear discriminant analysis (LDA) can efficiently analyse such large spectral datasets. Following pre-processing, cross-calculated PCA-LDA was applied to the dataset; information was extracted and visualised as scores plots and cluster vectors. PCA is an unsupervised technique employed to reduce the dimensions of the data, and then the PCA scores are used as input for the subsequent LDA, where the class’ information contributes to differentiation of the derived clusters. To eliminate the risk of LDA overfitting, “cross-calculation” was applied to the PCA-LDA scores (see ESI Fig. S3†). It utilizes leave-one-out cross-validation to train the PCA-LDA loadings using n-1 (n = number of spectra in the dataset) samples and subsequently calculates the scores for the remaining sample, repeating this process until all scores are calculated. The loadings are derived as averages between the n PCA-LDA loadings model. Additionally, the number of principal components (PCs) for PCA-LDA was calculated by classification with an optimization procedure. The output data derived from PCA-LDA can be then visualized as 1-D, 2-D or 3-D scatterplots (“scores plots”). In scores plots, nearness between two groups means similarity, while increasing distance indicates dissimilarity. To reveal the biochemical alterations associated with each group in the dataset, PCA-LDA cluster vectors were developed.25 To simplify the identification of the main biochemical alteration of each group, cluster vectors plots were used to indicate the first eight highest peaks; tentative assignments of the peak wavenumbers are listed (see ESI,† pages 25–46), ranked by peak height.Lipid accumulation and unsaturated levels in tissues exposed to CNPs
Lipid accumulation in tissues was calculated by measuring the lipid-to-protein ratio using the intensity absorbance at two vibration modes derived from the pre-processed IR spectra. The intensity absorbance at 1400 cm−1 corresponding to C![[double bond, length as m-dash]](https://www.rsc.org/images/entities/char_e001.gif) O symmetric stretching of amino acid was used as a protein marker, while the intensity absorbance at 2924 cm−1 was associated with νasCH2 for lipid. In Raman spectra, the intensity at 1445 cm−1 was assigned to CH2 bending for lipid and the intensity at 1670 cm−1 was assigned to ν(C
O symmetric stretching of amino acid was used as a protein marker, while the intensity absorbance at 2924 cm−1 was associated with νasCH2 for lipid. In Raman spectra, the intensity at 1445 cm−1 was assigned to CH2 bending for lipid and the intensity at 1670 cm−1 was assigned to ν(C![[double bond, length as m-dash]](https://www.rsc.org/images/entities/char_e001.gif) C) in lipid. The ratio of (C
C) in lipid. The ratio of (C![[double bond, length as m-dash]](https://www.rsc.org/images/entities/char_e001.gif) C)/(CH2) can be used to calculate the lipid unsaturated level.34
C)/(CH2) can be used to calculate the lipid unsaturated level.34
Repeated-measures one-way analysis of variance (ANOVA) with Dunnett's post hoc tests were used to examine whether the alteration of the tissues observed in scores plots (LD1 and LD2), and the ratios of lipid/protein and (C![[double bond, length as m-dash]](https://www.rsc.org/images/entities/char_e001.gif) C)/(CH2) differed significantly between the exposure vs. control groups. It's not necessary to transform data to meet the underlying assumption of homogeneity between categories and normality of residuals. P-values below 0.05 were considered statistically significant. All ANOVA tests were conducted in GraphPad Prism 4 (GraphPad Software, USA).
C)/(CH2) differed significantly between the exposure vs. control groups. It's not necessary to transform data to meet the underlying assumption of homogeneity between categories and normality of residuals. P-values below 0.05 were considered statistically significant. All ANOVA tests were conducted in GraphPad Prism 4 (GraphPad Software, USA).
3. Results and discussion
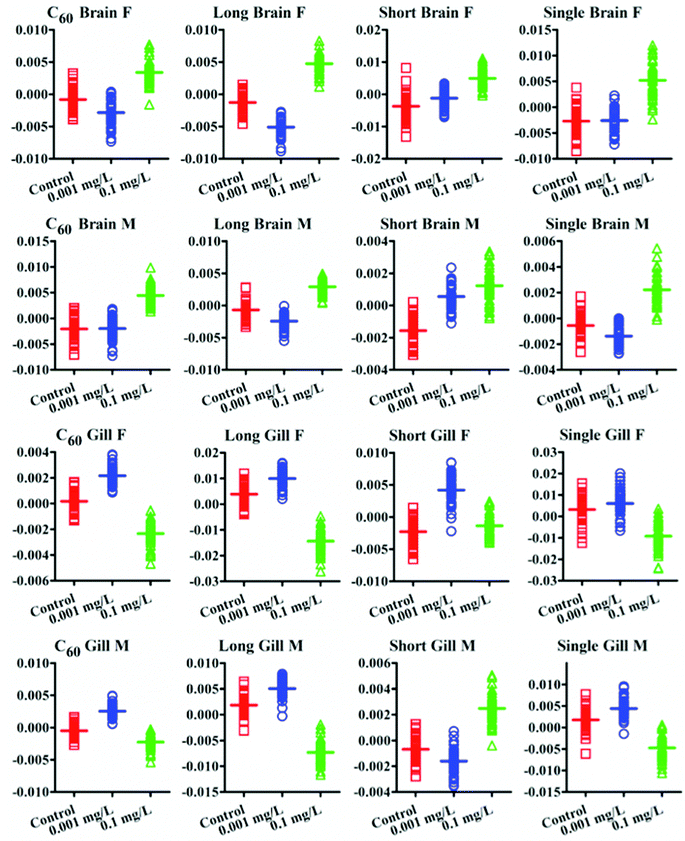
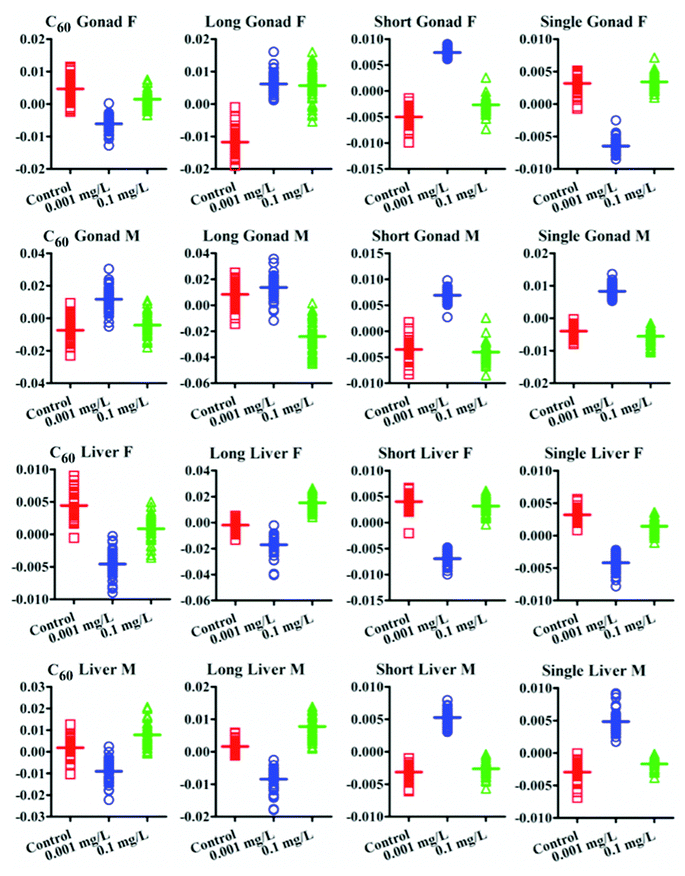
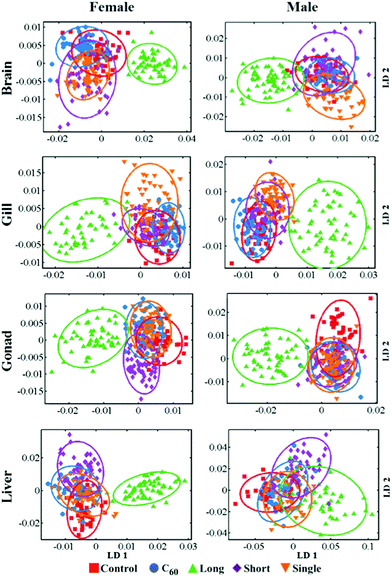
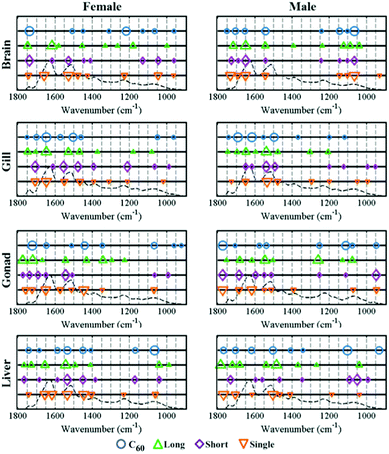
When zebrafish were exposed to one of the four CNPs tested, the response for each tissue examined was different and varied with exposure. CNP-specific dose responses compared to the control group were observed in all tissues examined, including brain, gills, gonads and liver (see ESI Fig. S4–S7†). Additionally, ANOVA tests showed that these were significant for the majority of exposures (see ESI Tables S1 and S2†). In the scores plots along the LD1 dimension, most category separation was observed; these simply show the effects for each tissue resulting from two different CNP exposures (Fig. 1 and 2). It is clearly noted that along LD1, the gills and brain exhibit a similar response pattern to the four different CNPs. In contrast, the gonads and liver display an inverse response to these exposures, with the lower dose inducing more pronounced effects than the higher. On a physiologically-based toxickinetics (PBTK) model, the gills are considered the initial site for uptake and elimination of CNPs, while brain, gonads and liver connected with the gills via arterial blood are perturbed by CNPs.35 It is noted that in zebrafish, blood circulating in veins from the gonads will reach the liver, which may explain why these tissues respond similarly to CNPs. To highlight the main biochemical alterations induced by CNPs, a cluster vectors method was employed following cross-calculated PCA-LDA. CNP exposures generate a range biochemical alterations associated with lipid, protein, glycogen and DNA/RNA (see ESI†).To reveal the profile of effects induced by CNPs, a dataset was developed to profile alterations in zebrafish tissues following CNP exposures at a concentration of 0.1 mg L−1 compared to the control group. Segregation in 2-D cross-calculated PCA-LDA scores plots showed that long MWCNTs, possessing a relatively larger size, exert the most pronounced alterations in the four tissues studied compared to the other three CNPs (Fig. 3). The cluster vectors plots indicate that long MWCNTs-induced effects in tissues are mainly to lipid and protein, with limited alterations in the DNA/RNA region (Fig. 4). However, C60 appears to induce a high level of alterations in the DNA/RNA region, especially in the brain. SWCNTs- and short MWCNTs-induced alterations in zebrafish appear to be similar. To investigate the brain and gonads further, Raman spectroscopy was employed to interrogate these two tissues; significant post-exposure alterations were again observed.
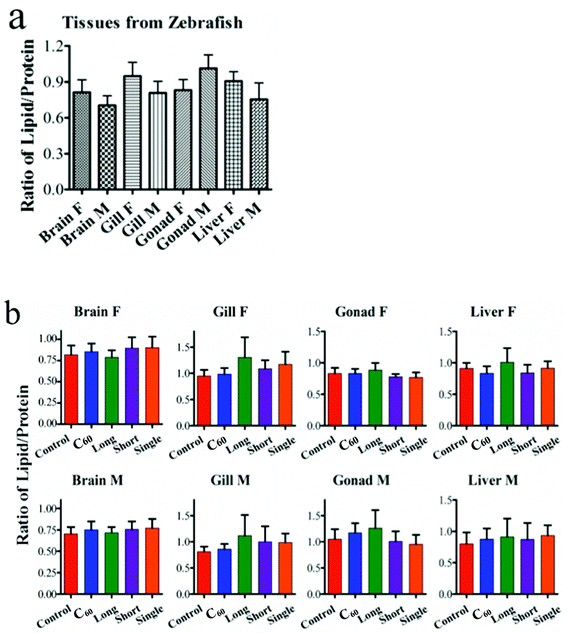
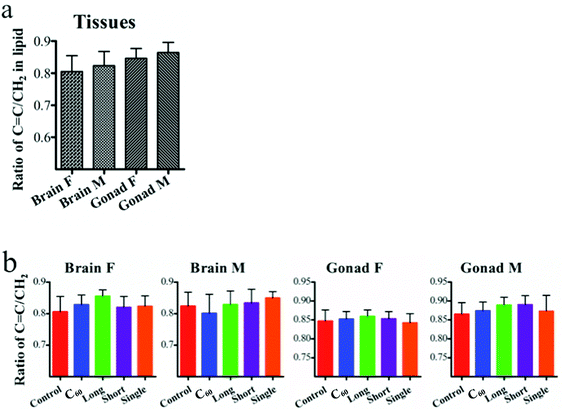
IR spectra allow an estimation of the lipid-to-protein ratio in tissues. This showed that female fish display a higher lipid-to-protein ratio, except in the gonads. Among all tissue types, male gonads exhibited the highest lipid-to-protein ratio (Fig. 5). Additionally, the unsaturated levels of lipid in brain and gonads were assessed by calculating the ratio of (C![[double bond, length as m-dash]](https://www.rsc.org/images/entities/char_e001.gif) C)/(CH2) in Raman spectra. It showed that there was a higher unsaturated lipid level in male fish than females (Fig. 6).
C)/(CH2) in Raman spectra. It showed that there was a higher unsaturated lipid level in male fish than females (Fig. 6).
As the initial site of uptake and elimination of contamination, the gills would be expected to directly interact with CNPs. Therefore, CNPs would exert effects by direct physical injury and indirectly by generating reactive oxidative species (ROS) and free radicals,36 resulting in gill inflammation.37,38 Exposure to CNPs induced significant alterations in Amide I, Amide II, lipid and protein in both female and male fish. Additionally, slight alterations in DNA/RNA region (νasPO2−, ∼1225 cm−1; νsPO2−, ∼1080 cm−1) were observed as well. The lipid-to-protein ratio was most highly elevated in gills exposed to long MWCNTs. Short MWCNTs and SWCNTs seemed to elicit a lower lipid-to-protein ratio in gills, while C60 showed no significant effect (P > 0.05). This suggests that the size of the CNPs plays a major role in inducing inflammation in the gill, with larger sizes causing higher levels of damage.39 Though it was reported that CNPs would be precipitated on gill mucus,40 CNPs could still penetrate the gill and be transported into the fish circulation. Even if tight junctions between gill cells dramatically reduce the permeability to CNPs, inflammation factors at the site could still facilitate their transported into the circulation to exert further effects on other organs.
Post-exposure to CNPs, the brain also showed significant alterations. Both IR and Raman spectra showed that long MWCNTs caused the most pronounced alterations in brain for both genders. In contrast, there appeared to be no significant effect of long MWCNTs on the lipid-to-protein ratio compared with control, while C60 induced a significant elevation of lipid-to-protein ratio, as well as short MWCNTs and single-walled CNTs. Because of their larger size, it may be difficult for long MWCNTs to penetrate through the tight junctions between the gill cells, which could also limit their ability to cross the blood–brain barrier (BBB).41 However, with high levels of oxidative stress and even inflammation factors induced by long MWCNTs, they still dramatically altered brain spectral signatures. Raman spectra showed that male fish display higher lipid unsaturated levels than females, which could contribute to the fluidity of the cell membrane. Interestingly, C60 caused contrasting effects on unsaturated lipid levels of brain in both genders. In female fish, the unsaturated lipid level was increased, while it was decreased in males, both significantly. As the brain in male fish has a lower lipid-to-protein ratio but higher unsaturated levels compared with that to female fish, it means that the male brain contains less lipid, but possibly greater fluidity due to an elevated content of unsaturated lipid.42 Thus, it is more likely that the highly lipophilic C60 will penetrate further into the lipid region,43 and exert oxidative damage not only to lipid, but also to further biochemical constituents such as protein and DNA/RNA. However, the three CNTs resulted in a significant increase of unsaturated lipid levels in the female brain, while only SWCNTs caused a significant elevation in males. Due to the lower lipid-to-protein ratio in male brain compared to female, possibly implicating that the male has a thinner layer of lipid, CNPs may exert a wider range of effects in cells. This was exhibited by the IR spectra indicating a trend for CNPs to induce more effects on the DNA/RNA spectral region derived from male brain compared to female. Profiled by both the IR and Raman spectra, all CNPs widely and highly induced alterations in the protein and lipid spectral region. Complimentary to IR, Raman spectra also indicated that CNPs caused significant effects in the spectral range associated with S–S (∼524 cm−1), C–S (∼662 cm−1) in protein and C![[double bond, length as m-dash]](https://www.rsc.org/images/entities/char_e001.gif) C in lipid (∼1655 cm−1). It is accepted that ROS generation is a key pathway in nanoparticle toxicity. High ROS levels could increase the depletion of thiol groups in proteins, especially glutathione (GSH), and increase the oxidized forms such as GSSG.44,45
C in lipid (∼1655 cm−1). It is accepted that ROS generation is a key pathway in nanoparticle toxicity. High ROS levels could increase the depletion of thiol groups in proteins, especially glutathione (GSH), and increase the oxidized forms such as GSSG.44,45
The interference of CNPs in brain could perturb the hypothalamic-pituitary-gonadal axis and affect the gonads further, in addition to direct effects on these tissues. It is evidenced by IR spectra that CNP exposures resulted in significant alterations in lipids, proteins and DNA/RNA. Raman spectra also confirmed this and showed that CNPs could induce alterations associated with C–S (∼662 cm−1) in female fish rather than in males. With both higher lipid-to-protein ratios and higher unsaturated lipid levels, male fish are more likely to protect protein from CNP-induced oxidative stress through the antioxidant function at the lipid region. These gonadal alterations would possibly further affect reproductive activity.
As an important organ for active metabolism and detoxification, the liver seems quite sensitive to CNP exposure. IR spectra show that the most pronounced alterations induced by C60 were associated with DNA/RNA region (vsPO2−, ∼1080 cm−1) in both genders, followed by alterations located in the protein and lipid spectral regions. Limited effects in DNA/RNA caused from short MWCNTs and SWCNTs were observed as well. In contrast, long MWCNTs seemed to have a weak capability to affect the liver in the DNA/RNA region, but caused significant alterations in lipids and proteins. The lipid-to-protein ratio in liver was significantly elevated by long MWCNTs in both genders. C60 and short MWCNTs reduced the lipid-to-protein ratio in female fish, in the absence of significant effects in males, while SWCNTs only elevated that ratio in males. The change in lipid-to-protein ratio in liver could be caused from the direct interference of CNPs, while the lipid accumulation was possibly due to CNP-induced inflammatory stress; long MWCNTs especially appear to disrupt cholesterol trafficking in liver tissue.46
4. Conclusion
Herein, biospectroscopy is presented as a global approach to nanotoxicity assessment, providing one with a profile of CNP-induced alterations. IR and Raman spectra show that CNPs can induce significant alterations in fish, and also highlights the differing effects of four CNPs. Although it could not be shown that the CNPs passed through the bio-barrier (e.g., BBB) and moved to further tissues in fish, such as brain and gonads, the fact that these organs were affected is a key indicator from the perspective of biological effects. Possibly the alterations observed in the brain and gonads demonstrate that CNPs do exert potential toxic effects on both nervous and reproductive systems.47–50 In addition, the alterations in DNA/RNA spectral regions caused by CNPs, especially by C60, suggested that DNA methylation could be perturbed following the CNP exposure. It is necessary to conduct further investigations to assess the DNA methylation levels in tissues of exposed fish. These effects may be extrapolated to other organisms.51 Furthermore, future studies need to examine whether the effects of CNPs impact on reproductive activity and test if transgenerational effects might arise.Acknowledgements
We would like to thank Yanqiu Liang, Yuxia Jiang and Dr Guoyong Huang for their kind assistance in setting up experiments. Funding for the laboratory experiments in this study from the Chinese Academy of Sciences is greatly acknowledged.References
- A. W. Jensen, S. R. Wilson and D. I. Schuster, Bioorg. Med. Chem., 1996, 4, 767–779 CrossRef CAS.
- R. Bakry, R. M. Vallant, M. Najam-ul-Haq, M. Rainer, Z. Szabo, C. W. Huck and G. K. Bonn, Int. J. Nanomed., 2007, 2, 639 CAS.
- R. H. Baughman, A. A. Zakhidov and W. A. de Heer, Science, 2002, 297, 787–792 CrossRef CAS PubMed.
- J. M. Planeix, N. Coustel, B. Coq, V. Brotons, P. S. Kumbhar, R. Dutartre, P. Geneste, P. Bernier and P. M. Ajayan, J. Am. Chem. Soc., 1994, 116, 7935–7936 CrossRef CAS.
- A. Bianco, K. Kostarelos and M. Prato, Curr. Opin. Chem. Biol., 2005, 9, 674–679 CrossRef CAS PubMed.
- A. Nel, T. Xia, L. Mädler and N. Li, Science, 2006, 311, 622–627 CrossRef CAS PubMed.
- H. Meng, T. Xia, S. George and A. E. Nel, ACS Nano, 2009, 3, 1620–1627 CrossRef CAS PubMed.
- G. Jia, H. Wang, L. Yan, X. Wang, R. Pei, T. Yan, Y. Zhao and X. Guo, Environ. Sci. Technol., 2005, 39, 1378–1383 CrossRef CAS.
- S. K. Manna, S. Sarkar, J. Barr, K. Wise, E. V. Barrera, O. Jejelowo, A. C. Rice-Ficht and G. T. Ramesh, Nano Lett., 2005, 5, 1676–1684 CrossRef CAS PubMed.
- J. Chłopek, B. Czajkowska, B. Szaraniec, E. Frackowiak, K. Szostak and F. Béguin, Carbon, 2006, 44, 1106–1111 CrossRef PubMed.
- M. Bottini, S. Bruckner, K. Nika, N. Bottini, S. Bellucci, A. Magrini, A. Bergamaschi and T. Mustelin, Toxicol. Lett., 2006, 160, 121–126 CrossRef CAS PubMed.
- A. Simon-Deckers, S. Loo, M. Mayne-L'hermite, N. Herlin-Boime, N. Menguy, C. Reynaud, B. Gouget and M. Carrière, Environ. Sci. Technol., 2009, 43, 8423–8429 CrossRef CAS PubMed.
- Z. Tong, M. Bischoff, L. Nies, B. Applegate and R. F. Turco, Environ. Sci. Technol., 2007, 41, 2985–2991 CrossRef CAS.
- E. Navarro, A. Baun, R. Behra, N. Hartmann, J. Filser, A.-J. Miao, A. Quigg, P. Santschi and L. Sigg, Ecotoxicology, 2008, 17, 372–386 CrossRef CAS PubMed.
- S. B. Lovern and R. Klaper, Environ. Toxicol. Chem., 2006, 25, 1132–1137 CrossRef CAS.
- S. Zhu, E. Oberdörster and M. L. Haasch, Mar. Environ. Res., 2006, 62(Supplement 1), S5–S9 CrossRef CAS PubMed.
- J. K. Folkmann, L. Risom, N. R. Jacobsen, H. Wallin, S. Loft and P. Møller, Environ. Health Perspect., 2009, 117, 703–708 CrossRef CAS PubMed.
- A. Kroll, M. H. Pillukat, D. Hahn and J. Schnekenburger, Eur. J. Pharm. Biopharm., 2009, 72, 370–377 CrossRef CAS PubMed.
- D. I. Ellis and R. Goodacre, Analyst, 2006, 131, 875–885 RSC.
- V. Llabjani, J. Trevisan, K. C. Jones, R. F. Shore and F. L. Martin, Environ. Sci. Technol., 2010, 44, 3992–3998 CrossRef CAS PubMed.
- V. Llabjani, J. D. Crosse, A. A. Ahmadzai, I. I. Patel, W. Pang, J. Trevisan, K. C. Jones, R. F. Shore and F. L. Martin, Environ. Sci. Technol., 2011, 45, 10706–10712 CrossRef CAS PubMed.
- J. G. Kelly, J. l. Trevisan, A. D. Scott, P. L. Carmichael, H. M. Pollock, P. L. Martin-Hirsch and F. L. Martin, J. Proteome Res., 2011, 10, 1437–1448 CrossRef CAS PubMed.
- P. Knief, C. Clarke, E. Herzog, M. Davoren, F. M. Lyng, A. D. Meade and H. J. Byrne, Analyst, 2009, 134, 1182–1191 RSC.
- J. Dorney, F. Bonnier, A. Garcia, A. Casey, G. Chambers and H. J. Byrne, Analyst, 2012, 137, 1111–1119 RSC.
- J. Trevisan, P. P. Angelov, P. L. Carmichael, A. D. Scott and F. L. Martin, Analyst, 2012, 137, 3202–3215 RSC.
- J. Li, R. Strong, J. Trevisan, S. W. Fogarty, N. J. Fullwood, K. C. Jones and F. L. Martin, Environ. Sci. Technol., 2013, 47, 10005–10011 CrossRef CAS PubMed.
- M. J. Riding, F. L. Martin, J. Trevisan, V. Llabjani, I. I. Patel, K. C. Jones and K. T. Semple, Environ. Pollut., 2012, 163, 226–234 CrossRef CAS PubMed.
- M. N. Moore, Environ. Int., 2006, 32, 967–976 CrossRef CAS PubMed.
- T. W. K. Fraser, H. C. Reinardy, B. J. Shaw, T. B. Henry and R. D. Handy, Nanotoxicology, 2011, 5, 98–108 CrossRef CAS PubMed.
- J. Cheng, C. M. Chan, L. M. Veca, W. L. Poon, P. K. Chan, L. Qu, Y.-P. Sun and S. H. Cheng, Toxicol. Appl. Pharmacol., 2009, 235, 216–225 CrossRef CAS PubMed.
- S. A. Brittijn, S. J. Duivesteijn, M. Belmamoune, L. F. M. Bertens, W. Bitter, J. D. de Bruijn, D. L. Champagne, E. Cuppen, G. Flik, C. M. Vandenbroucke-Grauls, R. A. J. Janssen, I. M. L. de Jong, E. R. de Kloet, A. Kros, A. H. Meijer, J. R. Metz, A. M. van der Sar, M. J. M. Schaaf, S. Schulte-Merker, H. P. Spaink, P. P. Tak, F. J. Verbeek, M. J. Vervoordeldonk, F. J. Vonk, F. Witte, H. Yuan and M. K. Richardson, Int. J. Dev. Biol., 2009, 53, 835–850 CrossRef CAS PubMed.
- H. Segner, Comp. Biochem. Physiol., Part C: Toxicol. Pharmacol., 2009, 149, 187–195 CrossRef PubMed.
- J. Trevisan, P. P. Angelov, A. D. Scott, P. L. Carmichael and F. L. Martin, Bioinformatics, 2013, 29, 1095–1097 CrossRef CAS PubMed.
- H. Wu, J. V. Volponi, A. E. Oliver, A. N. Parikh, B. A. Simmons and S. Singh, Proc. Natl. Acad. Sci. U. S. A., 2011, 108, 3809–3814 CrossRef CAS PubMed.
- A. R. R. Péry, J. Devillers, C. Brochot, E. Mombelli, O. Palluel, B. Piccini, F. Brion and R. Beaudouin, Environ. Sci. Technol., 2013, 48, 781–790 CrossRef PubMed.
- T. B. Henry, E. J. Petersen and R. N. Compton, Curr. Opin. Biotechnol., 2011, 22, 533–537 CrossRef CAS PubMed.
- N. Lewinski, V. Colvin and R. Drezek, Small, 2008, 4, 26–49 CrossRef CAS PubMed.
- D. Crouzier, S. Follot, E. Gentilhomme, E. Flahaut, R. Arnaud, V. Dabouis, C. Castellarin and J. C. Debouzy, Toxicology, 2010, 272, 39–45 CrossRef CAS PubMed.
- Y. Sato, A. Yokoyama, K.-i. Shibata, Y. Akimoto, S.-i. Ogino, Y. Nodasaka, T. Kohgo, K. Tamura, T. Akasaka, M. Uo, K. Motomiya, B. Jeyadevan, M. Ishiguro, R. Hatakeyama, F. Watari and K. Tohji, Mol. BioSyst., 2005, 1, 176–182 RSC.
- C. J. Smith, B. J. Shaw and R. D. Handy, Aquat. Toxicol., 2007, 82, 94–109 CrossRef CAS PubMed.
- A. Pietroiusti, L. Campagnolo and B. Fadeel, Small, 2013, 9, 1557–1572 CrossRef CAS PubMed.
- C. Chatgilialoglu, C. Ferreri, M. Melchiorre, A. Sansone and A. Torreggiani, Chem. Rev., 2013, 114, 255–284 CrossRef PubMed.
- E. Oberdörster, Environ. Health Perspect., 2004, 112, 1058–1062 CrossRef.
- M. L. Circu and T. Y. Aw, Free Radical Biol. Med., 2010, 48, 749–762 CrossRef CAS PubMed.
- O. Zitka, S. Skalickova, J. Gumulec, M. Masarik, V. Adam, J. Hubalek, L. Trnkova, J. Kruseova, T. Eckschlager and R. Kizek, Oncol. Lett., 2012, 4, 1247–1253 CAS.
- K. L. Ma, X. Z. Ruan, S. H. Powis, Y. Chen, J. F. Moorhead and Z. Varghese, Hepatology, 2008, 48, 770–781 CrossRef CAS PubMed.
- G. Bardi, A. Nunes, L. Gherardini, K. Bates, K. T. Al-Jamal, C. Gaillard, M. Prato, A. Bianco, T. Pizzorusso and K. Kostarelos, PLoS One, 2013, 8, e80964 Search PubMed.
- M. Ema, N. Kobayashi, M. Naya, S. Hanai and J. Nakanishi, Reprod. Toxicol., 2010, 30, 343–352 CrossRef CAS PubMed.
- Y. Bai, Y. Zhang, J. Zhang, Q. Mu, W. Zhang, E. R. Butch, S. E. Snyder and B. Yan, Nat. Nanotechnol., 2010, 5, 683–689 CrossRef CAS PubMed.
- T.-T. Win-Shwe and H. Fujimaki, Int. J. Mol. Sci., 2011, 12, 6267–6280 CrossRef CAS PubMed.
- S. Rhiem, M. J. Riding, W. Baumgartner, F. L. Martin, K. T. Semple, K. C. Jones, A. Schäffer and H. M. Maes, Environ. Pollut., 2014, 196C, 431–439 Search PubMed.
Footnote |
| † Electronic supplementary information (ESI) available. See DOI: 10.1039/c4an02227k |
| This journal is © The Royal Society of Chemistry 2015 |

