 Open Access Article
Creative Commons Attribution 3.0 Unported Licence
A high-rate aqueous symmetric pseudocapacitor based on highly graphitized onion-like carbon/birnessite-type manganese oxide nanohybrids†
Katlego
Makgopa
a,
Paul M.
Ejikeme
a,
Charl J.
Jafta
b,
Kumar
Raju
b,
Marco
Zeiger
cd,
Volker
Presser
*cd and
Kenneth I.
Ozoemena
*ab
aDepartment of Chemistry, University of Pretoria, Pretoria 0002, South Africa. E-mail: kozoemena@csir.co.za; Fax: +27-128412135; Tel: +27-128413664
bEnergy Materials, Materials Science and Manufacturing, Council for Scientific & Industrial Research (CSIR), Pretoria 0001, South Africa
cINM-Leibniz Institute for New Materials, 66123 Saarbrücken, Germany. E-mail: volker.presser@inm-gmbh.de; Fax: +49-6819300223; Tel: +49-6819300177
dSaarland University, 66123 Saarbrücken, Germany
First published on 15th December 2014
Abstract
We present a study on the pseudocapacitive properties of birnessite-type MnO2 grafted on highly graphitized onion-like carbon (OLC/MnO2). In a three-electrode setup, we evaluated two different substrates, namely a platinum disc and nickel foam. The OLC/MnO2 nanohybrid exhibited a large specific capacitance (Csp) of 295 and 323 F g−1 (at 1 A g−1) for the Pt disc and Ni foam, respectively. In addition, the Ni foam substrate exhibited much higher rate capability (power density) than the Pt disc. A symmetrical two-electrode device, fabricated with the Ni foam, showed a large Csp of 254 F g−1, a specific energy density of 5.6 W h kg−1, and a high power density of 74.8 kW kg−1. These values have been the highest for onion-based electrodes so far. The device showed excellent capacity retention when subjected to voltage-holding (floating) experiments for 50 h. In addition, the device showed a very short time constant (τ = 40 ms). This high rate handling ability of the OLC/MnO2 nanohybrid, compared to literature reports, promises new opportunities for the development of aqueous-based pseudocapacitors.
Introduction
Supercapacitors are advanced systems for electrochemical energy storage.1,2 Two different types of supercapacitors can be differentiated: (a) electrical double-layer capacitors (EDLCs) that only rely on charge storage via ion electrosorption in an electrical double-layer, and (b) pseudocapacitors that utilize fast (surface) redox reactions.3–6 Over the last years, supercapacitors have attracted tremendous attention due to their excellent properties such as high power density, long cycle ability, high efficiency, and relying on abundantly available carbon materials.7,8 Considering energy and power performance, supercapacitors play a key role as intermediates between batteries and electrolytic capacitors9 and find widespread applications for fast charge–discharge and uninterrupted power supply applications as well as in combination with batteries in hybrid systems.10 There have been extensive studies of varieties of carbon materials for supercapacitor electrodes because of their large specific surface area (SSA), high conductivity, facile availability, and chemical stability.5,11 Some of the best performing carbon materials include activated carbon,12 carbon nanotubes (CNTs),13 graphene,14,15 carbon nanofibers (CNFs),16,17 and carbon aerogels.18Among carbon nanomaterials, non-porous carbon onions, also known as onion-like carbon (OLC), have attracted major research interest as electrode materials for energy storage, for example, advanced anode electrodes for lithium ion batteries,19,20 pseudocapacitors,21,22 and ultrahigh-power electrical double-layer capacitors.23–25 The major attractions stem from the ability to prepare them on a large scale by thermal annealing of nanodiamonds and the superior power handling ability.26 OLCs are described as multi-shell fullerenes27 that, unlike fullerenes, exhibit a high electrical conductivity commonly in the range of 2–4 S cm−1.25 However, the limited surface area of OLCs (200–600 m2 g−1) has also resulted in limited double-layer capacitance (usually between 25 and 50 F g−1, equivalent up to 2 W h kg−1 at 1 V).25,26
OLCs derived from thermal treatment of nanodiamonds (NDs)28 are highly graphitic spherical particles (5–10 nm) that consist of several concentric carbon shells.29 Alternative synthesis methods may also yield larger OLCs with diameters of more than 10 nm (ref. 19 and 30) and include condensation of carbon vapor31 or electron beam irradiation.32 However, thermal annealing of NDs33 at temperatures between 1000 and 2000 °C is currently the preferred technique to synthesize OLCs since large amounts of material can be obtained per run.34 Also, a narrow size distribution of the ND precursor translates into a narrow size distribution of the resulting onion-like carbons.21
Birnessite-type MnO2 (in this paper referred to as just “MnO2”) exhibits a two-dimensional layered structure (see ESI, Fig. S1†) displaying edge-sharing MnO6 octahedra in the sheets and metal cations (for example K+) and water molecules in the interlayer region. Hence, an appropriate chemical representation would be KxMn2O4·yH2O (with x ≤ 0.5 and y ≤ 1.5).35 This metal oxide has become an attractive electrode material for efficient and low-cost development of supercapacitors due to its natural abundance and environmental compatibility.36–42 However, because of its low electrical conductivity (10−6 to 10−5 S cm−1) and poor power handling capability, the electrochemical performance of MnO2 electrodes is rather low, which significantly limits its potential applications as high-power supercapacitor electrodes.43 The capacitive performance, redox activity, as well as utilization of MnO2 can be enhanced by the addition of conductive materials.44–46 However, the resulting performance strongly depends on the quality and properties of such carbon/metal oxide hybrid materials.
This work, for the first time, reports the electrochemistry of MnO2 integrated with highly graphitized OLCs derived from NDs (herein abbreviated simply as OLC/MnO2 nanohybrid) as a high-power pseudocapacitor in a neutral aqueous medium (1 M Na2SO4). Previous studies related to MnO2 with “carbon onions” were carried out using low-graphitized materials obtained from either clarified butter (“Ghee”)30 or phenolic-formaldehyde resins with much larger particle diameters (tens of nm).42 Whilst these initial reports are encouraging, we show in this study that by using highly graphitized OLCs, OLC/MnO2 nanohybrids exhibit a very high power density (∼75 kW kg−1). In addition, our devices show excellent capacitance retention upon long-hour voltage-holding and very low equivalent distribution resistance (EDR ≈ 3 Ω cm2) with a response time of just a few milliseconds.
Experimental section
Precursor and synthesis of OLC and OLC/MnO2
OLC was synthesized from nanodiamond (ND) powder with a purity of 98–99% (NaBond Technologies) and thoroughly characterized as recently described.47 Briefly, ND powder was placed in a closed-lid cylindrical graphite crucible (30 mm in diameter and 20 mm in height) and thermally annealed in a water-cooled high temperature vacuum furnace with tungsten heaters (Model: 1100-3580-W1, Thermal Technology Inc.). The heating and cooling rates were both 15 °C min−1 and the chamber pressure ranged between 10 and 100 mPa. The final OLC was annealed at 1750 °C for 3 h. The OLC/MnO2 nanohybrid material was prepared using the conventional hydrothermal reduction technique. Typically, 40 mg of OLC was dispersed by sonication in 30 mL of 0.02 M KMnO4 (Merck), and the mixture (pH = 7.05) was refluxed at 130 °C in an oil bath for 24 h with continuous magnetic stirring. The resultant dispersion was then centrifuged and washed several times with deionized water, and finally dried at 60 °C overnight in a vacuum oven. All chemicals were of analytical grade and used as received. Deionized water was used throughout the synthesis process.Structural characterization
Surface morphology characterization of the samples was obtained using a JSM-7500F (JEOL, Japan) scanning electron microscope (SEM) operated at 3.0 kV. Energy dispersive X-ray spectra (EDX) were recorded with an EDX system (Oxford Instruments) at 5 different positions. The chemical composition was calculated using the AZtec energy analysis software (Oxford Instruments). Transmission electron microscopy (TEM) samples were prepared by dispersing powders in ethanol and placing the dispersion over a copper grid with a lacey carbon film. All measurements were carried out with a 2100F microscope (JEOL) operating at 200 kV. X-ray diffraction (XRD) patterns of the samples were collected using an X'Pert-Pro MPD diffractometer (PANalytical) with theta/theta geometry (step width: 0.0263° s−1), operating a copper tube at 40 kV and 40 mA. The instrumental resolution function was characterized with the NIST SRM 660a (LaB6) standard. The patterns were recorded in the range of 5–148° 2θ. Qualitative phase analysis of the samples was conducted using Bruker EVA software using the PDF database.Raman spectra were recorded with a Renishaw inVia Raman microscope using a Nd-YAG laser with an excitation wavelength of 532 nm and a grating with 1800 lines mm−1 yielding a spectral resolution of ca. 1.2 cm−1. The spot size on the sample was in the focal plane ca. 2 μm using an output power of 0.5 mW. Spectra were recorded for 30 s and accumulated 50 times to eliminate cosmic rays and to obtain a high signal-to-noise and signal-to-background ratio. Peak fitting was achieved by employing Lorentzian peaks assuming four components for the carbon spectrum between 1000 and 1800 cm−1. Fourier infrared spectroscopy (FTIR) analyses were carried out using a Perkin Elmer FT-IR spectrophotometer. OLC and OLC/MnO2 nanohybrids were analyzed as KBr pellets (10 scans).
X-ray photoelectron spectroscopy (XPS) experiments were carried out on a Kratos Axis Ultra-DLD system (Shimadzu) with monochromated Al Kα radiation (1486.6 eV). Binding energies were calibrated using the containment carbon (C 1s at 284.6 eV). The spectra analysis was performed with the XPS Peak 4.1 program and a Shirley function was used to subtract the background. The metal oxide content in the nanohybrid was determined by thermogravimetric analysis (TGA) using an STA Jupiter 449 C (Netzsch) in an Ar/O2 atmosphere at a temperature scan rate of 10 K min−1.
Nitrogen gas sorption measurements were made with a Quantachrome Autosorb iQ system. The samples were outgassed at 150 °C for 10 h under vacuum conditions. Gas sorption was performed in liquid nitrogen (−196 °C) with a relative pressure range of 10−7 to 0.95 in 68 steps. The specific surface area (SSA) was calculated with the ASQwin-software using the Brunauer–Emmett–Teller (BET) equation48 in the relative pressure range of 0.01–0.2. We also calculated the SSA and pore size distribution (PSD) via quenched-solid density functional theory (QSDFT)49 with a hybrid model for slit and cylindrical pores and pore size between 0.56 and 37.5 nm.
Electrochemical characterization
All electrochemical measurements were carried out using a Bio-Logic VMP 300 potentiostat/galvanostat using either a three-electrode (half-cell) or a two-electrode (full cell) configuration. For the three-electrode configuration a Pt disc and nickel foam were used as substrates for the working electrodes. For the three-electrode configuration using a Pt disc, a custom-built three-electrode cell (cf.ref. 47) was used. The working electrode was prepared by drop-casting 7.1 mg mL−1 OLC colloidal dispersion (10 mass% polyvinylidenfluoride, PVDF in ethanol) or 9.0 mg mL−1 OLC/MnO2 nanohybrid colloidal dispersion (in anhydrous N-methyl-2-pyrrolidone, NMP) onto a Pt disc (diameter: 12 mm, thickness: 100 μm, purity 99.99%, Carl Schaefer) and dried at 80 °C overnight in a vacuum oven at 20 mbar to remove the solvent. Polytetrafluoroethylene (PTFE) bound (5% in total electrode mass) activated carbon (YP50F, Kuraray Chemical) served as a counter electrode and was largely oversized in charge capacity as compared to the working electrode. A platinum wire (diameter 1 mm, purity 99.99%, Carl Schaefer) served as a pseudo-reference electrode. For the nickel foam based three-electrode configuration, the nickel foam (Celmet: thickness = 1.6 mm, surface area = 7500 m2 m−3, cell size = 0.5 mm, 48–52 cells per inch) was cleaned prior to use, in a 1 M HCl solution, washed with a copious amount of de-ionized water to a neutral pH, and dried under vacuum. It was pasted with a mixture of OLC/MnO2 nanohybrid, carbon black (CB, Degussa), and polyvinylidene fluoride (PVDF) (mass% of 80![[thin space (1/6-em)]](https://www.rsc.org/images/entities/char_2009.gif) :
:![[thin space (1/6-em)]](https://www.rsc.org/images/entities/char_2009.gif) 15
15![[thin space (1/6-em)]](https://www.rsc.org/images/entities/char_2009.gif) :
:![[thin space (1/6-em)]](https://www.rsc.org/images/entities/char_2009.gif) 5 respectively, homogeneously mixed with a few drops of anhydrous N-methyl-2-pyrrolidone using a paste pestle and mortar). The CB and PVDF served as a conductive additive and a binder, respectively. The electrode was then dried at 80 °C overnight in a vacuum oven, and pressed to a thickness of 250 μm. The electrode was cut into a piece of 1 cm × 1 cm, while the mass loading was typically 1 mg cm−2 for the Pt disc and nickel foam. An oversized glassy carbon plate (1.6 × 1.6 cm2) was used as the counter electrode and Ag/AgCl (3 M KCl) as the reference electrode. The two-electrode configuration used the nickel foam as substrate. Both the positive and negative electrodes used nickel foam coated with the OLC/MnO2 nanohybrid, obtained as described for the three-electrode above. The resulting slurry was coated onto the nickel foam substrate (∼3 cm2) with a spatula using an average mass loading of 1 mg cm−2. Symmetric cells were also prepared using nickel foam loaded with only OLC. In all experiments, 1 M Na2SO4 was used as the electrolyte and a porous glass fiber (Whatman Grade GF/D Glass Microfiber Filters, Sigma-Aldrich) served as the separator. For the three-electrode configuration, cyclic voltammetry was performed at various scan rates (2–100 mV s−1). Voltage-holding (floating) experiments were performed for 10 h at 0.8 V, then galvanostatically charged–discharged between 0.0 and 0.8 V at 1 A g−1, repeating the process five times (i.e., a total of 50 h). Electrochemical impedance spectroscopy (EIS) data were obtained between 100 kHz and 10 mHz with a perturbation amplitude (rms value) of the AC signal of 2 mV. Every EIS experiment was performed after allowing the cell to equilibrate for 5 min at the chosen fixed potential.
5 respectively, homogeneously mixed with a few drops of anhydrous N-methyl-2-pyrrolidone using a paste pestle and mortar). The CB and PVDF served as a conductive additive and a binder, respectively. The electrode was then dried at 80 °C overnight in a vacuum oven, and pressed to a thickness of 250 μm. The electrode was cut into a piece of 1 cm × 1 cm, while the mass loading was typically 1 mg cm−2 for the Pt disc and nickel foam. An oversized glassy carbon plate (1.6 × 1.6 cm2) was used as the counter electrode and Ag/AgCl (3 M KCl) as the reference electrode. The two-electrode configuration used the nickel foam as substrate. Both the positive and negative electrodes used nickel foam coated with the OLC/MnO2 nanohybrid, obtained as described for the three-electrode above. The resulting slurry was coated onto the nickel foam substrate (∼3 cm2) with a spatula using an average mass loading of 1 mg cm−2. Symmetric cells were also prepared using nickel foam loaded with only OLC. In all experiments, 1 M Na2SO4 was used as the electrolyte and a porous glass fiber (Whatman Grade GF/D Glass Microfiber Filters, Sigma-Aldrich) served as the separator. For the three-electrode configuration, cyclic voltammetry was performed at various scan rates (2–100 mV s−1). Voltage-holding (floating) experiments were performed for 10 h at 0.8 V, then galvanostatically charged–discharged between 0.0 and 0.8 V at 1 A g−1, repeating the process five times (i.e., a total of 50 h). Electrochemical impedance spectroscopy (EIS) data were obtained between 100 kHz and 10 mHz with a perturbation amplitude (rms value) of the AC signal of 2 mV. Every EIS experiment was performed after allowing the cell to equilibrate for 5 min at the chosen fixed potential.
The specific capacitance (Csp) of the half-cells, obtained from CV and galvanostatic discharge curves, was evaluated using the established equations (1) and (2), respectively.
 | (1) |
 | (2) |
The specific capacitance (Csp), maximum specific power density (Pmax) and specific energy density (Esp) for the full cells (symmetric devices) were evaluated from the slope of the charge–discharge curves using eqn (3)–(6).1
 | (3) |
 | (4) |
 | (5) |
 | (6) |
Results and discussion
SEM, TEM, and gas sorption analysis
The surface morphologies of OLC and the OLC/MnO2 nanohybrid studied using SEM are shown in Fig. 1a and c and using TEM in Fig. 1b and d. The primary particle size of carbon onions is in the range of a few nanometers as seen from the TEM images in agreement with our previous findings.47 This primary particle size is maintained for the OLC/MnO2 nanohybrid. Compared with OLC, OLC/MnO2 hybrid nanoparticles exhibited an obviously different morphology. The selected area electron diffraction (SAED) pattern in the inset of Fig. 1d shows lattice fringes for crystalline MnO2 and circular lattice shells for OLC.30 Rather than a monolayer or multilayer coating of each carbon onion, an effective OLC/MnO2 nanohybrid was obtained with nanodomains of highly mixed graphitic carbon and metal oxide. The amount of metal oxide was determined by TGA to represent 47 mass% of the OLC/MnO2 nanohybrid material (see ESI, Fig. S2†). Also, the TGA data show the excellent thermal stability of OLC with an onset of oxidation at around 630 °C as a result of the highly graphitic character of carbon onions synthesized at 1750 °C.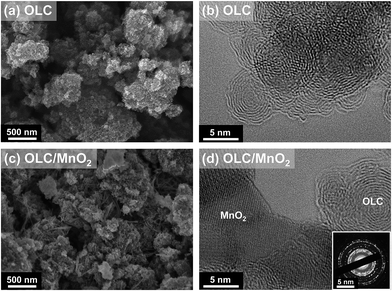 | ||
| Fig. 1 SEM images of (a) OLC and (c) the OLC/MnO2 nanohybrid; TEM images of (b) OLC and (d) the OLC/MnO2 nanohybrid. The inset is the corresponding SAED pattern of (d). | ||
Fig. 2 shows nitrogen gas sorption data for OLC and the OLC/MnO2 nanohybrid. As we see, OLC/MnO2 exhibits a QSDFT SSA of 122 m2 g−1 with a distribution of micropores (<2 nm) and mesopores (between 2 and 50 nm). This represents a severe loss in the specific surface area compared to OLC with a QSDFT SSA of 391 m2 g−1 and is mostly related to the higher molecular mass and higher density of MnO2 in addition to pore blocking.50 Yet, Fig. 2b shows that the overall pore size distribution is preserved after the addition of MnO2 at a lower total pore volume.
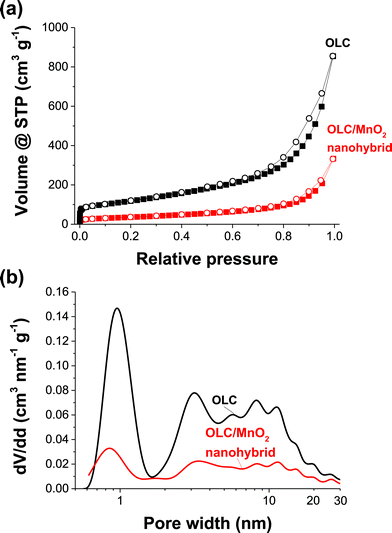 | ||
| Fig. 2 (a) Nitrogen adsorption–desorption isotherms at −196 °C and (b) QSDFT pore size distribution overlays of OLC and the OLC/MnO2 nanohybrid. | ||
XRD, Raman, FTIR, EDX, and XPS studies
Fig. 3 illustrates the Raman spectra, X-ray diffraction patterns, and FTIR spectra of OLC and the corresponding OLC/MnO2 nanohybrid material. The presence of MnO2 is confirmed by a strong Raman signal at around 565 cm−1,51 (Fig. 3a). The presence of the OLC in the hybrid from the XRD analysis is confirmed by Raman peaks associated with the carbon D-mode (1350 cm−1) and G-mode (1590 cm−1) of OLC/MnO2. Peak analysis (Fig. 3a) shows that the hydrothermal synthesis only insignificantly changes the OLC structure: both the D- and G-mode remain almost unchanged. In particular, the ID/IG ratios before and after MnO2 deposition are almost identical to the values of 1.20 and 1.25, respectively. The FWHM values for both the D-mode and the G-mode were measured to be 73.1 cm−1 and 69.8 cm−1 before the deposition and to be 78.5 cm−1 and 65.4 cm−1 after the MnO2 deposition. The only minor change related to the carbon signal is identified at around 1100 to 1200 cm−1 which may indicate the formation of a small amount of functionalized carbon.52 FTIR was used to study further the electrode materials as shown by Fig. 3c. The well pronounced peak at 550 cm−1 is due to the Mn–O–Mn asymmetric stretching vibration. The broad peak at 3450 cm−1 is assigned to hydroxyl groups which suggests that there are water molecules in the interlayers (see also the structure given in the ESI, Fig. S1†).53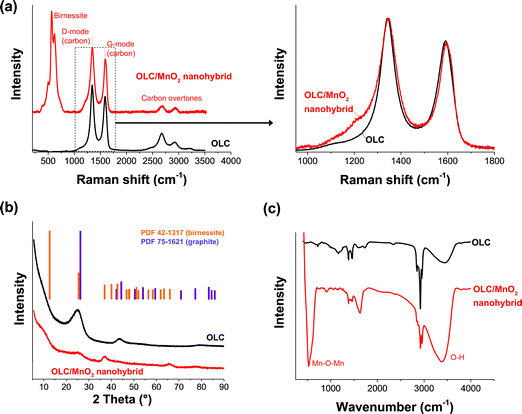 | ||
| Fig. 3 (a) Raman spectra, (b) X-ray diffraction pattern, and (c) FTIR spectra of OLC and the OLC/MnO2 nanohybrid. | ||
From the XRD patterns of the OLC/MnO2 nanohybrid (Fig. 3b), the peak at around 26° 2θ is associated with the (002) plane of graphitic carbon and it can be observed also in OLC/MnO2 diffractograms indicating the presence of carbon in the nanohybrid. The other peaks can be indexed to birnessite-type MnO2 (PDF 42-1317). All diffraction peaks of the metal oxide are broadened which indicates the nanocrystalline nature of the MnO2 with an average coherence length (domain size) in the range of 5–10 nm. The calculated carbon d-spacing for the (002) plane is 0.352 nm and remains at that value with or without the presence of MnO2. This represents a small increase in lattice spacing compared to an ideal graphite crystal (i.e., 0.344 nm) as is well-known for the carbon onion structure.52
Chemical analysis confirms the presence of birnessite, meaning, not of pure MnO2 but of a material following the average formula KxMn2O4·yH2O. Semi-quantitative analysis of OLC EDX spectra (Fig. 4a and Table 1) shows less than 0.2 mass% of impurities alongside ca. 9 mass% of surface oxygen. The metal oxide shows an average molar Mn![[thin space (1/6-em)]](https://www.rsc.org/images/entities/char_2009.gif) :
:![[thin space (1/6-em)]](https://www.rsc.org/images/entities/char_2009.gif) K ratio of 4.6
K ratio of 4.6![[thin space (1/6-em)]](https://www.rsc.org/images/entities/char_2009.gif) :
:![[thin space (1/6-em)]](https://www.rsc.org/images/entities/char_2009.gif) 1 which is somewhat larger than the maximum stoichiometric value of 4
1 which is somewhat larger than the maximum stoichiometric value of 4![[thin space (1/6-em)]](https://www.rsc.org/images/entities/char_2009.gif) :
:![[thin space (1/6-em)]](https://www.rsc.org/images/entities/char_2009.gif) 1. The small difference might indicate the presence of minor amounts of residual KMnO4. Yet, we note that the previously reported non-carbon content of around 47 mass% is in agreement with our EDX data (54.3 mass%). Only minor impurities of Si and Na can be detected which stem from impurities in the KMnO4. XPS analysis of OLC/MnO2 (Fig. 4b) shows the binding energy peaks of Mn and C. The Mn 2p region consisted of a spin–orbit doublet with Mn 2p1/2 and Mn 2p3/2 having binding energies of 654.2 eV and 642.3 eV, respectively.54 The energy separation between Mn 2p1/2 and Mn 2p3/2 of 11.9 eV is an indication of Mn in a +4 oxidation state.55–57 From the XPS survey scan, we also see the presence of significant amounts of K in addition to Mn, C, and O.
1. The small difference might indicate the presence of minor amounts of residual KMnO4. Yet, we note that the previously reported non-carbon content of around 47 mass% is in agreement with our EDX data (54.3 mass%). Only minor impurities of Si and Na can be detected which stem from impurities in the KMnO4. XPS analysis of OLC/MnO2 (Fig. 4b) shows the binding energy peaks of Mn and C. The Mn 2p region consisted of a spin–orbit doublet with Mn 2p1/2 and Mn 2p3/2 having binding energies of 654.2 eV and 642.3 eV, respectively.54 The energy separation between Mn 2p1/2 and Mn 2p3/2 of 11.9 eV is an indication of Mn in a +4 oxidation state.55–57 From the XPS survey scan, we also see the presence of significant amounts of K in addition to Mn, C, and O.
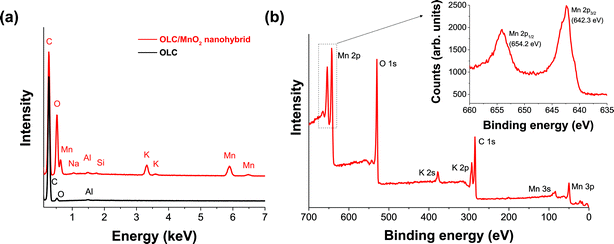 | ||
| Fig. 4 (a) Energy dispersive X-ray (EDX) spectra of OLC and the OLC/MnO2 nanohybrid and (b) X-ray photoelectron spectrum (XPS) of the OLC/MnO2 nanohybrid. | ||
| (Mass%) | C | O | Na | Al | Si | K | Mn |
|---|---|---|---|---|---|---|---|
| OLC | 90.8 ± 1.7 | 9.1 ± 1.7 | — | 0.2 ± 0.1 | — | — | — |
| OLC/MnO2 | 45.7 ± 1.4 | 20.3 ± 1.9 | 0.2 ± 0.1 | 0.3 ± 0.1 | 0.2 ± 0.1 | 4.5 ± 1.2 | 28.9 ± 2.6 |
| (Atom%) | C | O | Na | Al | Si | K | Mn |
|---|---|---|---|---|---|---|---|
| OLC | 93.0 ± 1.3 | 7.0 ± 1.3 | — | 0.1 ± 0.1 | — | — | — |
| OLC/MnO2 | 66.3 ± 1.5 | 22.1 ± 1.7 | 0.1 ± 0.1 | 0.2 ± 0.1 | 0.1 ± 0.1 | 2.0 ± 0.6 | 9.2 ± 1.0 |
Comparative performance of half-cells with Pt disc or Ni foam
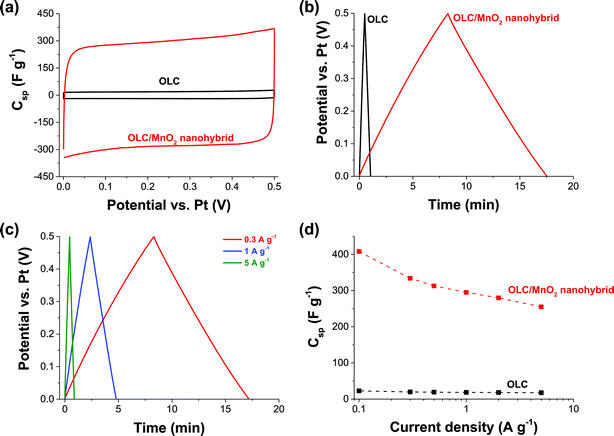
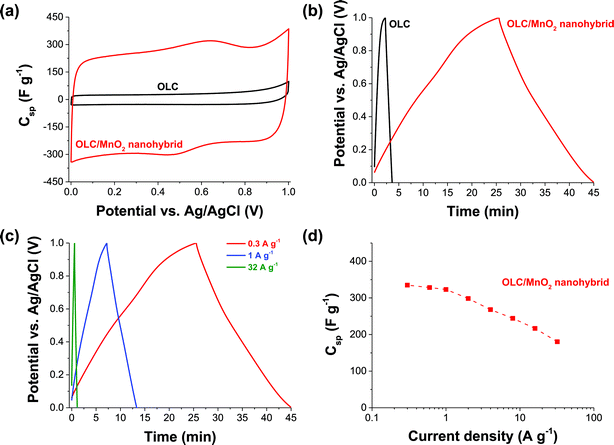
Fig. 5 and 6 compare the electrochemical performance of the three-electrode configurations using either a platinum disc (Fig. 5) or nickel foam (Fig. 6) as current collectors. The CV curves of OLC (Fig. 5a) are characteristic of double-layer capacitive materials, while the CV curve of the OLC/MnO2 nanohybrid shows redox-peaks indicative of faradaic reactions (Fig. 6a). The same conclusions can be drawn from the galvanostatic charge–discharge profiles (Fig. 5b and cvs.Fig. 6b and c).58,59 We also see a high power handling ability of the materials with a comparatively small drop in the specific capacitance of OLC/MnO2 (335–180 F g−1) as a function of the current density (0.3–32 A g−1), Fig. 6d.The key findings from Fig. 5 and 6 may be summarized as follows: (i) the specific capacitance of OLC/MnO2 is more than a magnitude higher than that of OLC for both current collectors (i.e., Ni foam and a Pt disc); (ii) both types of current collectors gave an essentially similar specific capacitance at different current densities (e.g., 250 F g−1 at 5 A g−1); and (iii) the stable voltage window for the Pt disc is narrower (0–0.5 V) than that of the nickel foam (0–1.0 V). The nickel foam alone only insignificantly contributes to the charge storage mechanism (see ESI, Fig. S3†). We also note that carbon onions alone, that is without the presence of MnO2, only exhibit a low specific capacitance of 12 F g−1.
As summarized in Table 2, the maximum Csp values for our 3-electrode tests (335–408 F g−1 between 0.1 and 0.3 A g−1) are much higher than those recorded in the literature. The impressive value (603 F g−1 at 10 A g−1) for electrodeposited MnO2-nanopillars reported by Yu et al.73 for their flexible nanostructured electrode obtained by combined sputter-coating and electrodeposition (PAN/Au–Pd/MnO2, i.e., comprised of a cocktail of polyacrylonitrile polymer and very expensive precious metals of palladium and gold) may, amongst other factors, be related to the thin film nature of their system and the mass of active materials used in their calculations. Our values are somewhat comparable to those of the recent work by Ruoff et al.39 involving the elaborate preparation of mesoporous nanotubes assembled from interwoven ultrathin birnessite-type MnO2 nanosheets. Note that our result is much higher than that of the “OLC”/MnO2 (∼190 F g−1 at 0.2 A g−1) reported by Wang et al.,42 and the disparity can be related to the high graphitization of our OLC.
| Samples | Electrolyte | C sp (F g−1) | i (A g−1) | References |
|---|---|---|---|---|
| Birnessite-type MnO2 | 1 M Na2SO4 | 335–408 | 0.1–0.3 | This work |
| Birnessite-like hollow MnO2 | 1 M Na2SO4 | 169 | 0.25 | 37 |
| Birnessite-type MnO2 nanosphere | 1 M Na2SO4 | 210 | 1 | 38 |
| Birnessite-type MnO2 nanotube | 1 M Na2SO4 | 365 | 0.25 | 39 |
| Birnessite-type MnO2 | 1 M Na2SO4 | 210 | 1 | 40 |
| Birnessite-type MnO2 nanosheet | 1 M Na2SO4 | 269 | 0.3 | 41 |
| Birnessite-type MnO2 | 1 M Na2SO4 | ∼190 | 0.2 | 42 |
| Coral-like MnO2 | 1 M Na2SO4 | 221 | 0.5 | 63 |
| α-MnO2 ultralong nanowire | 0.5 M Na2SO4 | 345 | 1 | 64 |
| α-MnO2 spherical-like particle | 1 M Na2SO4 | 259 | 0.1 | 65 |
| α-MnO2 sphere | 0.25 M Na2SO4 | 200 | 1 | 66 |
| MnO2 nanosheet | 0.1 M Na2SO4 | 182 | 0.1 | 67 |
| MnO2 microsphere | 1 M Na2SO4 | 190 | 0.5 | 68 |
| MnO2 nanosheet array | 1 M Na2SO4 | 201 | 1 | 69 |
| MnO2 tubular nanostructure | 1 M Na2SO4 | 315 | 0.2 | 70 |
| Mesoporous MnO2 particle | 1 M Na2SO4 | 173 | 0.25 | 71 |
| Porous nano-MnO2 | 1 M Na2SO4 | 198 | 0.28 | 72 |
| Electrodeposited MnO2-nanopillars | 1 M Na2SO4 | 603 | 10.0 | 73 |
Symmetric pseudocapacitor with a nickel foam substrate
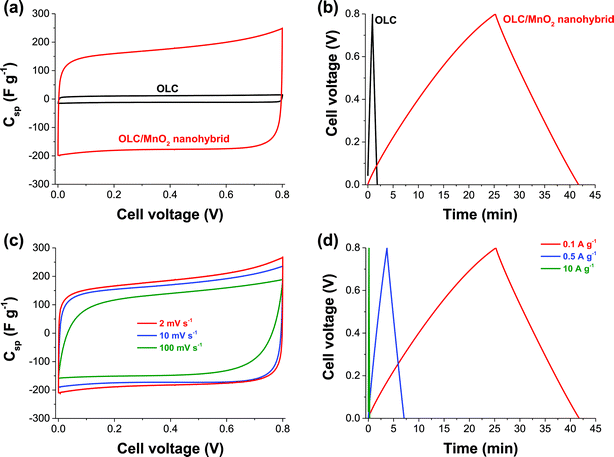
Further investigation of the OLC and OLC/MnO2 as a full cell symmetric supercapacitor was carried out using nickel foam as the current collector considering its lower cost and better performance at half-cell experiments compared to platinum. Fig. 7 shows CVs (Fig. 7a and c) and galvanostatic charge–discharge curves (Fig. 7b and d) of the OLC and OLC/MnO2 nanohybrid. In agreement with the three-electrode experiment, two-electrode data of the OLC/MnO2 nanohybrid show much higher gravimetric capacitance compared to OLC electrodes. The OLC/MnO2 is capable of cycling at very high current densities (up to 10 A g−1, Fig. 7d), yielding a high specific capacitance suitable for high power energy storage applications.Table 3 summarizes the values of the capacitance parameters obtained in comparison with the literature, and it is evident that the OLC/MnO2 nanohybrid exhibits higher performance (in terms of power density or rate capability) than many state-of-the-art MnO2-based pseudocapacitors. Note that there has been no known report on symmetric supercapacitors based on birnessite-type MnO2 in the literature so far; yet, the latter is important to transition to actual devices.
| Electrode | Electrolyte | V max (V) | C sp (F g−1) | E sp (W h kg−1) | P max (kW kg−1) | #EDR (Ω cm2) | References |
|---|---|---|---|---|---|---|---|
| a Key: GN = graphene nanosheet; GF = graphene foam; CNT = carbon nanotube; DNTA = double-walled nanotube array; CNOs = carbon nano-onions; PDDA: polydiallyldimethylammonium chloride. #The EDR (equivalent distributed resistance) values were obtained prior to stability studies, and were converted to the Ω cm2 based on the information we extracted from the cited reports. | |||||||
| OLC | 1 M Na2SO4 | 0.8 | 12 | 0.3 | 2.9 | 7.8 | This work |
| OLC/MnO2 | 1 M Na2SO4 | 0.8 | 254 | 5.6 | 74.8 | 3.1 | This work |
| GF/MnO2 | 1 M Na2SO4 | 1.0 | 240 | 8.3 | 20.0 | ∼11.9 | 74 |
| C/MnO2 DNTAs | 1 M Na2SO4 | 0.8 | 161 | 35.0 | 16.0 | ∼20 | 75 |
| CNOs/MnO2 | 0.5 M H2SO4 | 1.0 | 575 | 30.1 | 17.9 | ∼7 | 30 |
| GN-(γ-MnO2/CNT) | 6 M KOH | 1.0 | 310 | 43.0 | 26.0 | ∼3.2 | 76 |
| MnO2/PDDA/CNO | 1 M Na2SO4 | 0.9 | 219 | 6.1 | — | ∼8.3 | 77 |
Voltage-holding (or floating) experiments represent a reliable analysis method for establishing the long-term stability of supercapacitor electrodes.60,61 In this work, the OLC/MnO2 nanohybrid exhibited excellent stability during voltage-holding over 50 h at 1 A g−1 (see ESI, Fig. S4†). This performance has been illustrated by the gradual decrease in the specific capacitance as the current is kept constant at high potential, retaining ca. 200 F g−1 (i.e., approximately 90% of its initial capacitance of 220 F g−1). The excellent stability of the OLC/MnO2 nanohybrid showed that this device can be charged and discharged without significant deterioration. These values correspond to a maximum specific energy of 5.6 W h kg−1 and an excellent power density of 74.8 kW kg−1. The improved performance of this hybrid symmetric pseudocapacitor is attributed to the combination of the high electrical conductivity of OLC and the highly reversible redox reactions (pseudocapacitance) arising from the nanostructured MnO2 material.
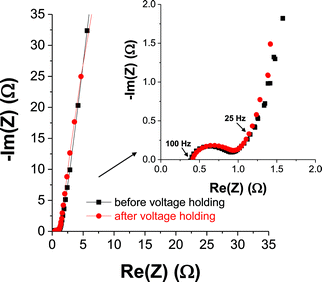
EIS data were acquired prior to and post-floating experiments for the OLC/MnO2 nanohybrid material (Fig. 8 and ESI, Fig. S5†) and OLC alone (see ESI, Fig. S6†). The equivalent distributed resistance (EDR), comprising both the equivalent series resistance (ESR) and the ionic resistance within the porous structure (i.e., RC semicircle), was obtained by extrapolating the vertical portion of the plot to the real axis. The OLC/MnO2 device shows a lower EDR (3.1 Ω cm2) compared to the OLC alone (7.8 Ω cm2). However, the RC semicircle for the OLC/MnO2 is slightly bigger (∼1.8 Ω cm2) than that of the OLC alone (∼1.2 Ω cm2), meaning that the ionic resistance within the porous structure of the pure EDLC (OLC alone) is increased for the OLC/MnO2 pseudocapacitor. From the Bode plots, the phase angle for the pure OLC is −85° (which is close to the −90° for an ideal EDLC) compared to the OLC/MnO2 which is −80°, further indicating the pseudocapacitive behavior of the OLC/MnO2 device. The knee frequency (fo, ϕ = −45°) describes the maximum frequency at which the capacitive behavior is dominant, and is a measure of the power capability of a supercapacitor; the higher the fo the more rapidly the supercapacitor can be charged and discharged or the higher the power density that can be achieved from the supercapacitor. The values of fo were ca. 25 Hz for the OLC/MnO2 (time constant ∼ 40 ms) and 5 Hz (time constant ∼ 0.2 s) for the OLC, which further corroborates the higher power performance of the OLC/MnO2 over its OLC counterpart. It is important to note that the fo values remain approximately the same for both devices before and after 50 h voltage holding. This result shows that most of the stored energy in OLC/MnO2 is accessible up to 25 Hz, that is, the energy output available on the millisecond time scale. It should be stated here that most commercially available supercapacitors, including those designed for higher power applications, operate at frequencies less than 1 Hz.62
Conclusions
This work investigated the electrochemical performance of highly graphitized onion-like carbon integrated with nanostructured birnessite-type MnO2 materials (OLC/MnO2) when used as a symmetrical pseudocapacitor device. From the half-cell experiment, the OLC/MnO2 nanohybrid exhibited better performance when using Ni foam as the current collector (in terms of specific capacitance and rate capability) compared to a Pt disc substrate. Based on its excellent performance, Ni foam was used to fabricate the OLC/MnO2 symmetric pseudocapacitor. The device gave excellent electrochemical performance with a specific capacity of 408 F g−1, specific energy density of 5.6 W h kg−1, power density of 74.8 kW kg−1, capacity retention upon long-hour voltage-holding and cycling, very low equivalent distributed resistance (EDR ≈ 3 Ω cm2), and very short RC time constant (40 ms). Using such a nanohybrid material, it is possible to overcome the main limitation of MnO2, namely its poor electrical conductivity (10−6 to 10−5 S cm−1) and to exploit its main advantages, namely low-cost, high abundance, and environmental friendliness, for high power energy storage devices. Indeed, the electrochemical properties of OLC/MnO2 nanohybrids as high-rate energy storage devices have great potential for the development of high power aqueous-based supercapacitors that can be deployed for high-power technological applications.Acknowledgements
This work was funded by the CSIR as well as the South Africa's Department of Science and Technology (DST) and National Research Foundation (NRF) under the “Nanotechnology Flagship Programme” (supercapacitors and fuel cell project, Grant no: 69849). KM thanks the DST/NRF for scarce skill doctoral scholarship. PME and KR thank the NRF for postdoctoral fellowships. CSIR, INM, and Saarland University are partners in the CREATe-Network funded by the European Commission. The INM is part of the Leibniz Research Alliance Energy Transition (LVE). The authors acknowledge the funding from the German Federal Ministry for Research and Education (BMBF) in support of the nanoEES3D project (award number 03EK3013) as part of the strategic funding initiative energy storage framework. MZ and VP thank Prof. Eduard Arzt (INM) for his continuous support. Dipl.-Ing. Sebastian Slawik and Prof. Frank Mücklich (Chair of Functional Materials, Saarland University) are thanked for their support regarding X-ray diffraction.References
- F. Béguin, V. Presser, a. Balducci and E. Frackowiak, Adv. Mater., 2014, 2219 CrossRef PubMed.
- A. Burke, J. Power Sources, 2000, 91, 37 CrossRef CAS.
- P. Simon, Y. Gogotsi and B. Dunn, Science, 2014, 343, 1210 CrossRef CAS PubMed.
- V. Augustyn, P. Simon and B. Dunn, Energy Environ. Sci., 2014, 7, 1597 CAS.
- P. Simon and Y. Gogotsi, Nat. Mater., 2008, 7, 845 CrossRef CAS PubMed.
- Y. Zhai, Y. Dou, D. Zhao, P. F. Fulvio, R. T. Mayes and S. Dai, Adv. Mater., 2011, 23, 4828 CrossRef CAS PubMed.
- B. E. Conway, V. Birss and J. Wojtowicz, J. Power Sources, 1997, 66, 1 CrossRef CAS.
- R. Kotz and M. Carlen, Electrochim. Acta, 2000, 45, 2483 CrossRef CAS.
- E. Frackowiak and F. Béguin, Carbon, 2001, 39, 937 CrossRef CAS.
- J. R. Miller, Science, 2012, 335, 1312 CrossRef CAS PubMed.
- C. Largeot, C. Portet, J. Chmiola, P. Taberna, Y. Gogotsi and P. Simon, J. Am. Chem. Soc., 2008, 130, 2730 CrossRef CAS PubMed.
- E. Frackowiak, Phys. Chem. Chem. Phys., 2007, 9, 1774 RSC.
- A. T. Chidembo, K. I. Ozoemena, B. O. Agboola, V. Gupta, G. G. Wildgoose and R. G. Compton, Energy Environ. Sci., 2010, 3, 228 CAS.
- A. Bello, K. Makgopa, M. Fabiane, D. Dodoo-Ahrin, K. I. Ozoemena and N. Manyala, J. Mater. Sci., 2013, 48, 6707 CrossRef CAS.
- C. J. Jafta, F. Nkosi, L. le Roux, M. K. Mathe, M. Kebede, K. Makgopa, Y. Song, D. Tong, M. Oyama, N. Manyala, S. Chen and K. I. Ozoemena, Electrochim. Acta, 2013, 2 Search PubMed.
- E. J. Ra, E. Raymundo-Piñero, Y. H. Lee and F. Béguin, Carbon, 2009, 47, 2984 CrossRef CAS.
- J. Li, E. Liu, W. Li, X. Meng and S. Tan, J. Alloys Compd., 2009, 478, 371 CrossRef CAS.
- U. Fischer, R. Saliger and V. Bock, J. Porous Mater., 1997, 285, 281 CrossRef.
- Y. Wang, Z. J. Han, S. F. Yu, R. R. Song, H. H. Song, K. Ken Ostrikov and H. Y. Yang, Carbon, 2013, 64, 230 CrossRef CAS.
- Y. Wang, F. Yan, S. W. Liu, A. Y. S. Tan, H. Song, X. W. Sun and H. Y. Yang, J. Mater. Chem. A, 2013, 1, 5212 CAS.
- D. M. Anjos, J. K. McDonough, E. Perre, G. M. Brown, S. H. Overbury, Y. Gogotsi and V. Presser, Nano Energy, 2013, 2, 702 CrossRef CAS.
- I. Kovalenko, D. G. Bucknall and G. Yushin, Adv. Funct. Mater., 2010, 20, 3979 CrossRef CAS.
- Y. Gao, Y. S. Zhou, M. Qian, X. N. He, J. Redepenning, P. Goodman, H. M. Li, L. Jiang and Y. F. Lu, Carbon, 2013, 51, 52 CrossRef CAS.
- E. G. Bushueva, P. S. Galkin, A. V. Okotrub, L. G. Bulusheva, N. N. Gavrilov, V. L. Kuznetsov and S. I. Moiseekov, Phys. Status Solidi, 2008, 245, 2296 CrossRef CAS.
- C. Portet, G. Yushin and Y. Gogotsi, Carbon, 2007, 45, 2511 CrossRef CAS.
- J. K. McDonough, A. I. Frolov, V. Presser, J. Niu, C. H. Miller, T. Ubieto, M. V. Fedorov and Y. Gogotsi, Carbon, 2012, 50, 3298 CrossRef CAS.
- I. Suarez-Martinez, N. Grobert and C. P. Ewels, Carbon, 2012, 50, 741 CrossRef CAS.
- V. N. Mochalin, O. Shenderova, D. Ho and Y. Gogotsi, Nat. Nanotechnol., 2012, 7, 11 CrossRef CAS PubMed.
- D. Pech, M. Brunet, H. Durou, P. Huang, V. Mochalin, Y. Gogotsi, P.-L. Taberna and P. Simon, Nat. Nanotechnol., 2010, 5, 651 CrossRef CAS PubMed.
- M. V. K. Azhagan, M. V. Vaishampayan and M. V. Shelke, J. Mater. Chem. A, 2014, 2, 2152 CAS.
- V. L. Kuznetsov, A. L. Chuvilin, Y. V. Butenko, I. Y. Mal'kov and V. M. Titov, Chem. Phys. Lett., 1994, 222, 343 CrossRef CAS.
- D. Urgate, Nature, 1992, 359, 707 CrossRef PubMed.
- S. Iijima, J. Cryst. Growth, 1980, 50, 675 CrossRef CAS.
- M. Choucair and J. A. Stride, Carbon, 2012, 50, 1109 CrossRef CAS.
- C. Julien, Solid State Ionics, 2003, 159, 345 CrossRef CAS.
- C. Matei Ghimbeu, A. Malak-Polaczyk, E. Frackowiak and C. Vix-Guterl, J. Appl. Electrochem., 2013, 44, 123 CrossRef.
- P. Yu, X. Zhang, Y. Chen and Y. Ma, Mater. Lett., 2010, 64, 1480 CrossRef CAS.
- B. Ming, J. Li, F. Kang, G. Pang, Y. Zhang, L. Chen, J. Xu and X. Wang, J. Power Sources, 2012, 198, 428 CrossRef CAS.
- M. Huang, Y. Zhang, F. Li, L. Zhang, R. S. Ruoff, Z. Wen and Q. Liu, Sci. Rep., 2014, 4, 3878 Search PubMed.
- X. Zhang, X. Sun, H. Zhang, D. Zhang and Y. Ma, Mater. Chem. Phys., 2012, 137, 290 CrossRef CAS.
- X. Zhang, P. Yu, H. Zhang, D. Zhang, X. Sun and Y. Ma, Electrochim. Acta, 2013, 89, 523 CrossRef CAS.
- Y. Wang, S. F. Yu, C. Y. Sun, T. J. Zhu and H. Y. Yang, J. Mater. Chem., 2012, 22, 17584 RSC.
- P. Yang, Y. Ding, Z. Lin, Z. Chen, Y. Li, P. Qiang, M. Ebrahimi, W. Mai, C. P. Wong and Z. L. Wang, Nano Lett., 2014, 14, 731 CrossRef CAS PubMed.
- Z.-S. Wu, W. Ren, D.-W. Wang, F. Li, B. Liu and H.-M. Cheng, ACS Nano, 2010, 4, 5835 CrossRef CAS PubMed.
- H. Xia, Y. Wang, J. Lin and L. Lu, Nanoscale Res. Lett., 2012, 7, 33 CrossRef PubMed.
- H. Yang, J. Jiang, W. Zhou, L. Lai, L. Xi, Y. M. Lam, Z. Shen, B. Khezri and T. Yu, Nanoscale Res. Lett., 2011, 6, 531 CrossRef PubMed.
- D. Weingarth, M. Zeiger, N. Jäckel, M. Aslan, G. Feng and V. Presser, Adv. Energy Mater., 2014, 4, 1400316 Search PubMed.
- S. Brunauer, P. H. Emmett and E. Teller, J. Am. Chem. Soc., 1938, 60, 309 CrossRef CAS.
- G. Y. Gor, M. Thommes, K. A. Cychosz and A. V. Neimark, Carbon, 2012, 50, 1583 CrossRef CAS.
- Y. V. Butenko, V. L. Kuznetsov, A. L. Chuvilin, V. N. Kolomiichuk, S. V. Stankus, R. A. Khairulin and B. Segall, J. Appl. Phys., 2000, 88, 4380 CrossRef CAS.
- T. K. Gupta, B. P. Singh, V. N. Singh, S. Teotia, A. P. Singh, I. Elizabeth, S. R. Dhakate, S. K. Dhawan and R. B. Mathur, J. Mater. Chem. A, 2014, 2, 4256 CAS.
- K. Bogdanov, A. Fedorov, V. Osipov, T. Enoki, K. Takai, T. Hayashi, V. Ermakov, S. Moshkalev and A. Baranov, Carbon, 2014, 73, 78 CrossRef CAS.
- D. Yang and M. Wang, Chem. Mater., 2001, 13, 2589 CrossRef CAS.
- F.-J. Liu, J. Power Sources, 2008, 182, 383 CrossRef CAS.
- Z. Li, Y. Mi, X. Liu, S. Liu, S. Yang and J. Wang, J. Mater. Chem., 2011, 21, 14706 RSC.
- Y.-K. Hsu, Y.-C. Chen, Y.-G. Lin, L.-C. Chen and K.-H. Chen, J. Mater. Chem., 2012, 22, 2733 RSC.
- M. C. Biesinger, B. P. Payne, A. P. Grosvenor, L. W. M. Lau, A. R. Gerson and R. S. C. Smart, Appl. Surf. Sci., 2011, 257, 2717 CrossRef CAS.
- T. E. Rufford, D. Hulicova-Jurcakova, K. Khosla, Z. Zhu and G. Q. Lu, J. Power Sources, 2010, 195, 912 CrossRef CAS.
- L.-Y. Lin, M.-H. Yeh, J.-T. Tsai, Y.-H. Huang, C.-L. Sun and K.-C. Ho, J. Mater. Chem. A, 2013, 1, 11237 CAS.
- D. Weingarth, A. Foelske-Schmitz and R. Kötz, J. Power Sources, 2013, 225, 84 CrossRef CAS.
- P. Ratajczak, K. Jurewicz and F. Béguin, J. Appl. Electrochem., 2013, 44, 475 CrossRef.
- J. R. Miller, Electrochem. Soc. Proc. Ser., 1996, 246 CAS , PV95-29.
- Y. Zhao, P. Jiang and S.-S. Xie, J. Power Sources, 2013, 239, 393 CrossRef CAS.
- W. Li, Q. Liu, Y. Sun, J. Sun, R. Zou, G. Li, X. Hu, G. Song, G. Ma, J. Yang, Z. Chen and J. Hu, J. Mater. Chem., 2012, 22, 14864 RSC.
- Y. Zhang, G. Li, Y. Lv, L. Wang, A. Zhang, Y. Song and B. Huang, Int. J. Hydrogen Energy, 2011, 36, 11760 CrossRef CAS.
- Y. Zhang, C. Sun, P. Lu, K. Li, S. Song and D. Xue, CrystEngComm, 2012, 14, 5892 RSC.
- H. Jang, S. Suzuki and M. Miyayama, J. Electrochem. Soc., 2012, 159, A1425 CrossRef CAS.
- W. Ko, L. Chen, Y. Chen, W. Chen, K. Lu, J. Yang, Y. Yen and K. Lin, J. Phys. Chem. C, 2013, 117, 16290 CAS.
- M. Kundu and L. Liu, J. Power Sources, 2013, 243, 676 CrossRef CAS.
- J. Zhu, W. Shi, N. Xiao, X. Rui, H. Tan, X. Lu, H. H. Hng, J. Ma and Q. Yan, ACS Appl. Mater. Interfaces, 2012, 4, 2769 CAS.
- L. Chen, N. Gu, R. Ding, L. Qi and H. Wang, J. Solid State Electrochem., 2013, 17, 2579 CrossRef CAS.
- H.-Q. Wang, G. Yang, Q.-Y. Li, X.-X. Zhong, F.-P. Wang, Z.-S. Li and Y. Li, New J. Chem., 2011, 35, 469 RSC.
- Z. Yu, B. Duong, D. Abbitt and J. Thomas, Adv. Mater., 2013, 25, 3302 CrossRef CAS PubMed.
- A. Bello, O. O. Fashedemi, J. N. Lekitima, M. Fabiane, D. Dodoo-Arhin, K. I. Ozoemena, Y. Gogotsi, A. T. Charlie Johnson and N. Manyala, AIP Adv., 2013, 3, 082118 CrossRef.
- Q. Li, X.-F. Lu, H. Xu, Y.-X. Tong and G.-R. Li, ACS Appl. Mater. Interfaces, 2014, 6, 2726 CAS.
- R. B. Rakhi, W. Chen, D. Cha and H. N. Alshareef, Adv. Energy Mater., 2012, 2, 381 CrossRef CAS.
- R. Borgohain, J. P. Selegue and Y.-T. Cheng, J. Mater. Chem. A, 2014, 2, 20367 CAS.
Footnote |
| † Electronic supplementary information (ESI) available. See DOI: 10.1039/c4ta06715k |
| This journal is © The Royal Society of Chemistry 2015 |

