
 Open Access Article
 This Open Access Article is licensed under a
 Creative Commons Attribution 3.0 Unported Licence
Rate-dependence of ‘wet’ biological adhesives and the function of the pad secretion in insects†
David
Labonte
* and
Walter
Federle
Department of Zoology, University of Cambridge, UK. E-mail: dl416@cam.ac.uk
First published on 10th September 2015
Abstract
Many insects use soft adhesive footpads for climbing. The surface contact of these organs is mediated by small volumes of a liquid secretion, which forms thin films in the contact zone. Here, we investigate the role of viscous dissipation by this secretion and the ‘bulk’ pad cuticle by quantifying the rate-dependence of the adhesive force of individual pads. Adhesion increased with retraction speed, but this effect was independent of the amount of pad secretion present in the contact zone, suggesting that the secretion's viscosity did not play a significant role. Instead, the rate-dependence can be explained by relating the strain energy release rate to the speed of crack propagation, using an established empirical power law. The ‘wet’ pads' behaviour was akin to that of ‘dry’ elastomers, with an equilibrium energy release rate close to that of dry van-der-Waals contacts. We suggest that the secretion mainly serves as a ‘release layer’, minimising viscous dissipation and thereby reducing the time- and ‘loading-history’-dependence of the adhesive pads. In contrast to many commercial adhesives which derive much of their strength from viscous dissipation, we show that the major modulator of adhesive strength in ‘wet’ biological adhesive pads is friction, exhibiting a much larger effect than retraction speed. A comparison between ‘wet’ and ‘dry’ biological adhesives, using both results from this study and the literature, revealed a striking lack of differences in attachment performance under varying experimental conditions. Together, these results suggest that ‘wet’ and ‘dry’ biological adhesives may be more similar than previously thought.
Introduction
Many arthropods and small vertebrates possess the ability to climb on smooth inverted substrates using adhesive pads located on their legs. In tree frogs, spiders, and insects, the adhesive contact is mediated via thin films of a liquid secretion.1–13 The presence of a pad secretion is often used to distinguish between these ‘wet’ adhesives and their ‘dry’ counterparts in pad-bearing lizards. Despite several previous studies, the secretion's detailed function has remained largely unclear.14–16One of the frequently discussed functional implications of a ‘wet’ adhesive is the potential contribution of viscous forces to friction, adhesion, and the contact formation in general.4,9,16–28 Indeed, the (dynamic) attachment forces of insects have been shown to decrease with temperature, suggesting that the viscosity of the pad secretion may play a significant role.17,21,23 In addition, the adhesive pads themselves have been shown to be viscoelastic,29,30–32 but the functional relevance of this property again remains unclear.
Energy dissipation via viscous material flow is a major contributor to the strength and toughness of many soft synthetic adhesives.33–35 However, a significant contribution of viscous forces may also have undesirable consequences, in particular for adhesives used during locomotion. For example, detachment in the presence of a liquid requires considerable work, in contrast to ‘dry’ contacts where this work can be close to the thermodynamic work of adhesion. Viscous forces introduce a time- and load-history dependence of adhesive strength and toughness, which may limit locomotion speed, and can also compromise the structural integrity and thus re-usability of the pads. From this perspective, it may be advantageous to limit viscous energy dissipation, and instead use different mechanisms to modulate adhesive strength during locomotion.
Here, we address the role of viscous dissipation in the ‘wet’ adhesive pads of Indian stick insects (Carausius morosus), and focus on the following questions
i. How does adhesive force vary with retraction speed?
ii. How does the amount of fluid present in the contact zone influence the relationship between retraction speed and adhesive force?
iii. Does the viscoelastic pad material itself contribute to the relationship between retraction speed and adhesive force?
In order to account for viscous dissipation in the deformable pad itself, we model the detachment using fracture mechanics, which we briefly outline in the following section.
A fracture mechanics approach to insect adhesion
In fracture mechanics, the perimeter of an adhesive contact can be treated as a crack. During detachment, this crack advances, i.e. the contact area A between the pad and the surface decreases incrementally, and as a result the amount of elastic and potential mechanical energy stored in the materials changes. The variation of the elastic and mechanical potential energy with A is called strain energy release rate G: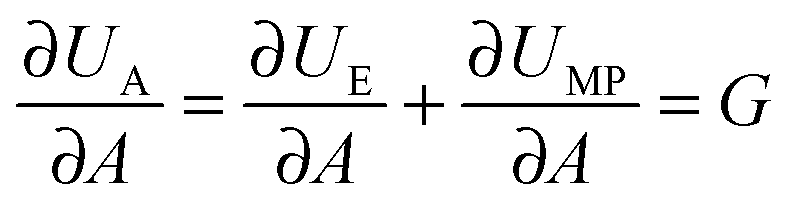 | (1) |
 , where G0 is the thermodynamic work of adhesion. Breaking adhesive bonds requires the work G0
![[thin space (1/6-em)]](https://www.rsc.org/images/entities/char_2009.gif) dA, and the excess – (G − G0) dA – is transformed into kinetic energy if there is no dissipation. G − G0 can thus be interpreted as a crack extension force (per unit crack length), and large values imply that the crack propagates through the interface with high speed. This can result in high strain rates at the crack tip which may trigger a viscoelastic material response, dampening a further increase in the speed of crack propagation. Notably, as long as the expenditure of energy is limited to a region that is small in comparison to the elastically deformed sample, the relationship between load, displacement and contact radius can be accurately described by a single elastic constant for the bulk pad material, and thus eqn (1) is still valid.36,37 The contributions of the viscoelastic ‘bulk’ and the adhesive interface to the crack extension force can be separated using an established empirical law, which relates the crack extension force to the speed of crack propagation vc37–45
dA, and the excess – (G − G0) dA – is transformed into kinetic energy if there is no dissipation. G − G0 can thus be interpreted as a crack extension force (per unit crack length), and large values imply that the crack propagates through the interface with high speed. This can result in high strain rates at the crack tip which may trigger a viscoelastic material response, dampening a further increase in the speed of crack propagation. Notably, as long as the expenditure of energy is limited to a region that is small in comparison to the elastically deformed sample, the relationship between load, displacement and contact radius can be accurately described by a single elastic constant for the bulk pad material, and thus eqn (1) is still valid.36,37 The contributions of the viscoelastic ‘bulk’ and the adhesive interface to the crack extension force can be separated using an established empirical law, which relates the crack extension force to the speed of crack propagation vc37–45 | (2) |
Here, G0 is the critical energy release rate as vc approaches zero, ϕ(atvc) is a viscoelastic ‘loss function’, proportional to G0, and at is the Williams–Landel–Ferry shift factor for time–temperature superposition. In this work, we use a specific form of the viscoelastic ‘loss function’, ϕ = (vc/v*)n, where v* is a characteristic crack speed at which G = 2G0, and n is an empirical constant.37,43–46 Note the simplifying assumption that G0 is rate-independent. Eqn (2) is valid independent of probe geometry, illustrating the advantage of fracture mechanics.36
Adhesive pads of stick insects are irregularly shaped, with a bean-shaped contact area, and an accurate quantitative expression for G is, to our knowledge, not available. In order to circumvent this problem, we study the variation of the relative energy dissipation, G/G0 − 1, for three common contact geometries. We are making the simplifying assumption that for each geometry, the adhesion force P is described by a single equation containing a velocity-dependent energy release rate G. Thus, for a circular flat punch (assuming an approximately constant elastic modulus), G/G0 ≈ P(vc)2/P02,47 while for an adhesive tape and a spherical indenter, G/G0 ≈ P(vc)/P0, respectively.48,49 Here, P(vc) is the peak adhesive force measured at a finite crack speed vc, and P0 is the peak adhesive force required to detach the pad under true equilibrium conditions (i.e. vc = 0). Thus, if P, vc, and P0 are known, the scaling of the relative energy dissipation with crack speed can be assessed without any specific assumptions regarding the stiffness or size of the pads.
Materials and methods
Study animals and set-up
Adult Indian stick insects (Carausius morosus, Phasmatidae, Sinéty 1901, body mass: 0.80 ± 0.1 g, mean ± standard deviation, n = 21) were taken from laboratory colonies fed with bramble, ivy and water ad libitum. Prior to force measurements, stick insects were slid into glass tubes, and one of the two protruding front legs was attached to a supporting metal wire, so that the ventral side of the arolium was the highest point.50Peak adhesion of individual arolia of live insects was measured using a custom-built fibre-optic 1D-force transducer. A small piece of reflective foil was glued onto one end of a brass plate cut to 100 × 10 × 0.2 mm (length × width × thickness), and the opposite end of the plate was clamped onto a metal support with a free-standing length of 30 mm (see Fig. 1A). The metal support was fixed to a 3D motor positioning stage (M-126PD, Physik Instrumente, Karlsruhe, Germany, resolution 0.25 μm, maximum velocity 15 mm s−1), controlled by a custom-made Labview programme (National Instruments, Austin, TX, USA). The end of a D12 fibre optic sensor (Philtec, INC., Annapolis, USA) was slowly lowered towards the reflective foil, using a micro-manipulator mounted on a custom-built holder (see Fig. 1A). The optical peak of the sensor signal was set to 5 V, using the built-in amplification factor of the sensor's amplifier. The fibre optic sensor was then lowered further until the distance between the tip and the reflective foil was approximately 77 μm (equivalent to around 2.2 V), corresponding to the middle of the linear range of the sensor's highly sensitive near-field. An external circuit was used to offset the voltage to 0 V.
 | ||
| Fig. 1 (A) Schematic of the set-up used to measure the adhesive force of individual pads of live insects for different retraction speeds. (B) Example data of the relative contact radius during detachment with different retraction speeds. The inset shows a zoomed view of the time just before detachment (frame), for better illustration of the faster pull-offs. The lines are the result of a LOESS fit with span 0.3, and their slope is equivalent to the relative speed of crack propagation. | ||
The fibre-optic force transducer had a spring constant of 14–17 N m−1 (depending on the effective lever arm), a resonance frequency of 60 Hz (approximately three times faster than the shortest force peaks measured in this study), and a resolution of 20 μN, corresponding to around 30% of the smallest adhesive force measured in this study. The output of the fibre optic sensor was recorded at 50 Hz via a data acquisition board (PCI-6035E, National Instruments), and at 1000 Hz using a 2020 PicoScope oscilloscope (Pico Technology Ltd, Neots, Cambridgeshire, UK). The 50 Hz signal was used as the input for a force-feedback algorithm implemented in the Labview software, while force data for analysis were extracted from the 1000 Hz signal (see ESI† for representative force–time curves). In the range of velocities used in this study, the z-motor movement was linear (average R2 > 0.99), and the actual speed was within ±3% of the prescribed velocities.
All measurements were performed with glass coverslips (18 mm × 18 mm × 0.14 mm), which were cleaned before the experiments in an ultrasonic bath (FB 15051, Fisher Scientific, Loughborough, UK) in acetone, and isopropanol (both Fisher Scientific), followed by a rinsing step with de-ionized water and blow-drying with nitrogen. Measurements were performed at ambient conditions (22–25 °C, 40–55% relative humidity) to avoid a systematic influence of temperature or humidity on adhesion.23,51
Experimental protocol
Adhesion was measured for all seven retraction speeds per arolium, with a time between detachment and subsequent re-attachment of at least 3 s. The order of the retraction speeds was randomized and each measurement was conducted on a ‘fresh’ spot, in order to avoid a systematic effect of fluid depletion or accumulation on the relationship between peak adhesion and retraction speed.52 During the measurements, the contact area of the pads was filmed using a TTL-triggered Redlake PCI 1000 B/W high-speed camera (Redlake MASD LLC, San Diego, CA, USA), mounted on a stereo-microscope with coaxial illumination (Wild M3C, Leica, Wetzlar, Germany, see ESI† for a representative video). Table 1 shows the frame rate of the recordings for the different retraction speeds.
| Retraction speed in μm s−1 | Frames per second |
|---|---|
| 10 | 20 |
| 50 | 50 |
| 100 | 50 |
| 250 | 50 |
| 500 | 100 |
| 1000 | 200 |
| 2000 | 500 |
Data analysis
Peak adhesion for all experiments performed with the fibre-optic sensor was extracted from the 1000 Hz force–time data using custom-made Matlab scripts (The Mathworks, Natick, MA, USA). Video recordings were post-processed using Fiji.54 The flickering of the light source visible at frame rates >200 fps was removed by normalising the grey level of all images to the average grey value of the first frame, and the recordings were subsequently converted into binary images, using a ‘fuzzy threshold’ algorithm.55 The binary images were de-speckled using 2 × 2 median filters, and the contact area A, perimeter Γ, width (lateral), height (proximal–distal) and coordinates of a bounding rectangle around the arolia were measured from the videos, using the native particle analysis routines implemented in Imagejv1.48k. All contact area parameters were smoothed with a second order LOESS-algorithm (span = 0.3). In order to compensate for the decrease in resolution with increasing detachment speed, the detachment time was divided into 200 steps, and the LOESS-fit was used to predict the contact area parameters at these steps from the original data (see Fig. 1B). | (3) |
In order to investigate whether detachment is directional, the peel velocity in the longitudinal and transverse directions was measured as the change in the length and width of the contact area, respectively, via a least-square regression of the filtered data against time, including two data points on either side of 60, 40 and 20% of Amax, respectively.
Modelling and statistics
The effects of retraction speed, accumulation/depletion and shear force on adhesion were analysed with linear mixed models using the R package nlme, v3.1–119. Ratios were arcsine-square root transformed prior to analysis to correct for the non-normality of residuals. Eqn (2) was fitted to the data as follows: vc and Pmax were averaged for each retraction speed. In order to estimate P0, we used independent force data, acquired with the same set-up and insects of a similar size, but at a slower retraction speed of 1 μm s−1. The measured crack speed and the corresponding peak adhesive force were combined with the data measured at a retraction speed of 10 μm s−1 to linearly extrapolate the peak adhesive force under equilibrium conditions (i.e. vc = 0), yielding P0 = 0.12 mN as an upper limit of P0. The parameters n and v* were fitted to the averaged data using a non-linear least squares algorithm.The value of Ac used for the measurement of the speed of crack propagation depends on the pre-load and carries some uncertainty, but a speed-independent critical area has been reported before for flat punches made from polyurethane.46 We repeated our analysis using values of Ac of 40% and 50% of Amax and found that the qualitative results remained unaffected.
Data reported in the text are mean ± standard deviation unless otherwise stated. All statistical analysis was carried out with R v.3.0.3.56
Results
Influence of retraction speed on adhesion and crack propagation speed
Despite a two hundred-fold variation in retraction speed, peak adhesion varied only moderately, by a factor of around three, from a minimum of 0.16 ± 0.07 mN measured at 10 μm s−1 retraction speed, to a peak value of 0.52 ± 0.21 observed at 2000 μm s−1 retraction speed (linear mixed model, F1,95 = 72.67, p < 0.001, n = 16; see Fig. 2A). Thus, the largest adhesion force was still less than 10% of the animals' body weight. Crack propagation speed, in turn, increased more strongly with retraction speed, from a minimum of 9 ± 3 μm s−1, up to a maximum of 1482 ± 394 μm s−1 (linear mixed model, F1,95 = 224.19, p < 0.001, n = 16; see Fig. 2B). | ||
| Fig. 2 (A) Adhesion of the attachment pads of Carausius morosus stick insects increased significantly with retraction speed. (B) The speed of crack propagation varied over three orders of magnitude (both n = 16). Error bars show 95% confidence intervals. | ||
Influence of retraction speed on the ‘mode of detachment’
The aspect ratio of the pads' contact area (transverse width divided by distal–proximal length) remained constant during detachment, was independent of the applied retraction speed, and averaged 1.6 ± 0.33 (n = 16, see ESI† for detailed statistics). Accordingly, the ratio of the lateral and distal–proximal peeling velocities did not differ significantly from the aspect ratio (paired t-test, t15 = −1.4, p = 0.18, n = 16), and remained constant during detachment, again independent of the retraction speed (see ESI†). The width of the pads changed approximately 1.8 ± 0.6 faster than their distal–proximal length (n = 16). However, peeling from both left and right, and from distal and proximal, occurred with equal speed (left vs. right: paired t-test, t15 = −1.24, p = 0.24; distal vs. proximal: paired t-test, t15 = −1.12, p = 0.28, n = 16).Influence of fluid depletion and accumulation on adhesion and crack propagation speed
The effect of retraction speed on adhesion did not differ between the ‘accumulated’ and the ‘depleted’ conditions (linear mixed model, F1,523 = 2.93, p = 0.087, n = 10, see Fig. 3), and was independent of the step number – a proxy for the amount of fluid depleted or accumulated (F1,523 = 1.39, p = 0.24, n = 10, see Fig. 3). Adhesion, however, varied significantly with step number (F1,523 = 62.39, p < 0.001, n = 10), but this effect was significantly different when fluid was depleted or accumulated (F1,523 = 27.41, p < 0.001, n = 10). Adhesion showed a small but insignificant trend to decrease with step number in the accumulated condition (F1,258 = 1.54, p = 0.22, n = 10). However, it increased significantly when the pads were depleted (F1,258 = 27.16, p < 0.001, n = 10, see Fig. 3). | ||
| Fig. 3 The amount of secretion in the contact zone was experimentally varied by performing repeated artificial ‘steps’ on either ‘fresh’ spots (‘depleted’ – (A)) or repeatedly on the same spot (‘accumulated’, (B)). Adhesion of the attachment pads of Carausius morosus stick insects increased when secretion was depleted, but this effect was independent of retraction speed. When secretion was accumulated, the adhesive force showed a non-significant decreasing trend, again independent of the retraction speed (both n = 10). The lines are the result of a linear mixed model regression where the animals were a random factor, and step number and retraction speed were fixed factors. Error bars show the standard error of the mean. | ||
Crack propagation speed (measured for the first and the last step) did neither differ between the ‘accumulated’ and ‘depleted’ condition (linear mixed model, F1,107 = 0.30, p = 0.58, n = 10), nor between the first and last step (F1,107 = 1.16, p = 0.28, n = 10). Retraction speed was the only fixed factor exhibiting a significant influence on crack propagation speed, explaining around 93% of its variation (F1,107 = 117.25, p < 0.001, n = 10).
Influence of shear force on the relationship between adhesion and retraction speed
Both shear force and retraction speed exhibited a significant influence on adhesion (linear mixed model, shear force: F1,87 = 328.37, p < 0.001; retraction speed: F1,87 = 34.68, p < 0.001, n = 6 for both). However, the effect of shear force was markedly larger (see Fig. 4), and independent of the retraction speed (F1,87 = 0.007, p > 0.93, n = 6). Adhesion varied by almost an order of magnitude, from around 0.26 ± 0.13 mN for detachments without a shear force, up to 2.15 ± 0.71 mN for detachments after the application of 4 mN shear force. These peak adhesive forces correspond to around a third of the animals' body weight. Despite the small range, shear force explained around 72% of the variation in adhesion. Retraction speed, in contrast, accounted for only 5% of the variation in adhesion (see Fig. 4). | ||
| Fig. 4 Adhesion of the attachment pads of Carausius morosus was significantly influenced by both the retraction speed and the shear force acting during detachment, but the two effects were independent of each other, and the effect of shear force was markedly larger (n = 6). Error bars show the standard error of the mean. | ||
Relationship between strain energy release rate and crack propagation speed
The relationship between relative energy dissipation G/G0 − 1 and crack propagation speed is shown in Fig. 5, together with a fit of eqn (2), performed with the assumption that the adhesive pads resemble a flat punch, or a spherical indenter/thin adhesive tape, respectively. The model residuals were random, normally distributed, and the fits explained a significant amount of the variation of the energy dissipation with crack propagation speed (see Table 2).| Geometry | p (Shapiro–Wilk) | p (Runs-test) | R. s. e. |
|---|---|---|---|
| Flat punch | 0.2 | 0.22 | 0.43 |
| Adhesive tape/spherical indenter | 0.77 | 0.23 | 0.08 |
 | ||
| Fig. 5 An empirical power law relating the relative crack extension force to the speed of crack propagation (eqn (2)) was fitted to the experimental data assuming that the adhesive pads resemble (A) a flat punch, or (B) a thin stripe of adhesive tape/a spherical indenter. Error bars show the 95% confidence intervals around the mean. The crosses show the additional data point obtained at a retraction speed of 1 μm s−1, which was used to estimate P0, but was not included in the fit (see text for details). | ||
The empirical constant n varied between 0.49 for the adhesive tape/spherical indenter, and 0.77 for the flat punch (95% confidence intervals (0.44, 0.55) and (0.68, 0.86), respectively, Fig. 5). The estimated amount of dissipated energy differed considerably between the models, which is reflected in different fitted values of v*, the crack propagation speed at which G doubles compared to G0. For the adhesive tape/spherical indenter, v* was fitted as 136 μm s−1, while it was 37 μm s−1 for the flat punch geometry (95% CI (109, 166) μm s−1, and (24, 53) μm s−1, respectively, Fig. 5).
Discussion
Many insects are able to sustain detachment forces equivalent to multiple times their own body weight, yet they can attach and detach their feet effortlessly within milliseconds. Combining strong attachment with rapid detachment is a pre-requisite for dynamic adhesives used during locomotion, and a significant contribution of time-dependent viscous forces may be in conflict with these requirements. Our study revealed two key results concerning the role and origin of viscous dissipation during the detachment of ‘wet’ adhesive pads of stick insects. First, insect pads exhibited only a weak velocity-dependence – the increase of adhesive force with retraction speed was small relative to the animals' body weight, and negligible compared to the effect of shear forces. Thus, viscous forces likely only play a minor role in the adhesion of ‘wet’ adhesive pads, and its modulation during locomotion. Second, the effect of retraction speed was independent of the amount of secretion present in the contact zone. Thus, the contribution of the secretion's viscosity appears to be negligible. Instead, the velocity-dependence of adhesion may be explained by relating the critical strain energy release rate to the speed of crack propagation, and our data are in good agreement with a simple empirical power law of the form G/G0 − 1 ∝ (vc/v*)n, commonly used to study the rate-dependence of ‘dry’ materials.In the following discussion, we will first focus on the information implicit in the observed rate-dependence, specifically regarding the origin of the dissipation, the structural properties of the pad, and the mechanism of attachment. We will then combine these insights with data on the performance of ‘dry’ and ‘wet’ adhesives from previous publications to discuss the functional significance of the pad secretion.
Rate-dependence of insect pad adhesion
In this study, we used a well-established empirical model to relate the strain energy release rate to the speed of crack propagation. This relationship is determined by three empirical constants, G0, n and v*, all of which contain some information about the adhesive interface, and the processes underlying energy dissipation during detachment.The adhesion of ‘wet’ biological pads is often attributed to capillary forces, while ‘dry’ pads are thought to rely on van-der-Waals forces. For a ‘dry’ sphere, G0 = 2/3P0(πR)−1,49 and for a ‘wet’ sphere, γ = 1/3P0(πR)−1,59 where γ is the surface tension of the liquid which is assumed to completely wet the surface. Using R = 450 μm,‡ and P0 = 0.12 mN yields G0 = 57 mN m−1, and γ = 28 mN m−1, both plausible values for interactions based on van-der-Waals forces or on the surface tension of an oily secretion. Thus, this simple quantitative argument does not yield decisive evidence for either of the two mechanisms.
Remarkably, these approaches often assume that the crack propagation in a soft, dissipative material occurs in the same fashion as in a stiff, glassy material. In a detailed study, Hui et al.63 showed that for soft materials with an adhesive strength comparable to their elastic modulus, cracks ‘blunt’ instead of propagate (see also ref. 62). As a consequence, the material close to the crack tip experiences large strains, and the resulting stresses may exceed the yield strength of the material, eventually causing cohesive failure, and the propagation of the crack.63 This dissipative process may involve fibrillation, cavity nucleation, as well as lateral and vertical crack growth, all of which are characteristic of the failure of soft, pressure-sensitive adhesives.64–66 Clearly, animals which make repeated use of their soft pads need to minimise plastic deformation, and it is an interesting question how exactly this can be achieved. Hui et al.63 suggested that in materials with sufficiently large strain hardening, ‘micro-cracks’ can form. The highly stretched material close to the blunted region is much stiffer than the material far away from it, so that the stresses at the interface can become sufficient to decohere the materials. Stick insect pads have a specialised cuticle ultrastructure, where larger principal rods branch into progressively finer fibres closer to the surface membrane formed by the epicuticle,57,67,68 and the outermost layer appears to be considerably softer than the subjacent procuticle.57 It is unclear how these features influence the stress distribution around the crack tip, in particular for blunted cracks and large strains, but in principle, it appears plausible that they will result in strain hardening. A gradual change in ultrastructure and material properties may represent a strategy to avoid cohesive failure of the soft adhesive pads, but further studies are required to corroborate this hypothesis.
First, v* is inversely related to the relaxation time of the adhesive,43 consistent with the interpretation that the rate-dependence is caused by a viscoelastic material response.37 For rubbery materials, the relaxation time may vary between a few to several hundred seconds.43 Gorb et al.29 investigated the viscoelastic properties of the adhesive pads of a bush cricket, and reported a fast (≈0.6 s) and a slow (≈41 s) relaxation. Thus, the differences between the relaxation time of soft adhesive pads and common elastomers might be too small to fully explain the difference in energy dissipation. However, this conclusion remains speculative until reliable data for stick insect pads are available.
Second, v* is related to the mobility of molecules at the interface.44,69,70 For rubbery materials on glass-like substrates, surface molecules may have little or no segmental mobility, resulting in sudden rupture of the bonds, and a considerable increase in G.44 In the presence of thin interfacial layers with high segmental mobility, separation can occur in a more continuous manner, significantly decreasing adhesion and its velocity-dependence.44,69–71 Effectively, the interfacial film acts a ‘release layer’ through which the crack propagates, akin to a lubrication effect. We suggest that the thin lipid layer covering the adhesive pads may convey such a function, and thus decrease viscous dissipation during detachment. This interpretation can also account for the increase of adhesion when pads were ‘depleted’, and the trend for adhesion to decrease when footprints were ‘accumulated’. Repeated steps at the same position may lead to a contamination of the substrate with surface molecules, reducing the otherwise high surface energy of glass, and thus reducing G0. A similar effect has been reported for ‘dry’ gecko pads (see Table 3), and for repeated adhesion measurements on polydimethylsiloxane surfaces.72 Continuously decreasing the amount of free molecules at the interface (‘depletion’), in turn, can reduce the screening of the direct adhesive interaction between the pad material and the surface, resulting in an increase in G0.44
| Experimental | Result | Shown for… | Consistent with… | Note | ||
|---|---|---|---|---|---|---|
| ‘dry’ pads | ‘wet’ pads | ‘dry’ contact | ‘Wet’ contact | |||
| a K Autumn, pers. communication. b 25% increase in adhesion, 5% decrease in friction.102 | ||||||
| Attachment performance at different sliding/detachment speeds | Forces increase with rate | Geckos30,32,102 | Tree frogs,20 ants,21,23 stick insects52 | Yes | Yes | For insects, the rate-dependence of adhesion and friction is quantitatively inconsistent with a continuous liquid film in the pad contact zone, see text. |
| Attachment performance at different temperatures | Decreases with temperature | Geckos103 | Cockroaches,17 ants21,23 | Yes | Yes | For ants, only dynamic forces were temperature-dependent. |
| Attachment performance at different relative humidities | Is significantly affected | Geckos30,93,104 | Spiders,105 beetles,51 no effect in stick insects52 | Yes | Yes | In most cases, attachment forces increased with humidity. |
| Treat pads with solvents/alcohol | Attachment performance is reduced | Geckosa | Bugs,18 flies8 | ? | Yes | Influence on stiffness? |
| Attachment performance on surfaces flooded with water | Is significantly affected | Geckos106 | Tree frogs,4,95 ants107 | Yes | Yes | Effect depends on the surface energies of the involved materials. |
| Attachment performance on smooth surfaces with different normal (pre-)loads | No significant effect for adhesive pads | Geckos108 | Stick insects,50,52,109 beetles109 | Yes | ? | The range of loads was small, and effects were found when fluid was accumulated.52 |
| Adhesion dependent on shear force applied during detachment | Increases when pulled, decreases when pushed | Geckos94,100 | Stick insects,50 beetles & cockroaches,81 tree frogs95 | Yes | ? | For geckos, it is still unclear whether the relationship is independent of contact area. |
| Contact time before detachment | Adhesion increases with contact time | — | Stick insects110 | Yes | Yes | |
| Test for static friction | Present, smaller than dynamic friction | Chameleons,111 geckos13 | Ants,21,23 stick insects,52 tree frogs,24 spiders13 | ? | ? | The transition to sliding is significantly altered if ‘dry’ materials are microstructured.112,113 For ‘wet’ hairy pads, surface tension may give rise to considerable static shear stress even for Newtonian fluids.81 |
| Perform repeated slides on the same position | Friction and adhesion decrease | Geckosa | Stick insects,52,109 beetles109 | ? | Yes | Soft, ‘rubbery’ polymers have been shown to leave residues behind, affecting their adhesive performance in repeated trials on the same spot.72 |
| Perform repeated slides/pull-offs on new positions with high frequency | Friction and adhesion increase | Geckosb | Stick insects,52,109 beetles109 | ? | Yes | The effect is reversed when experiments are performed on a rough surface.52 |
| Attachment performance on substrates with different surface energy | Mixed reports, but generally small or no effects | Geckos106,114 | Tree frogs,4 beetles,11,115–119 aphids,19 cockroaches120 | ? | ? | A comparison to theoretical predictions requires the estimation of unknown parameters, and the use of simplified models. |
| Attachment performance after pad contamination | Pads lose & then regain attachment ability | Geckos121 | Beetles & stick insects,122 tree frogs123 | — | — | Recovery rates appear to be higher for ‘wet’ pads.122 |
The mechanism of attachment in ‘wet’ adhesive pads
Previous authors have discussed a ‘wet adhesion model’ for adhesive pads of tree frogs and insects, where static capillary forces are combined with dynamic forces contributed by the fluid's viscosity.4,16,20,25 Following this idea for a ‘wet’ sphere yields59,73 | (4) |
 | (5) |
The ‘dry’ model (eqn (2)) also has a rate-independent (G0) and a rate-dependent (G0(vc/v*)n) term. We found that the adhesive forces measured at low and high retraction speeds during ‘depletion’ differed by a factor of 3.47 (95% CI 1.39–5.54) for the first step and by a factor of 2.2 (95% CI 1.44–2.95) for the last step. For the ‘dry’ model, the ratio between the adhesive forces measured at different retraction speeds should be independent of fluid depletion (‘step number’). The mean crack propagation speeds measured during the depletion experiments, vc,1000 = 676 μm s−1 and vc,50 = 47 μm s−1, as well as v* = 136 μm s−1 and n = 0.49, yield a ratio of κ = P(vc,1000)/P(vc,50) ≈ 2 between the forces measured at a retraction speed of 1000 and 50 μm s−1, not significantly different from the ratios observed for the first and the last step (t-test, t9 = 1.5, p = 0.16 and t9 = 0.35, p = 0.73, respectively). Thus, the rate-dependent contribution predicted by the fracture mechanics model is small enough to be consistent with the absence of a measurable interaction.
Remarkably, modelling ‘wet’ adhesive pads as ‘dry’ elastomers can also account for the shear stress generated by insect pads, which is at least one order of magnitude too large to be explained by hydrodynamic lubrication.21,23,52,79,80 Friction of soft materials is dominated by adhesive forces,81 and their contribution to the shear stress σ can be linked to the difference between the energy required to break and form interfacial bonds (corresponding to an advancing or a receding crack), GA and GR, respectively.82,83GR is approximately G0, while GA depends on the crack propagation speed. Eqn (2) yields
 | (6) |
The previous discussion suggests that the rate-dependence of ‘wet’ adhesive pads is akin to that of ‘dry’ elastomers, and our data are consistent with a simple model based on fracture mechanics. Fracture mechanics provide a simple yet powerful theoretical framework for the quantitative study of biological adhesives, and can explain a number of performance characteristics of insect pads which are quantitatively inconsistent with simple predictions for ‘wet’ adhesive contacts. Thus, the secretion does not appear to behave like a Newtonian ‘bulk’ fluid,21,52,80 and indeed it has been argued that it may be ‘semi-solid’ at ambient temperatures.86 Based on these observations, we suggest that the viscosity of the pad secretion does not contribute significantly to adhesion and friction forces in insects. Instead, stick insects may attach via weak non-covalent forces between the pad and the surface, as is the case for the ‘dry’ adhesive pads of geckos. What, then, is the functional significance of the secretion, and how does the performance of ‘wet’ pads differ from that of ‘dry’ biological pads?
The function of the fluid and the difference between ‘wet’ and ‘dry’ biological adhesives
We investigated functional differences between ‘wet’ and ‘dry’ adhesive systems by conducting a literature survey summarising experimental treatments and their impact on the pads' performance (Table 3). The summary clearly shows that the performance of ‘wet’ and ‘dry’ adhesive systems is strikingly similar. Nevertheless, the published interpretations of these findings often invoked explanations specific to ‘wet’ or ‘dry’ contacts. For example, Emerson and Diehl4 observed that the adhesive performance of tree frogs on glass decreased significantly when the pads were immersed in water, and concluded that attachment is aided by capillary forces. However, a significant reduction in attachment performance has also been reported for the friction of ‘dry’ gecko pads on hydrophilic surfaces immersed in water.87 Given that dynamic biological attachment pads face similar functional requirements, it comes as no surprise that similar experimental treatments have similar effects. However, the implication of this finding is that it is surprisingly hard, if not impossible, to draw reliable conclusions on the physical mechanisms underlying attachment from such experiments, at least if they are not conducted in a rigorous comparative manner. The key problem is that the attachment performance of soft, rubbery materials has similar characteristics as that of ‘wet’ contacts. Thus far, we are not aware of a single experiment which has yielded a qualitatively different result for ‘dry’ vs. ‘wet’ adhesive pads. Clearly, the physical attachment mechanisms of both types of pads are either identical, or cannot be distinguished with the available information.However, this conclusion does not preclude a functional importance of the pad secretion as such. For example, the pad secretion may help to fill in small gaps on rough surfaces, thereby increasing contact area and thus adhesion.52 Other experiments revealed a significant drop in attachment performance when pads were washed with solvents, likely resulting in a removal of the secretion (see Table 3). Notably, the entire body of insects is covered with a thin lipid layer, and comparative analyses between the pad secretion and samples taken from the other parts of the insects' body have not revealed any significant qualitative differences in chemical composition.79,86,88–90 It appears plausible that this chemical congruence implies that the lipid secretion has a similar function in the pads as in the rest of the body.14 The key function of the whole-body lipid coverage is to avoid evaporation, a crucial issue for small animals with large surface-to-volume ratios, and removal of the lipid layer likely compromises this protective function. The subsequent reduction of the water content of the soft pad cuticle likely increases its stiffness,91,92 providing a possible explanation for the observed drop in performance. Strikingly, geckos may face a similar problem, as the stiffness of β-keratin is also controlled by hydration.93
Our results suggest that another function of the secretion may be to serve as a lubricating separation layer, reducing adhesion and in particular its rate-dependence. An adaptation that serves to reduce adhesion may be explained by the functional requirement to combine strong attachment with rapid and effortless detachment. There is ample evidence that adhesion is controlled via shear forces, in ‘dry’, ‘wet’, ‘hairy’ and ‘smooth’ systems,50,81,94,95 but the details of this mechanism remain unclear. Our results clearly show that shear forces exhibit a much larger effect on adhesion than retraction speed, and thus are likely the main tool for the modulation of surface attachment during locomotion.81 Thus, attachment forces in the absence of shear can or even should be negligible to allow effortless detachment. Interestingly, a highly mobile interfacial layer may help to decrease attachment forces during purely normal separation, but may increase attachment forces via interfacial slippage when pads are simultaneously sheared.96–99 Gravish et al.100 suggested that the shear-sensitivity of gecko pads is caused by significant energy dissipation via frictional sliding, and in insects, the presence of a thin interfacial layer may help to ensure that interfacial slippage occurs before the stress concentrations close to the crack tip are sufficient to advance the crack when pads are pulled off and sheared simultaneously. Remarkably, gecko pads leave tiny amounts of phospholipid ‘footprints’,101 which might also function as a lubricating separation layer as in arthropods. Clearly, comparative studies on the presence and role of thin lipid layers for the material properties and shear-sensitivity of adhesive pads in geckos, insects, and spiders are required to study the above mechanisms in more detail, and to improve our understanding of the design and function of biological adhesive pads.
Acknowledgements
D.L. thanks U. Abusomwan for pointing out some helpful literature. Both authors are grateful to M.Y. Strücker for her help with the synchronised force measurements, and the recordings at a retraction speed of 1 μm s−1. Two anonymous reviewers helped to improve this manuscript with their suggestions. This study was supported by research grants from the Cusanuswerk (to D.L.), as well as the Biotechnology and Biological Sciences Research Council (BB/I008667/1) and the Human Frontier Science Programme (RGP0034/2012) to W.F.References
- J. Gillett and V. Wigglesworth, Proc. R. Soc. B, 1932, 111, 364–376 CrossRef.
- M. D. Kendall, Z. Zellforsch. Mikrosk. Anat., 1970, 109, 112–137 CrossRef CAS PubMed.
- V. V. Ernst, Tissue Cell, 1973, 5, 97–104 CrossRef CAS PubMed.
- S. Emerson and D. Diehl, Biol. J. Linn. Soc., 1980, 13, 199–216 CrossRef.
- A. Ghazi-Bayat and I. Hasenfuss, Zool. Anz., 1980, 204, 13–18 Search PubMed.
- D. M. Green, Copeia, 1981, 1981, 790–796 CrossRef.
- N. Stork, J. Nat. Hist., 1983, 17, 583–597 CrossRef.
- G. Walker, A. B. Yulf and J. Ratcliffe, J. Zool., 1985, 205, 297–307 CrossRef.
- A. D. Lees and J. Hardie, J. Exp. Biol., 1988, 136, 209–228 Search PubMed.
- S. Gorb, Proc. R. Soc. London, 1998, 265, 747–752 CrossRef.
- T. Eisner and D. Aneshansley, Proc. Natl. Acad. Sci. U. S. A., 2000, 97, 6568–6573 CrossRef CAS.
- J. M. Smith, J. W. Barnes, J. Downie and G. Ruxton, J. Zool., 2006, 270, 372–383 Search PubMed.
- A. M. Peattie, J.-H. Dirks, S. Henriques and W. Federle, PLoS One, 2011, 6, e20485 CrossRef CAS PubMed.
- O. Betz, Biological Adhesive Systems, Springer, 2010, pp. 111–152 Search PubMed.
- J.-H. Dirks and W. Federle, Soft Matter, 2011, 7, 11047–11053 RSC.
- J.-H. Dirks, Beilstein J. Nanotechnol., 2014, 5, 1160–1166 CrossRef CAS PubMed.
- L. Roth and E. Willis, J. Exp. Zool., 1952, 119, 483–517 CrossRef.
- J. Edwards and M. Tarkanian, Proc. R. Entomol. Soc., 1970, 45, 1–5 Search PubMed.
- A. F. G. Dixon, P. Croghan and R. Gowing, J. Exp. Biol., 1990, 152, 243–253 Search PubMed.
- G. Hanna and J. W. Barnes, J. Exp. Biol., 1991, 155, 103–125 Search PubMed.
- W. Federle, M. Riehle, A. S. Curtis and R. Full, Integr. Comp. Biol., 2002, 42, 1100–1106 CrossRef PubMed.
- W. Vötsch, G. Nicholson, R. Müller, Y. D. Stierhof, S. Gorb and U. Schwarz, Insect Biochem. Mol. Biol., 2002, 32, 1605–1613 CrossRef.
- W. Federle, W. Baumgartner and B. Hölldobler, J. Exp. Biol., 2004, 206, 67–74 CrossRef.
- W. Federle, J. W. Barnes, W. Baumgartner, P. Drechsler and J. M. Smith, J. R. Soc., Interface, 2006, 3, 689–697 CrossRef CAS PubMed.
- J. W. Barnes, MRS Bull., 2007, 32, 479–485 CrossRef.
- S. F. Geiselhardt, W. Federle, B. Prüm, S. Geiselhardt, S. Lamm and K. Peschke, J. Insect Physiol., 2009, 56, 398–404 CrossRef PubMed.
- B. Abou, C. Gay, B. Laurent, O. Cardoso, D. Voigt, H. Peisker and S. Gorb, J. R. Soc., Interface, 2010, 7, 1745–1752 CrossRef PubMed.
- H. Peisker, L. Heepe, A. E. Kovalev and S. N. Gorb, J. R. Soc., Interface, 2014, 11, 20140752 CrossRef PubMed.
- S. Gorb, Y. Jiao and M. Scherge, J. Comp. Physiol., A, 2000, 186, 821–831 CrossRef CAS.
- J. Puthoff, M. Prowse, M. Wilkinson and K. Autumn, J. Exp. Biol., 2010, 213, 3699–3704 CrossRef PubMed.
- J. W. Barnes, P. Goodwyn, M. Nokhbatolfoghahai and S. Gorb, J. Comp. Physiol., A, 2011, 197, 969–978 CrossRef PubMed.
- J. Puthoff, M. Holbrook, M. Wilkinson, K. Jin, N. Pesika and K. Autumn, Soft Matter, 2013, 9, 4855–4863 RSC.
- C. Gay, Int. Comp. Biol., 2002, 42, 1123–1126 CrossRef PubMed.
- C. Creton and P. Fabre, Adhesion science and engineering, Elsevier, Amsterdam, 2002, vol. 1, pp. 535–576 Search PubMed.
- C. Creton, MRS Bull., 2003, 28, 434–439 CrossRef CAS.
- M. Barquins and D. Maugis, J. Adhes., 1981, 13, 53–65 CrossRef CAS.
- K. R. Shull, Mat. Sci. Eng., R, 2002, 36, 1–45 CrossRef.
- H. Müller and W. G. Knauss, J. Appl. Mech., 1971, 38, 483–488 CrossRef.
- A. Gent and J. Schultz, J. Adhes., 1972, 3, 281–294 CrossRef CAS.
- E. H. Andrews and A. J. Kinloch, Proc. R. Soc. London, Ser. A, 1973, 332, 385–399 CrossRef CAS.
- D. Maugis and M. Barquins, J. Phys. D: Appl. Phys., 1978, 11, 1989–2023 CrossRef.
- A. Gent, Langmuir, 1996, 12, 4492–4496 CrossRef CAS.
- D. Ahn and K. R. Shull, Langmuir, 1998, 14, 3637–3645 CrossRef CAS.
- D. Ahn and K. R. Shull, Langmuir, 1998, 14, 3646–3654 CrossRef CAS.
- A. J. Crosby and K. R. Shull, J. Polym. Sci., Part B: Polym. Phys., 1999, 37, 3455–3472 CrossRef CAS.
- U. Abusomwan and M. Sitti, Appl. Phys. Lett., 2012, 101, 211907 CrossRef.
- K. Kendall, J. Phys. D: Appl. Phys., 1971, 4, 1186–1195 CrossRef.
- R. Rivlin, Paint Technol., 1944, 9, 215–216 Search PubMed.
- K. Johnson, K. Kendall and A. Roberts, Proc. R. Soc. London, Ser. A, 1971, 324, 301–313 CrossRef CAS.
- D. Labonte and W. Federle, PLoS One, 2013, 8, e81943 CrossRef PubMed.
- D. Voigt, J. Schuppert, S. Dattinger and S. Gorb, J. Zool., 2010, 281, 227–231 Search PubMed.
- P. Drechsler and W. Federle, J. Comp. Physiol., A, 2006, 192, 1213–1222 CrossRef PubMed.
- J.-H. Dirks and W. Federle, J. R. Soc., Interface, 2011, 8, 952–960 CrossRef PubMed.
- J. Schindelin, I. Arganda-Carreras, E. Frise, V. Kaynig, M. Longair, T. Pietzsch, S. Preibisch, C. Rueden, S. Saalfeld and B. Schmid, Nat. Methods, 2012, 9, 676–682 CrossRef CAS PubMed.
- L. Huang and M. Wang, Pattern Recognit., 1995, 28, 41–51 CrossRef.
- R Development Core Team, R: A Language and Environment for Statistical Computing, R Foundation for Statistical Computing, Vienna, Austria, 2013 Search PubMed.
- I. Scholz, W. Baumgartner and W. Federle, J. Comp. Physiol., A, 2008, 194, 373–384 CrossRef PubMed.
- B. Lorenz, B. Krick, N. Mulakaluri, M. Smolyakova, S. Dieluweit, W. Sawyer and B. Persson, J. Phys.: Condens. Matter, 2013, 25, 225004 CrossRef CAS PubMed.
- A. Fogden and L. R. White, J. Colloid Interface Sci., 1990, 138, 414–430 CrossRef CAS.
- X. Feng, M. A. Meitl, A. M. Bowen, Y. Huang, R. G. Nuzzo and J. A. Rogers, Langmuir, 2007, 23, 12555–12560 CrossRef CAS PubMed.
- J. Greenwood and K. Johnson, Philos. Mag., 1981, 43, 697–711 CrossRef CAS.
- B. Persson and E. Brener, Phys. Rev. E: Stat., Nonlinear, Soft Matter Phys., 2005, 71, 036123 CrossRef CAS PubMed.
- C.-Y. Hui, A. Jagota, S. Bennison and J. Londono, Proc. R. Soc. London, Ser. A, 2003, 459, 1489–1516 CrossRef.
- C. Creton and H. Lakrout, J. Polym. Sci., Part B: Polym. Phys., 2000, 38, 965–979 CrossRef CAS.
- A. J. Crosby, K. R. Shull, H. Lakrout and C. Creton, J. Appl. Phys., 2000, 88, 2956–2966 CrossRef CAS.
- C. Creton, J. Hooker and K. R. Shull, Langmuir, 2001, 17, 4948–4954 CrossRef CAS.
- M. Bennemann, I. Scholz and W. Baumgartner, Bioinspiration, Biomimetics, and Bioreplication, an Diego, California, USA, 2011, p. 79751A-8 Search PubMed.
- M. Bennemann, S. Backhaus, I. Scholz, D. Park, J. Mayer and W. Baumgartner, J. Exp. Biol., 2014, 217, 3677–3687 CrossRef PubMed.
- D. Ahn and K. R. Shull, Macromolecules, 1996, 29, 4381–4390 CrossRef CAS.
- K. R. Shull, D. Ahn, W.-L. Chen, C. M. Flanigan and A. J. Crosby, Macromol. Chem. Phys., 1998, 199, 489–511 CrossRef CAS.
- F. D. Blum, B. C. Gandhi, D. Forciniti and L. R. Dharani, Macromolecules, 2005, 38, 481–487 CrossRef CAS.
- E. Kroner, R. Maboudian and E. Arzt, Adv. Eng. Mater., 2010, 12, 398–404 CrossRef CAS.
- B. Francis and R. G. Horn, J. Appl. Phys., 2001, 89, 4167–4174 CrossRef CAS.
- S. Cai and B. Bhushan, Mater. Sci. Eng., R, 2008, 61, 78–106 CrossRef.
- S. Leroy and E. Charlaix, J. Fluid Mech., 2011, 674, 389–407 CrossRef CAS.
- R. Villey, E. Martinot, C. Cottin-Bizonne, M. Phaner-Goutorbe, L. Léger, F. Restagno and E. Charlaix, Phys. Rev. Lett., 2013, 111, 215701 CrossRef PubMed.
- N. Stork, Antenna, 1983, 7, 20–23 Search PubMed.
- W. Federle, J. Exp. Biol., 2006, 209, 2611–2621 CrossRef PubMed.
- S. F. Geiselhardt, S. Geiselhardt and K. Peschke, Chemoecology, 2009, 19, 185–193 CrossRef CAS.
- J. Dirks, C. Clemente and W. Federle, J. R. Soc., Interface, 2010, 7, 587–593 CrossRef PubMed.
- D. Labonte and W. Federle, Philos. Trans. R. Soc., B, 2015, 370, 20140027 CrossRef PubMed.
- H. Yoshizawa, Y. L. Chen and J. Israelachvili, J. Phys. Chem., 1993, 97, 4128–4140 CrossRef CAS.
- M. Heuberger, G. Luengo and J. Israelachvili, J. Phys. Chem. B, 1999, 103, 10127–10135 CrossRef CAS.
- N. Chen, N. Maeda, M. Tirrell and J. Israelachvili, Macromolecules, 2005, 38, 3491–3503 CrossRef CAS.
- K. Grosch, Proc. R. Soc. London, Ser. A, 1963, 274, 21–39 CrossRef CAS.
- M. Reitz, H. Gerhardt, C. Schmitt, O. Betz, K. Albert and M. Lämmerhofer, Anal. Chim. Acta, 2015, 854, 47–60 CrossRef CAS PubMed.
- A. Y. Stark, T. W. Sullivan and P. H. Niewiarowski, J. Exp. Biol., 2012, 215, 3080–3086 CrossRef PubMed.
- A. Kosaki and R. Yamaoka, Jpn. J. Appl. Entomol. Zool., 1996, 40, 47–53 CrossRef CAS.
- O. Betz, J. Morphol., 2003, 255, 24–43 CrossRef PubMed.
- S. Geiselhardt, S. Geiselhardt and K. Peschke, Chemoecology, 2011, 21, 181–186 CrossRef CAS.
- J. F. Vincent and U. G. Wegst, Arthropod Struct. Dev., 2004, 33, 187–199 CrossRef PubMed.
- D. Klocke and H. Schmitz, Acta Biomater., 2011, 7, 2935–2942 CrossRef PubMed.
- M. Prowse, M. Wilkinson, J. Puthoff, G. Mayer and K. Autumn, Acta Biomater., 2011, 7, 733–738 CrossRef PubMed.
- K. Autumn, A. Dittmore, D. Santos, M. Spenko and M. Cutkosky, J. Exp. Biol., 2006, 209, 3569–3579 CrossRef CAS PubMed.
- T. Endlein, A. Ji, D. Samuel, N. Yao, Z. Wang, W. J. P. Barnes, W. Federle, M. Kappl and Z. Dai, J. R. Soc., Interface, 2013, 10, 20120838 CrossRef PubMed.
- B. Newby, M. Chaudhury and H. Brown, Science, 1995, 269, 1407–1409 CrossRef CAS PubMed.
- B. Newby and M. Chaudhury, Langmuir, 1998, 14, 4865–4872 CrossRef.
- A. Ghatak, K. Vorvolakos, H. She, D. L. Malotky and M. K. Chaudhury, J. Phys. Chem. B, 2000, 104, 4018–4030 CrossRef CAS.
- R. R. Collino, N. R. Philips, M. N. Rossol, R. M. McMeeking and M. R. Begley, J. R. Soc., Interface, 2014, 11, 20140453 CrossRef PubMed.
- N. Gravish, M. Wilkinson and K. Autumn, J. R. Soc., Interface, 2008, 5, 339–348 CrossRef PubMed.
- P. Y. Hsu, L. Ge, X. Li, A. Y. Stark, C. Wesdemiotis, P. H. Niewiarowski and A. Dhinojwala, J. R. Soc., Interface, 2011, 9, 657–664 CrossRef PubMed.
- N. Gravish, M. Wilkinson, S. Sponberg, A. Parness, N. Esparza, D. Soto, T. Yamaguchi, M. Broide, M. Cutkosky, C. Creton and K. Autumn, J. R. Soc., Interface, 2010, 7, 259–269 CrossRef PubMed.
- P. H. Niewiarowski, S. Lopez, L. Ge, E. Hagan and A. Dhinojwala, PLoS One, 2008, 3, e2192 CrossRef PubMed.
- G. Huber, H. Mantz, R. Spolenak, K. Mecke, K. Jacobs, S. N. Gorb and E. Arzt, Proc. Natl. Acad. Sci. U. S. A., 2005, 102, 16293–16296 CrossRef CAS PubMed.
- J. O. Wolff and S. N. Gorb, Proc. R. Soc. B, 2011, 279, 139–143 CrossRef PubMed.
- A. Y. Stark, I. Badge, N. A. Wucinich, T. W. Sullivan, P. H. Niewiarowski and A. Dhinojwala, Proc. Natl. Acad. Sci. U. S. A., 2013, 110, 6340–6345 CrossRef CAS PubMed.
- M. Scharmann, MSc thesis, Julius-Maximilians-Universität Würzburg, 2011.
- K. Autumn, Y. Liang, S. Hsieh, W. Zesch, W. Chan, T. Kenny, R. Fearing and R. Full, Nature, 2000, 405, 681–685 CrossRef CAS PubMed.
- J. M. R. Bullock, P. Drechsler and W. Federle, J. Exp. Biol., 2008, 211, 3333–3343 CrossRef PubMed.
- P. Drechsler, PhD thesis, Julius-Maximilians-Universität Würzburg, 2008.
- M. Spinner, G. Westhoff and S. N. Gorb, Sci. Rep., 2014, 4, 5481 CrossRef CAS PubMed.
- M. Varenberg and S. N. Gorb, Adv. Mater., 2009, 21, 483–486 CrossRef CAS.
- B. Lorenz and B. Persson, J. Phys.: Condens. Matter, 2012, 24, 225008 CrossRef CAS PubMed.
- K. Autumn, M. Sitti, Y. A. Liang, A. M. Peattie, W. R. Hansen, S. Sponberg, T. W. Kenny, R. Fearing, J. N. Israelachvili and R. J. Full, Proc. Natl. Acad. Sci. U. S. A., 2002, 99, 12252–12256 CrossRef CAS PubMed.
- N. Stork, Zool. J. Linn. Soc., 1980, 68, 173–306 CrossRef.
- S. N. Gorb, R. G. Beutel, E. V. Gorb, Y. Jiao, V. Kastner, S. Niederegger, V. L. Popov, M. Scherge, U. Schwarz and W. Vötsch, Integr. Comp. Biol., 2002, 42, 1127–1139 CrossRef PubMed.
- E. Gorb and S. Gorb, Entomol. Exp. Appl., 2009, 130, 222–228 CrossRef.
- J. M. R. Bullock, PhD thesis, University of Cambridge, 2010.
- B. Prüm, H. Florian Bohn, R. Seidel, S. Rubach and T. Speck, Acta Biomater., 2013, 9, 6360–6368 CrossRef PubMed.
- A. Casteren and J. Codd, J. Insect Sci., 2010, 10, 1–12 CrossRef PubMed.
- W. Hansen and K. Autumn, Proc. Natl. Acad. Sci. U. S. A., 2005, 102, 385–389 CrossRef CAS PubMed.
- C. J. Clemente, J. M. R. Bullock, A. Beale and W. Federle, J. Exp. Biol., 2010, 213, 635–642 CrossRef PubMed.
- N. Crawford, T. Endlein and W. J. P. Barnes, J. Exp. Biol., 2012, 215, 3965–3972 CrossRef PubMed.
Footnotes |
| † Electronic supplementary information (ESI) available. See DOI: 10.1039/c5sm01496d |
| ‡ A Birn-Jefferey, unpublished data. |
| § Here, we assumed that h is small compared to the total height of the meniscus, i.e. the sphere is very close to the surface.74 |
| This journal is © The Royal Society of Chemistry 2015 |