
 Open Access Article
 This Open Access Article is licensed under a Creative Commons Attribution-Non Commercial 3.0 Unported Licence
Metal oxidation states in biological water splitting†
Vera
Krewald
a,
Marius
Retegan
a,
Nicholas
Cox
a,
Johannes
Messinger
b,
Wolfgang
Lubitz
a,
Serena
DeBeer
a,
Frank
Neese
a and
Dimitrios A.
Pantazis
*a
aMax Planck Institute for Chemical Energy Conversion, Stiftstr. 34-38, 45470 Mülheim an der Ruhr, Germany. E-mail: dimitrios.pantazis@cec.mpg.de
bDepartment of Chemistry, Chemical Biological Center (KBC), Umeå University, 90187 Umeå, Sweden
First published on 9th January 2015
Abstract
A central question in biological water splitting concerns the oxidation states of the manganese ions that comprise the oxygen-evolving complex of photosystem II. Understanding the nature and order of oxidation events that occur during the catalytic cycle of five Si states (i = 0–4) is of fundamental importance both for the natural system and for artificial water oxidation catalysts. Despite the widespread adoption of the so-called “high-valent scheme”—where, for example, the Mn oxidation states in the S2 state are assigned as III, IV, IV, IV—the competing “low-valent scheme” that differs by a total of two metal unpaired electrons (i.e. III, III, III, IV in the S2 state) is favored by several recent studies for the biological catalyst. The question of the correct oxidation state assignment is addressed here by a detailed computational comparison of the two schemes using a common structural platform and theoretical approach. Models based on crystallographic constraints were constructed for all conceivable oxidation state assignments in the four (semi)stable S states of the oxygen evolving complex, sampling various protonation levels and patterns to ensure comprehensive coverage. The models are evaluated with respect to their geometric, energetic, electronic, and spectroscopic properties against available experimental EXAFS, XFEL-XRD, EPR, ENDOR and Mn K pre-edge XANES data. New 2.5 K 55Mn ENDOR data of the S2 state are also reported. Our results conclusively show that the entire S state phenomenology can only be accommodated within the high-valent scheme by adopting a single motif and protonation pattern that progresses smoothly from S0 (III, III, III, IV) to S3 (IV, IV, IV, IV), satisfying all experimental constraints and reproducing all observables. By contrast, it was impossible to construct a consistent cycle based on the low-valent scheme for all S states. Instead, the low-valent models developed here may provide new insight into the over-reduced S states and the states involved in the assembly of the catalytically active water oxidizing cluster.
Introduction
Large-scale water splitting using earth-abundant transition metal catalytic systems is a central component of every solar fuel scenario that proposes artificial photosynthesis as the basis for future energy security on a global scale.1–3 Despite progress on synthetic systems,4–7 a realistic candidate for a robust artificial water oxidation catalyst on an industrial scale has yet to emerge. Thus, the natural water oxidizing system, the membrane–bound protein complex photosystem II (PSII) of plants, algae, and cyanobacteria, remains an invaluable source of information and inspiration, being a unique example of highly efficient light-driven water splitting. The oxygen evolving complex (OEC) of PSII contains a catalytically active oxo-bridged Mn4Ca cluster that stores the four oxidizing equivalents required to oxidize water into dioxygen.8–12 During catalysis the OEC passes through five oxidation states Si of the Kok cycle,13,14 where i = 0–4 denotes the number of oxidizing equivalents stored in each step (Fig. 1). The S2 and S3 states are metastable and decay eventually to the dark-stable S1 state, whereas S4 is a transient state that releases dioxygen and decays to S0. Although the Kok cycle rationalizes the period-four oscillation of flash-induced oxygen evolution via the sequential accumulation of four oxidizing equivalents, it does not place restrictions on the absolute oxidation states of the individual Mn ions and the protonation states of oxygen ligands that comprise the inorganic cluster. Although these latter questions are of fundamental importance for understanding the function of the natural system and for establishing the principles for the rational design of synthetic water splitting systems, they have remained contentious even after decades of intense research.8,12,15 | ||
| Fig. 1 (Left) The Kok cycle of S states, indicating the oxidation and proton release events at each transition. (Right) The possible formal oxidation states of the four manganese ions of the OEC in the S0–S3 states according to the high-valent and low-valent schemes. | ||
Historically, two competing schemes have been developed to describe the sequence of the Mn oxidation events within the catalytic cycle. They initially evolved from electron paramagnetic resonance (EPR) spectroscopy, which demonstrated that the S2 state EPR multiline signal, which represents a total effective S = 1/2 spin ground state, is formed by the magnetic coupling of Mn(III) and Mn(IV) ions.16–22 Since the OEC contains four Mn ions, this leads to two equally reasonable oxidation state assignments for the S2 state that differ by two in their total valence electron count, Mn(III)3Mn(IV) and Mn(III)Mn(IV)3.18 As it is known from EPR and X-ray spectroscopy studies that the relative oxidation level of the OEC tracks the oxidation events of the catalytic cycle,17,23–27 these two possible oxidation state distributions for the S2 state can be extended to all other S states. The two resulting schemes (Fig. 1) are usually referred to in the literature15,28 as the low and high oxidation state paradigms or the low-valent (LV) and high-valent (HV) schemes. Although EPR results by different groups have been interpreted in support of either the LV29,30 or the HV schemes,31–34 unambiguous assignments of the ground state spin multiplicity35 of all Si states have been made: S = 1/2 (S0),36–39S = 0 (S1),40,41S = 1/2 and 5/2 (S2, g = 2 and g ≥ 4.1 signals),16,42,43 and S = 3 (S3),44–46 and these studies often provide information on low-lying excited states.
Experimental approaches used to establish the absolute Mn oxidation states of the OEC fall broadly into four categories: (i) photoassembly studies of the functional cluster starting from Mn(II), (ii) treatments that involve reduction of the OEC and study of the super-reduced states or titration of released Mn(II), (iii) experiments focusing on the kinetics of 18O exchange, and (iv) spectroscopic studies that probe the geometric and electronic structure of the functional enzyme. Divergent conclusions have been reached from the above approaches. For example, by determining the number of light flashes required to construct the functional O2-releasing OEC from apo-OEC-PSII and Mn(II), the LV scheme was favored.47–49 However, studies determining the amount of reductant required to disassemble a specific S state with concurrent titration of released Mn(II)50 or probing the reduced S states, instead support the HV Mn(III)2Mn(IV)2 assignment for the S1 state.51 H216O/H218O substrate water exchange experiments52–54 have been interpreted in favor of both the LV scheme15,55 and the HV scheme.56,57 It is noted that the connection between water exchange rates and Mn coordination geometries or oxidation states remains ambiguous for the OEC.
X-ray spectroscopies17,58,59 provide complementary electronic structure information to that obtained by EPR, from the near-edge region of the metal K-edge X-ray absorption spectrum (XANES, X-ray absorption near edge spectroscopy). They also provide geometric structure information, i.e. metal–ligand and metal–metal separations and coordination numbers from the EXAFS region (extended X-ray absorption fine structure). Oxidation states have been inferred from XANES spectra via calibration against model compounds. All experimental groups have concluded that their data provide support for the HV scheme,24,26,27,60–62 but a subsequent report has reinterpreted these data to be in better agreement with the LV scheme.28 For the experimentally based evaluation of S state dependent changes, ambiguities exist on how to best determine the edge position.24,61,62 These uncertainties originate in part from the dependence of the XANES spectral shape on ligand type and coordination environment. Nevertheless, a consensus exists among the EXAFS groups that a Mn-centered oxidation take place in both the S0–S1 and S1–S2 transitions (see however ref. 63). For the S2–S3 transition both a ligand-centered oxidation24,27,64,65 and a Mn-centered oxidation23,61,62,66 are supported by different groups. The use of X-ray emission spectroscopy (XES) has been rather limited, but the available data on Mn Kβ main lines has been interpreted as being consistent with the HV assignment in the S1 state.24
Computationally, various S state models of the OEC have been studied in both the high67–103 and the low104–109 valent schemes. It is useful to distinguish between computational models compatible with the cluster nuclearity and connectivity of the crystallographic structure at 1.9 Å resolution,110 and those developed before this information was available; for example, some of the early LV models feature four oxo bridges instead of the five identified in the most recent crystal structure.110 The lower number of oxo bridges (four) favors a lower overall oxidation level.105 Although the 1.9 Å crystal structure clarifies the connectivity of the protein with the inorganic cluster, it features unusually long Mn–Mn and Mn–O bond lengths that are inconsistent with EXAFS data and indicate photoreduction of the Mn ions111,112 to oxidation states that are non-physiological within either the HV or the LV scheme.11,90,113 A recent landmark study by Suga et al.114 using femtosecond X-ray pulses from a free-electron laser (XFEL) provided a potentially radiation damage free 1.95 Å resolution structure of the OEC that agrees better with EXAFS. Overall, however, in view of the above considerations and the ability to provide state-specific structural information, EXAFS appears as the more reliable and useful dataset for intermetallic distances within the OEC at this time.62,115–121
Here, we aim to provide a comprehensive comparison of the two competing oxidation state schemes using a common structural framework and methodological approach. Large computational models were constructed for all stable S states (S0–S3) in both the HV and the LV schemes and their properties were evaluated against experimental data on the geometry, electronic structure and spectroscopic properties of the OEC. The present work is built upon methods that have been extensively benchmarked and shown to always correctly predict the ground state spin multiplicities of spin-coupled manganese complexes, and to be highly discriminative for other spectroscopic parameters.122–127 Additionally, new 55Mn Davies ENDOR spectra obtained at 2.5 K are reported for the S2 state of the OEC. It is demonstrated that only the high-valent scheme leads to a formulation of the catalytic cycle that is consistent with spectroscopic observations for each individual S state, and internally consistent in terms of catalytic S state progression.
Methodology
Construction of models
Computational models are based on the protein pocket described in the XRD model of PSII at 1.9 Å resolution,110 which is practically identical with the 1.95 Å resolution XFEL model.114 The inorganic core is composed of four Mn ions and one Ca ion, oxo/hydroxo bridges and four water-derived ligands (see Fig. 2 for the labeling scheme employed). Amino acids directly coordinating Mn ions (from the D1 protein unless stated otherwise) are His332, Glu189, Asp342, Ala344, CP43-Glu354, Asp170, and Glu333. Second-sphere residues include His337 (H-bond with O3), CP43-Arg357, Asp61 (H-bond with the Mn4-bound W1), the redox-active Tyr161 (YZ), and His190. Eight crystallographic water molecules involved in hydrogen bonding are included (HOH IDs from the 3ARC PDB structure: 358, 428, 442, 446, 538, 539, 542, and 923). Specific interactions between the first and second coordination sphere are maintained by including the backbones of Ser169, Leu343, and part of Gly171. Sets of possible HV and LV models were optimized for each S state examining various proton distributions among titratable groups, varying the starting electronic structure to explore different oxidation state arrangements and Jahn–Teller axis orientations of the Mn(III) ions, testing alternative side chain rotations of non-coordinating residues, and, in the case of the S3 state, the inclusion of an additional water-derived ligand. | ||
| Fig. 2 The inorganic core of the OEC from the 2011 X-ray structure of PSII110 with parts of the protein environment that are included in the present models; hydrogen atoms and non-coordinating waters are omitted for clarity. The labeling conventions used in this work are indicated in the inset. | ||
Having already examined in detail93,94,97–99,102 the question of required second-sphere residues, we have identified two preconditions for the reliable development of models and the meaningful discussion of their properties: (i) regardless of the total size of a model, it is necessary to include all hydrogen-bonding interactions with first sphere ligands (e.g. with Asp61) to prevent errors in the prediction of protonation states and oxidation state distributions, and (ii) inclusion of the Tyr161–His190 pair is crucial in order to avoid geometric and electronic structure artifacts such as extensive rearrangement of water molecules around Ca2+, an energetic bias towards specific conformations of the inorganic core and changes of the intrinsic redox balance of this tightly coupled system.102
Screening criteria
In addition to an energy-based evaluation of the models, the ground state multiplicity of the intermediates is also used as an important experimental criterion (Table 1).35 Geometric evaluations are based on comparison with intermetallic EXAFS-derived distances. Over the past decade, a consistent picture of Mn–Mn distances has been reached by EXAFS,62,115–121 with three128 (or two in S0 to S2)62,129 short Mn–Mn distances of less than 2.8 Å in each S state and one (or two in S0 to S3)62,129 long Mn–Mn distance of ca. 3.3 Å. The long Mn–Mn distance is less well-resolved due to its overlap with two to four Mn–Ca vectors130–132 of similar length, so we only use the short Mn–Mn distances as a criterion for model discrimination (Table 1). As stressed above, comparison with crystallographic distances is not as informative because of photoreduction of the Mn ions in the 1.9 Å XRD structure.111,112 This is demonstrated by the recent 1.95 Å XFEL structure of the OEC,114 which is characterized as “radiation-damage-free” owing to the femtosecond duration of the pulses. It has two Mn–Mn distances close to 2.7 Å, one close to 2.9 Å, and a longer one at 3.2 Å in good agreement with the EXAFS data for the S1 state.| State | S | R Berkeley | R Berlin |
|---|---|---|---|
| S0 | 1/2 | 2.68, 2.77, 2.77 | 2.7, 2.8 |
| S1 | 0 | 2.71, 2.71, 2.79 | 2.7, 2.7 |
| S2 | 1/2, 5/2 | 2.74, 2.74, 2.74 | 2.69, 2.74 |
| S3 | 3 | 2.75, 2.75, 2.79 | 2.73, 2.73, <2.77 |
Similar sets of 55Mn hyperfine coupling constants (HFCs) for the S0 and S2 states have been reported by different groups.31,32,134 For the S3 state 55Mn HFCs were also obtained recently.46 These are presented in the corresponding sections (Tables 2 and 3). Selected models from each oxidation state scheme are also evaluated in terms of their Mn K pre-edge spectra, using the pre-edge region of published XAS spectra24 as a reference.
Computational details
All calculations were carried out with ORCA.135 Scalar relativistic effects were included with the ZORA Hamiltonian.136–139 For geometry optimizations the dispersion-corrected140 BP86 functional141,142 was used with ZORA-recontracted143 TZVP (Mn, Ca, O, N) and SVP (C, H) basis sets.144 Fully decontracted def2-TZVP/J auxiliary basis sets145 were used for the Coulomb density fitting approximation. Selective backbone constraints were applied (see Fig. S1†). The COSMO model with ε = 8 was used self-consistently in optimizations.146 Tight SCF convergence and increased angular and radial integration grids were used (“Grid6” and “IntAcc 6.0”, respectively, in ORCA nomenclature). Broken-symmetry (BS) calculations for the exchange coupling constants were performed with the TPSSh functional147 using the RIJCOSX approximation.148 Convergence to the correct determinant was confirmed by the atomic spin populations, which are always close to the ideal values for high-spin Mn ions (see ESI†). Singular value decomposition was used to determine the exchange coupling constants Jij, followed by diagonalization of the Heisenberg Hamiltonian to obtain the full spectrum of spin eigenstates. The methodology has been used successfully for many exchange-coupled Mn systems.46,92,94,97,122,123,125,127 In the ESI,† we provide results for additional calculations performed in the course of this work on synthetic complexes: in all reported examples of spin-coupled Mn complexes, the approach correctly predicts the ground state spin multiplicity.The lowest-energy BS determinant was used for calculating 55Mn hyperfine coupling constants, which were projected using previously described protocols.93,122 TPSSh calculations used increased radial integration grids for Mn centers. A complete mean-field approach was used for spin–orbit coupling; “picture-change” effects arising from the use of the scalar relativistic Hamiltonian were also included. Mn K pre-edge spectra were obtained with time-dependent DFT calculations within the Tamm–Dancoff approximation, using the TPSSh functional and def2-TZVP(-f) basis sets. The reference wave function was the lowest-energy BS solution. Other settings followed a recent calibration study.149 The donor space was constrained to Mn 1s orbitals and each donor ion was treated in a separate calculation of lowest 100 roots. The acceptor space contained all unoccupied orbitals. The calculated intensities include electric dipole, magnetic dipole and electric quadrupole excitations. To facilitate comparison with experiment, individual transitions were broadened by 1.5 eV and a shift of 36.3 eV was applied.149
EPR experimental details
The PSII core complex preparations were prepared from T. elongatus mutant which lacks the TyrD residue.150 The chlorophyll concentration was ca. 3 mg ml−1. The samples were placed in Q-band (1.6 mm I.D.) quartz tubes. After dark-adaption for one hour at room temperature, the samples were given one pre-flash using a YAG laser (532 nm) and again placed in the dark for one hour at room temperature. PpBQ (2-phenyl-p-benzoquinone) dissolved in DMSO (dimethyl sulfoxide) was then added to the tube (0.5 mM final concentration) and the sample was given one light flash using a YAG laser (532 nm) and immediately cooled in a dry ice/ethanol bath (200 K) and then into liquid nitrogen.Q-band pulse EPR and 55Mn-ENDOR measurements were performed at 2.5 K and 5.0 K using a Bruker ELEXSYS E580 Q-band pulse EPR spectrometer equipped with a home-build TE011 microwave resonator151 and a Cryogen Free Variable Temperature Cryostat from Cryogenic Ltd. Electron spin echo-detected (ESE) field-swept spectra were measured using the pulse sequence: tp–τ–2tp–τ–echo. The length of the π/2 microwave pulse was generally set to tp = 16 ns. The interpulse distance was set to τ = 260 ns. Electronic T*2 relaxation was assessed by monitoring the intensity of the EPR signal (echo) as a function of the interpulse distance τ. The decay of the EPR signal was approximately mono-exponential. 55Mn-ENDOR spectra were acquired using the Davies-type pulse sequence: Tinv–tRF–τ–tp–τ–2tp–τ–echo using an inversion microwave pulse of length tinv (32 ns, and a radio frequency (RF) π pulse of length tRF = 3.5–4.0 μs. The length of the π/2 microwave pulse in the detection sequence was generally set to tp = 16 ns and the interpulse delays to T = 1.5 μs and τ = 260 ns. The RF frequency was swept between 30–400 MHz.
Electronic longitudinal (T1) relaxation was assessed using two methods: (i) a Davies type three pulse sequence (tinv–T–tp–τ–2tp–τ–echo, i.e. inversion recovery); and (ii) a Mims type three pulse sequence (tp–τ–tp–T–tp–τ–echo, i.e. stimulated echo decay). For both methods the decay of the EPR signal (echo) is monitored as a function of the interpulse delay (T). The second pulse sequence has the advantage in that it monitors the decay of the EPR signal due to both the T1 relaxation and spectral diffusion i.e. T*1, both of which limit Davies ENDOR effect.152 The longitudinal decay of the EPR signal was approximately bi-exponential. A description of test measurements and calibration of the B2 (RF) field with a mixed valence bis-μ-pivalato-μ-hydroxo bridged MnIIMnIII model complex153 (“PivOH”) is given in the ESI.†
Results and discussion
In the presentation of models, we first discuss the spectroscopically best-characterized S2 state, for which new EPR data are also reported. Then we proceed to the next S state, the S3 state. Finally, having screened major structural and electronic possibilities, we move to the S1 and S0 states. Evaluation of models is based on the criteria specified in Section 2.2. To aid presentation and discussion of results, only a selected subset of models that were studied and screened for a given oxidation scheme and Si state are presented, along with their major isomeric forms.S2 state high-valent models
Computational high-valent S2-state models that are consistent with the most recent crystallographic model of PSII have been presented before, both as part of theoretically derived proposals for the water oxidation mechanism71,73,154 and as the basis for explaining and interpreting a range of spectroscopic and kinetic observations,72,91,92,94,97 including the effects of Ca2+/Sr2+ substitution95 and interaction with substrate analogs like NH3.98,100,155 Models of the same size, with the same amino acid residues and treated at the same level of theory, as the ones used in the present study can also explain the two interconvertible S2 state EPR signals at g = 2.0 and g ≥ 4.1.97 These models, represented here by the S2H-1a/b pair, have unprotonated oxo bridges, one terminal water in the form of H2O (W1) and one in the form of OH− (W2). These are designated as “three-proton models” because they have three protons distributed among the titratable groups O4, O5, W1 and W2. The lowest energy “open-cubane” isomer, S2H-1a, contains the unique Mn(III) ion at Mn1 and has a ground state spin of S = 1/2, whereas in the “closed-cubane” form S2H-1b, with an S = 5/2 ground state, the Mn(III) ion is positioned at Mn4. S2H-1a has very close correspondence to the most recent S2 state model proposed by Siegbahn (RMSD of the Mn positions from ref. 73 is only 0.040 Å), although the precise orientations of some first and second sphere amino acid residues differ between the models from that study and those presented by us here and previously.97,99 Most obvious are the different rotations of the imidazole ring planes of His332 and His337, which in the present models follow the orientations of the crystallographic model.110 Although rotation of these residues was shown to have only minor energetic effects on the computed mechanism,72 this is not the case for spectroscopic properties: as demonstrated recently, the orientation of His332, which is dictated by a hydrogen bonding interaction with the second-sphere Glu329 residue, has a large influence on the HFC of the Mn1 ion to which it is coordinated.99A previous theoretical study showed that protonated oxo bridges are inconsistent with measured 55Mn HFCs.94 This conclusion, corroborated by later studies focusing on different properties,156,157 is consistent with the absence of large proton couplings as assessed by 1H-ENDOR.158,159 Results presented here further support this thesis. Structures where O5 is protonated (S2H-3, see Fig. S4†) are destabilized by more than 16 kcal mol−1 relative to the isomeric form S2H-2a. However, models with a higher proton count exist in the literature78,82,84,89 and such “four-proton models” are also investigated here for completeness. When W1 = W2 = H2O (S2H-2a/b) the energy difference between the open and closed-cubane forms is the same as for the S2H-1 pair. All S2H models (Fig. 3) have similar metal–metal distances and are consistent with the three short and one long Mn–Mn distances derived from EXAFS.115,120
 | ||
| Fig. 3 Protonation patterns, oxidation states, Mn–Mn distances (Å), relative total energies (kcal mol−1), and ground spin states for the S2H models. Blue lines indicate the orientation of Jahn–Teller axes. The superscripts (3H+ and 4H+) indicate the total number of protons assigned to the groups W1, W2, O4, and O5, and serve to separate the models into isomer subsets for meaningful energy comparisons. | ||
Although S2H-2a exhibits the same desirable ground and first excited states (S = 1/2 and 3/2, respectively) and energy gap as S2H-1a, the corresponding closed cubane form S2H-2b has a ground state of maximum spin multiplicity (S = 13/2 instead of S = 5/2) because the antiferromagnetic exchange interaction between Mn3 and Mn4 (J34), is significantly diminished in S2H-2b as compared with S2H-1b (Table S1†). Since the four-proton S2H-2 models cannot fit both EPR signals of the S2 state, the S2H-1 couple with W2 = OH− remains the preferred description of the S2 state in the HV scheme.94,97
55Mn hyperfine coupling constants serve as an independent means to evaluate the proposed models. Due to the structural and electronic similarities between S2H-1a and S2H-2a, the HFCs for the models are similar in magnitude. As shown before for models of this type,92–95,99,100 the predicted 55Mn HFCs agree well with the experimental values (see Table 2).
| 55Mn |Aiso| | ||||
|---|---|---|---|---|
| S2H-1a | 295 (Mn4) | 223 (Mn1) | 209 (Mn2) | 185 (Mn3) |
| S2H-2a | 303 (Mn4) | 227 (Mn1) | 204 (Mn2) | 201 (Mn3) |
| S0H-1a/S2L-1a | 264 (Mn4) | 227 (Mn3) | 223 (Mn1) | 214 (Mn2) |
| S0H-1c/S2L-1c | 313 (Mn3) | 308 (Mn1) | 249 (Mn4) | 247 (Mn2) |
| S0H-3a/S2L-3a | 266 (Mn4) | 204 (Mn3) | 199 (Mn2) | 144 (Mn1) |
| S2L-6 | 280 (Mn1) | 207 (Mn2) | 181 (Mn4) | 90 (Mn3) |
| Exp. S2 (ref. 31) | 298 | 248 | 205 | 193 |
| Exp. S2 (ref. 32) | 297 | 245 | 217 | 200 |
| Exp. S2 (ref. 134) | 324 | 255 | 238 | 191 |
| Exp. S0 (ref. 31) | 347 | 247 | 220 | 193 |
55Mn-ENDOR of the S2 state of the Mn4O5Ca cofactor at 2.5 K
The 55Mn hyperfine coupling estimates described above are derived from Davies ENDOR (see Fig. 4).31,32,134 In such experiments 55Mn ENDOR transitions are observed over a relatively narrow frequency range, as compared to simpler model complexes, requiring all four Mn ions to display a similar hyperfine coupling in the coupled (measured) representation, i.e. of about 200–250 MHz. A recent experimental report though has thrown doubt on these results. Jin et al.30 have repeated the 55Mn ENDOR experiment on spinach PSII core complexes, but now at much lower temperatures (2.5 K). In contrast to all previous literature studies, they observed a broader, structured 55Mn ENDOR signal envelope interpreted as representing at least one 55Mn hyperfine tensor of large anisotropy. This broad envelope was assigned as a signature of more than one Mn(III) ion, i.e. in support of the low-valent scheme, and as evidence for a dimer-of-dimers like magnetic coupling topology. The authors suggested that such ENDOR signals may have been obscured in earlier measurements at higher temperatures (5 K) due to enhanced nuclear relaxation. This surprising finding prompted us to repeat EPR/ENDOR measurements of S2 state preparations from T. elongatus at the same low temperatures (2.5 K) using a new closed-cycle helium cryostat available from Cryogenic Ltd (see ESI† for details). The system was calibrated using a bis-μ-pivalato-μ-hydroxo Mn(II)Mn(III) model complex (“PivOH”)153 previously studied by Cox et al. (Fig. 4B, details in the ESI†).160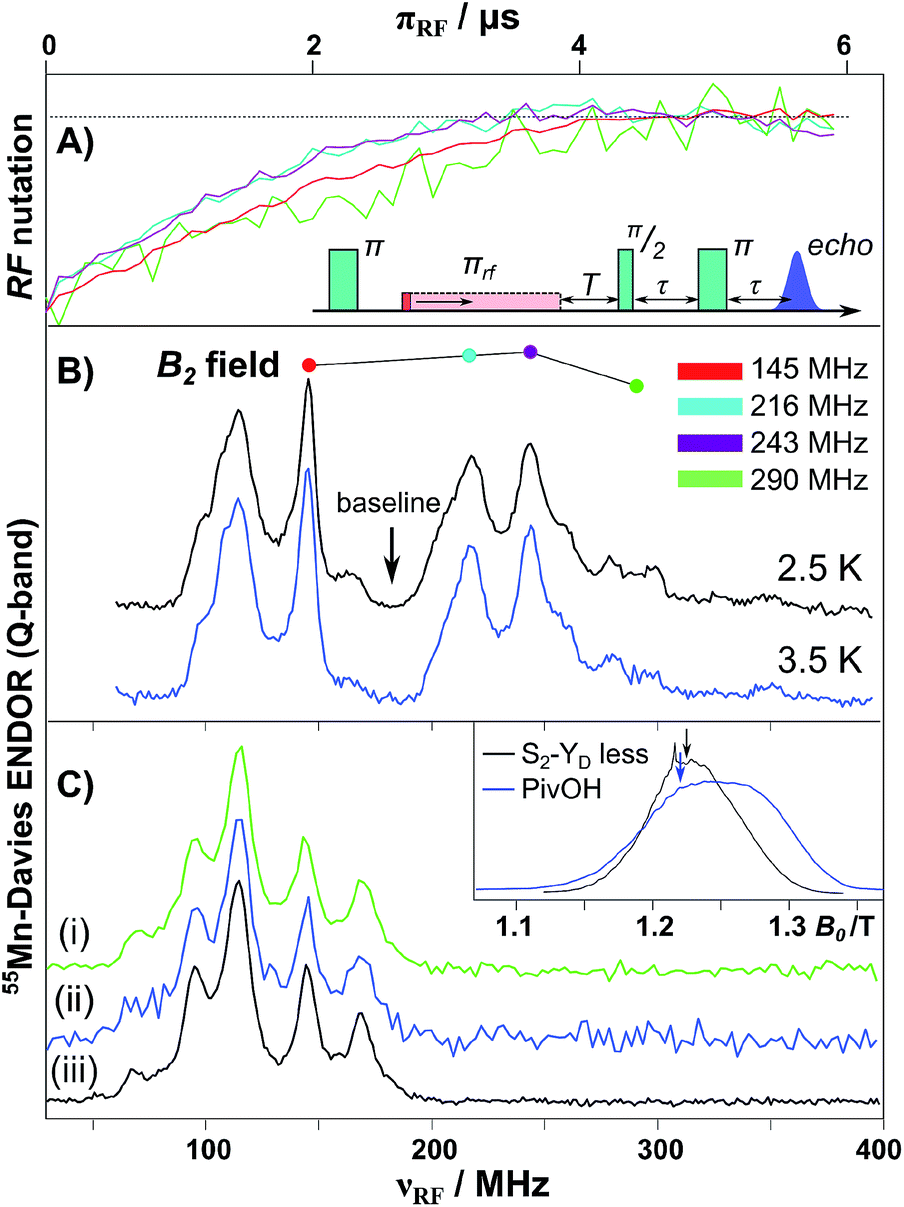 | ||
| Fig. 4 Q-band 55Mn-Davies ENDOR of the Mn(II)Mn(III) PivOH complex and the S2 (multiline) state of the Mn4O5Ca cofactor isolated from T. elongatus. (A) Normalized nuclear spin nutation curves measured at the positions marked in panel B demonstrate the linearity of the B2 field over the 150–300 MHz range. A baseline nutation curve measured at 185 MHz was subtracted from each data trace. (B) 55Mn-ENDOR spectra of the PivOH complex measured at center field of the EPR spectral envelope (see inset in panel C). (C) Q-band 55Mn-Davies ENDOR of the S2 state measured at center field of the EPR spectral envelope (see inset in panel C). The RF frequency was swept between 30 and 400 MHz in 1.2 MHz steps (at 5 K) or 2.5 MHz steps (at 2.5 K). Total data collection times were comparable: (i) 2.5 K (green), 20 ms repetition rate (ca. 18 hours); (ii) 2.5 K (blue), 250 ms rep. rate (ca. 17 hours); and (iii) 5 K (black), 1 ms rep. rate (ca. 14 hours). | ||
A control 55Mn-ENDOR spectrum of the Mn4CaO5 cofactor in the S2 state collected at 5 K is shown in Fig. 4. It is seen to be very similar to previously published data, see Cox et al.95 and Lohmiller et al.100 Importantly, 55Mn-ENDOR signals are only observed over a narrow radio frequency range, requiring all four Mn ions to display a similar hyperfine coupling, in line with a tetramer-like magnetic coupling topology.31,32,161 At this temperature, electronic T1 relaxation (T*1 = 21 μs) is sufficiently slow that a near full inversion of the spin echo is maintained during the Davies pulse sequence (≈6 μs), but is sufficiently fast to allow efficient data collection, with repetition rates of the order of 1 ms. Subsequently, the sample was cooled to 2.5 K and the 55Mn-ENDOR spectrum was re-measured. At this temperature, the T1 time is at least ca. 2 ms, hampering data collection. Nevertheless 55Mn-ENDOR data at a comparable signal to noise ratio could be obtained. It is readily observed that the ENDOR spectrum is essentially identical to that seen at 5 K, as expected (see Fig. 4C). Data were collected at two repetition rates, 20 ms (saturating) and 250 ms. The spectra are the same using both data collection rates, however the 20 ms spectrum has a significantly better signal-to-noise ratio owing to the tenfold increase in the number of collected averages. It is noted that the relaxation time at 2.5 K (2 ms, 500 s−1) is now in the range where the authors of Jin et al. hypothesize that additional 55Mn-ENDOR signals should appear.30 No such signals are observed in our study, hence we cannot confirm the observations made in the study of Jin et al.30 The 55Mn ENDOR data are instead consistent with a tetramer-like magnetic coupling topology, which results in all four Mn ions displaying similar hyperfine couplings.
S3 state high-valent models
The transition from the S2 to the S3 state represents a single oxidation event.162 We have recently examined this oxidation in the context of the HV scheme,102 where it was observed that the in silico oxidation of S2 state models leads to the formation of an S2YZ˙ electronic state, that is, the one-electron oxidation of the YZ residue as opposed to the oxidation of a Mn ion or ligand in the OEC. These structures are considered good models for intermediate “split signal” states, which can be trapped experimentally by advancing the Kok cycle at low temperatures. It is noted that in smaller models, which do not include the YZ/His190 couple, this result is clearly absent demonstrating the importance of retaining this structural unit to correctly capture the energetics of the OEC. Reaching the S3 state in silico, i.e. proceeding beyond the S2YZ˙ state, thus requires modification of the cofactor. Experimental data suggest that the transition from the S2 to the S3 state is accompanied by the loss of a proton,162 and most probably also by the binding of an additional water molecule163,164 that may not be the substrate in the present Kok cycle.54,165 Inclusion of both of these chemical modifications (deprotonation and water binding) leads to the oxidation of the OEC and formation of the S3 state. Note that a model where no additional water is bound to the Mn cluster, leading to an approximately trigonal-bipyramidal coordination geometry of Mn4, is characterized by a spin ground state at variance with experimental data for the S3 state (model S3H-5, see ESI†).Depending on the site of proton removal and the rearrangements that may take place prior to formation of the final S3 state, either H2O or OH− can be added to either of the S2-state models. The two S2H models presented above suggest immediately two possible binding sites for the water molecule: the open coordination site of Mn1 for the open cubane S2H-1a, and the open coordination site of Mn4 for its valence isomer S2H-1b. After considering several protonation patterns, the energetically preferred models are those presented in Fig. 5. The differences between S3H-1/S3H-2, derived from S2H-1a, and S3H-3/S3H-4, derived from S2H-1b, relate to the arrangement of hydrogen bonds, with the additional OH− being H-bonded to O5 in S3H-1 and S3H-3, but not in S3H-2 and S3H-4. Importantly, the structures derived from S2H-1a are significantly more stable than the ones derived from the closed cubane form S2H-1b, a change from approximately 1 kcal mol−1 in S2 to almost 10 kcal mol−1 in S3.46 As with the open-cubane structure of the S2 state, the lowest-energy S3H models correspond equally closely to models proposed by Siegbahn.71–73 It is noted that there may be further structural intermediates between the S2 and S3 states (in addition to the split signal states described above) that facilitate the binding of the new water molecule; these sub-states are not considered in this study, since we aim here to characterize the stable catalytic intermediates.
 | ||
| Fig. 5 Protonation patterns, oxidation states, Mn–Mn distances (Å), relative total energies (kcal mol−1), and ground spin states for four selected S3H models. | ||
All current interpretations of EXAFS data require the cofactor to contain three short Mn–Mn distances of up to 2.82 Å for S3.62,120 All S3H models have at least two Mn–Mn distances shorter than 2.81 Å, model S3H-1 has also a third short distance of 2.82 Å, whereas the third shortest distance for the other models is longer (2.88–2.93 Å). Thus, the lowest-energy isomer is also the one that matches EXAFS distance constraints most closely. An aspect controversially discussed in the literature concerns the possibility of ligand-centered versus metal-centered oxidation in the S2–S3 transition. In all S3H models the unpaired spin density is localized on the Mn ions, which have spin populations close to 2.9 electrons, as expected for Mn(IV) ions with a high-spin d3 electron configuration. Spin density on ligating O or N atoms is insignificant and the O bridges never carry spin populations in excess of 0.15 electrons. Thus, the present models do not support ligand-centered oxidation.24,27,166 This is consistent with an interpretation of X-ray absorption spectra62 that suggested the S2 to S3 transition to be accompanied by a change in the coordination sphere of the Mn oxidized from five-coordinate Mn(III) in S2 to six-coordinate Mn(IV) in S3, as in the S2H and S3H models presented here.
The predicted ground state spin for all S3H models is S = 3, consistent with experiment,45,46 regardless of differences in metal–oxo connectivity. An additional criterion for the models arises from the 55Mn hyperfine coupling constants.46 These have recently been established to be isotropic, strongly suggestive of octahedrally coordinated Mn(IV) ions, a condition that is satisfied by all S3H models presented here (see Table S9†). Experimentally, the observed 55Mn HFCs for S3 fall into two classes (in terms of absolute magnitude): (a) a large coupling class, where the hyperfine interaction is larger than the nuclear Larmor frequency with |A| ≈ 100 MHz, and (b) a small coupling class, where the hyperfine interaction is smaller than the nuclear Larmor frequency with |A| < 30 MHz.46 Importantly, the Mn ions of the large coupling class display negative55Mn HFCs whereas the Mn ions of the small coupling class display 55Mn HFCs, which may be assigned as either positive or negative (for a full discussion see Cox et al.46).
In polynuclear complexes such as the present systems, the 55Mn HFCs are determined by two factors: (a) the intrinsic site HFC values, which are predicted in this case to be within the narrow range 160–250 MHz for all models, similar to values for octahedral mononuclear Mn(IV) complexes and consistent with the identical oxidation state and similar coordination of all sites, and (b) the spin projection coefficients, i.e. the local spin expectation values scaled by the spin ground state, which function as weighing factors that describe the contribution of each ion to the electronic manifold of interest. The spin projection coefficients thus reflect the magnetic coupling topology of the cluster. In terms of idealized coupling schemes, the two types of core connectivity (open and closed cubane, Fig. 5), represent two limiting cases that both lead to a spin ground state of S = 3: a “dimer of dimers” topology with two weakly coupled subunits, a ferromagnetic Mn1–Mn2 (S12 = 3) and antiferromagnetic Mn3–Mn4 (S34 = 0) one, and a “trimer–monomer” topology where a trimeric S123 = 9/2 subunit couples antiferromagnetically with the S4 = 3/2 outer Mn4. The spin projection coefficients for the latter case will be approximately equal, thus leading to approximately equal HFCs given similar site HFC values, whereas for the first case the spin projections will fall into two classes, large ones for the Mn1–Mn2 subunit and small ones for the Mn3–Mn4 subunit.46
From the above discussion, it is expected that the open-cubane structures would be more suitable to yield the two different classes of 55Mn HFCs required by experiment. This is seen in our calculations: for S3H-1 and S3H-2 the spin projection coefficients are [0.48, 0.44, 0.18, −0.11] and [0.47, 0.49, −0.08, 0.11] for Mn1–Mn4, whereas those for S3H-3 and S3H-4 are [0.48, 0.46, 0.43, −0.37] and [0.47, 0.47, 0.44, −0.37]. Thus, models S3H-1 and S3H-2 reproduce the two classes of HFCs (Table 3), whereas S3H-3 and S3H-4 do not. The inclusion of the sign of the hyperfine as a constraint is unique so far and has not been achieved for any other S state. The calculated HFCs presented here show that the large hyperfine couplings are negative, in line with experiment. It is also noted that the spin topology in S3H-1, S3H-3 and S3H-4 is αααβ, while that in S3H-2 is ααβα, therefore both S3H-1 and S3H-2 reproduce additionally the experimental constraint regarding the possible sign reversal in one of the small HFCs. Numerical agreement between experimentally fitted and calculated HFCs for Mn3 and Mn4 can be improved by small perturbations of the non-nearest-neighbor J13 and/or J14 coupling pathways (±2 cm−1), which are the least well-defined computationally.
| Model | 55Mn |Aiso| | |||
|---|---|---|---|---|
| S3H-1 | −86 (Mn1) | −76 (Mn2) | −34 (Mn3) | +27 (Mn4) |
| S3H-2 | −99 (Mn2) | −88 (Mn1) | −29 (Mn4) | +20 (Mn3) |
| S3H-3 | +88 (Mn4) | −81 (Mn1) | −78 (Mn2) | −70 (Mn3) |
| S3H-4 | +86 (Mn4) | −79 (Mn2) | −75 (Mn1) | −65 (Mn3) |
| S3L-2 | −94 (Mn1) | −75 (Mn4) | −74 (Mn2) | +53 (Mn3) |
| S3L-3 | −105 (Mn2) | +98 (Mn4) | −92 (Mn1) | −79 (Mn3) |
| S3L-8 | −94 (Mn3) | −83 (Mn4) | −74 (Mn2) | +49 (Mn1) |
| S3L-10 | −100 (Mn4) | −93 (Mn1) | −80 (Mn2) | +60 (Mn3) |
| Exp. (ref. 46) | −99.0 (Mn1 or Mn2) | −95.6 (Mn1 or Mn2) | −25.9 (Mn3 or Mn4) | ≤5 (Mn3 or Mn4) |
S1 state high-valent models
Spectroscopic measurements demonstrate that the OEC can be advanced from the S1 state to the S2 state at cryogenic temperatures,167,168 while EXAFS of the S1 and S2 states shows that the geometric changes in the S1–S2 transition are too small to be resolved. Both observations, in combination with electrochromic measurements and the pH-insensitivity of the transition,129,169,170 suggest that the two states differ only by a redox event; hence, models for the S1 state should resemble the S2 state models in terms of structure. Accordingly, we discuss here models derived from S2H models either with the same protonation pattern or with W2/O5 proton translocation (see Fig. 6). | ||
| Fig. 6 Protonation patterns, oxidation states, relative total energies and ground spin states for the S1H models. Blue lines indicate the orientation of Jahn–Teller axes. | ||
Two valence isomers derive from S2H-1a/b (S1H-1a and S1H-1b), which differ not in the position of the oxo bridge O5, but instead in their oxidation state distribution. Specifically, in the lowest energy structure S1H-1a, the two Mn(III) ions are located at the terminal Mn1 and Mn4 positions, whereas the higher energy structure (S1H-1b) features two vicinal Mn(III) ions, at Mn1 and Mn2. This results in different exchange coupling pathways, with S1H-1b displaying a ferromagnetic interaction between Mn1 and Mn2 (see Table S5†). Combined with a reduction in the magnitude of the J34 antiferromagnetic coupling, as compared with S1H-1a, this model ends up having an S = 4 ground state. All other S1H models have a common III–IV–IV–III oxidation state distribution and display an experimentally consistent diamagnetic ground state.
Among the three-proton isomers, agreement with EXAFS is achieved only for the lower energy model S1H-1a that contains three short Mn–Mn distances, whereas in S1H-1b the corresponding distances are significantly longer. The core geometry of S1H-1a agrees well with other computational high-valent S1 state models.73,78,89 It is worth noting that whereas in the S2 state the Mn(III) ion of either of the interconvertible S2H minima features a Jahn–Teller axis oriented along Mn1–O5–Mn4, the Jahn–Teller axis of Mn4 in S1H-1a is instead found to be oriented along Asp170 and Glu333. Therefore, since the σ-antibonding interaction is avoided, the nature of the Mn4–O5 bond in S1H-1a should not be considerably different from S2H-1a, despite the change in Mn oxidation state, which could be of relevance for the interpretation of substrate exchange.15,31,52,54,56,69,72,98,158,171 Additionally, it would be worth exploring the implications for the interpretation of FTIR data on the S1–S2 transition,172,173 since the orientation of the Mn4 Jahn–Teller axis in S1H-1a and its loss in S2H-1a are expected to affect mostly the Asp170 and Glu333 carboxylate vibrational modes.
Other HV literature models for the S1 state suggest that both W1 and W2 could be present as H2O,78 or that O5 and W2 could be OH− groups.82,84 The first proposal, represented here by S1H-2, leads to a model consistent with EXAFS78 and spin-state constraints. In the case of the second suggestion, that is, with a protonated O5 bridge, only structures of the closed cubane type are stable, such as S1H-3a. However, this model and its isomer S1H-3b (Fig. S4†) are both higher in energy (4.0 and 6.4 kcal mol−1, respectively) than the S1H-2 alternative and both are inconsistent with EXAFS results (Table 1) due to a significant elongation of the Mn3–Mn4 distance. It is not possible to select one of S1H-1a or S1H-2 as the best model for S1, because both satisfy all constraints for this state in this study. Nevertheless, given that no change in protonation is expected between S1 and S2, we favor the S1H-1a model for reasons of consistency with the preferred S2H model, S2H-1a.
The structure of the cofactor reported in the 1.95 Å resolution XFEL model of PSII114 is also relevant to the question of the O5 protonation state. As with the EXAFS reference, there is good agreement between the computed Mn–Mn distances of the plausible S1H models reported above and the Mn–Mn distances of the XFEL model, with the exception of the Mn3–Mn4 distance that is reported a bit longer (ca. 2.9 Å) in the XFEL model. We also note that this study also agrees in the authors' tentative assignment of individual Mn oxidation states. The most obvious structural difference, however, is the Mn4–O5 bond length. Although the XFEL structure corrects the XRD model by placing the O5 closer to Mn4 instead of in-between the Mn1 and Mn4 ions, the Mn4–O5 distance in the XFEL model is still long enough to lead the authors to suggest that O5 is present as a hydroxyl group. Given the evidence presented here regarding structural and spectroscopic consistency with the subsequent S2 state, we consider this assignment unlikely.
In addition to the possibility that the Mn4 ion may be sensitive enough to still suffer some photoreduction in the XFEL study, a more obvious reason for the structural inconsistency with the present models may lie in the preparation of the PSII samples used in that study. Specifically, while long dark adapted PSII samples are expected to be predominantly in the S1 state, shorter dark adapted samples represent a 75%![[thin space (1/6-em)]](https://www.rsc.org/images/entities/char_2009.gif) :25% mix of the S1 and S0 states, respectively.14 S-state synchronization requires either long-term dark adaptation or a pre-illumination sequence described by Styring and Rutherford,174,175 which relies on fast S2 and S3 deactivation to S1 and slow S0 oxidation by the tyrosine D residue. Without further controls it is unclear into which regime the XFEL dataset belongs, or that the kinetics of S-state synchronization are identical for the partially dehydrated crystal preparation and those previously measured in solution samples. Therefore, it is conceivable that the reported XFEL structure may contain a non-negligible S0 state contribution. As will be shown in the next section, O5 protonation is indeed most likely in the S0 state, potentially explaining the elongation of the Mn4–O5 bond and its unusually high standard deviation reported for the XFEL structure.114
:25% mix of the S1 and S0 states, respectively.14 S-state synchronization requires either long-term dark adaptation or a pre-illumination sequence described by Styring and Rutherford,174,175 which relies on fast S2 and S3 deactivation to S1 and slow S0 oxidation by the tyrosine D residue. Without further controls it is unclear into which regime the XFEL dataset belongs, or that the kinetics of S-state synchronization are identical for the partially dehydrated crystal preparation and those previously measured in solution samples. Therefore, it is conceivable that the reported XFEL structure may contain a non-negligible S0 state contribution. As will be shown in the next section, O5 protonation is indeed most likely in the S0 state, potentially explaining the elongation of the Mn4–O5 bond and its unusually high standard deviation reported for the XFEL structure.114
S0 state high-valent models
In the S0–S1 transition one electron and one proton are removed from the cluster.162 The proton can be lost from different sites in an S0 model to form the expected S1H-1a model: either of the O4 and O5 oxo-bridges that are unprotonated in S1H-1a (yielding S0H-1 and S0H-2), or from W2, which would then be present as H2O in S0 (yielding S0H-3). To further test the viability of the 4-proton models in S1 and S2, 5-proton models for the S0 state were also evaluated (S0H-4 and S0H-5). A dual labeling scheme is used in Fig. 7, since most of these S0H models serve also as models for the S2 state in the low-valent scheme (S2L). | ||
| Fig. 7 Protonation patterns, oxidation states, Mn–Mn distances (Å), relative total energies (kcal mol−1), and ground spin states for the S0H and S2L models. Blue lines indicate the orientation of Jahn–Teller axes. | ||
Isomeric structures with different distributions of the same number of unpaired electrons among the four Mn ions are found for most protonation patterns. S0H models with an oxidation state distribution III–III–IV–III are not compatible with EXAFS-derived Mn–Mn distances for the S0 state, because the Jahn–Teller axis of Mn2 is always oriented along the Mn2–O3 bond resulting in longer Mn1–Mn2 and Mn2–Mn3 vectors. On the other hand, models with the oxidation state distribution III–IV–III–III have Mn–Mn distances that agree better with EXAFS and with the recent XFEL structure. The oxidation states are consistent with formal oxidation states derived from 55Mn-ENDOR.31,161 An alternative to the (III)3(IV) oxidation state assignment, i.e. (II)(III)(IV)2, arises if the S0–S1 transition involves a Mn(II)–Mn(III) rather than a Mn(III)–Mn(IV) oxidation. This possibility was left open in early EPR and XANES work,26,36,38,176 but excluded in subsequent 55Mn-ENDOR studies.31,161,177 In the present models, a Mn(II) ion is found in the Mn4 position of S0H-3c (see Fig. S4†) but in line with previous reports,82,178,179 it is strongly disfavored energetically by more than 23 kcal mol−1 over its redox isomer S0H-3a.
The spin state of S0 is S = 1/2 for the multiline signal centered at g = 2, reproduced here by the four-proton models S0H-1a, S0H-1c, and S0H-3a. Note that S0H-1a and S0H-1c differ mainly in the orientation of the Jahn–Teller axis of Mn4. Despite leading to the same ground spin state, the magnetic topologies of these three models differ qualitatively (see Table S4†). The most pronounced difference concerns the nature of the J23 exchange coupling constant, antiferromagnetic in S0H-1a/c and ferromagnetic in S0H-3a. The sign of J23 depends on the location of the Mn(IV) site and the Jahn–Teller axis orientations (Fig. 7): ferromagnetic or weakly antiferromagnetic interactions always arise between Mn(III) and Mn(IV) when the Jahn–Teller axis of the Mn(III) ion is oriented along a μ-oxo bridge between the ions. This is the case for the Mn2–Mn3 exchange pathway in the S = 7/2 models S0H-1b, S0H-2, S0H-3b, S0H-4a and S0H-5b. The spin ground states of all 5-proton S0H models are S ≥ 7/2, incompatible with experiment. These include models with a protonated O4 or O5 and W2 as a water molecule (S0H-4a/b and S0H-5a/b).
Models S0H-1a, S0H-1c, and S0H-3a display first excited states of S = 3/2, at 2, 21, and 16 cm−1, respectively. Since the separation between the ground and first excited state of S0 reported in electron spin–lattice relaxation measurements (ca. 22 cm−1)177 was obtained after treatment of PSII with methanol, which is known to increase this energy gap,31,37,180,181 it is not obvious which model should be considered a better match in this respect. The relative energies of the three S = 1/2 models favor S0H-1a, however it is noted that the relative energies of this model and its Jahn–Teller orientation isomer S0H-1c display unusual sensitivity, unique among all HV models in this study, to the percentage of exact exchange in the density functional. Specifically, the energy difference of 4.5 kcal mol−1 obtained with BP86 is reduced to practically zero with TPSSh (10% exact exchange) and is inverted to −1.5 kcal mol−1 with TPSS0 (25% exact exchange). This effect is presumably related to the different description afforded by different functionals of the energetic stabilization upon pseudo Jahn–Teller axis rotation at the Mn4 ion, thus complicating arguments based on energetics. In terms of computed 55Mn HFCs, all S = 1/2 S0H models agree less favorably with experimental values than the S2H models. They all underestimate the largest 55Mn HFC (Table 2) and in S0H-3a the magnitude of the smallest HFC is additionally predicted too small. On the other hand, S0H-1c overestimates the smallest HFC. Although there is room for improvement in modeling this state, either in terms of methodological refinement or in terms of additional input from experiment, overall we consider the general trends to be reproduced better by S0H-1a or S0H-1c (or both) than by S0H-3a.
In summary, the results from the preceding sections on the high-valent scheme converge to the final sequence of models S0H-1a → S1H-1a → S2H-1a/b → S3H-1.
S2 state low-valent models
Although the high-valent option appears to be in full agreement with experimental constraints, it is important to investigate the LV options with the same rigor to make sure that the experimental constraints and analysis methods are indeed discriminative. Similar to the HV scheme, we start our analysis with the S2 state, for which we use, as already suggested in previous literature proposals,107,108 a higher total number of protons to compensate for the two additional electrons relative to the HV scheme, namely four or five protons distributed over O4, O5, W1 and W2. Most S2L models (with the exception of the 5-proton forms S2L-6 and S2L-7) are identical to the high-valent S0 models presented in Fig. 7.The model that agrees best with EXAFS is the Mn(II)-containing S2L-3c (see Fig. S4†), which has three Mn–Mn distances in the range 2.83–2.86 Å, but is excluded due to its very high relative energy of 24 kcal mol−1. The best candidate S2L models appear to be those that contain at most two Mn–Mn distances that can be classified as short. No S2L model contains three short (i.e., <2.8 Å) Mn–Mn distances, and there is no obvious modification that would introduce an additional short distance. However, given the different EXAFS interpretations of the S2 state (Table 1) and the documented tendency of a slight overestimation of Mn–Mn distances by DFT methods,73,78,80 we do not consider the Mn–Mn distance criterion conclusive enough to fully exclude the low-valent option.
Five of the LV S2 models display one of the ground states observed experimentally: S = 1/2 for S2L-1a, S2L-1c, S2L-3a, and S2L-6; and S = 5/2 for S2L-3c and S2L-7. A key experimental observation that must be satisfied is the potential to interconvert between the low spin (S = 1/2) and high spin (S = 5/2) forms. Among the four-proton models, S2L-1a is practically isoenergetic with the global minimum of the subset (S2L-2), and thus we can consider it the best potential LV model for the S = 1/2 EPR multiline signal of the S2 state. However, a problem arises when we consider possible 4-proton model candidates for the S = 5/2 EPR signal. Only one model, the Mn(II)-containing S2L-3c, displays this ground state, but it is energetically inaccessible as pointed out above. These results make it hard to imagine a simple low-barrier interconversion for either of the S = 1/2 S2L 4-proton models.
Among the five proton models a similar problem arises. S2L-6 resembles S2L-1c in the orientation of the Jahn–Teller axes but differs in the protonation state of O5, present here as a loosely bound water. Note that this type of structure would be the corresponding S2 state model of a low-valent S1 state model proposed recently.107 Our results indicate that S2L-6 could potentially explain the S = 1/2 species in terms of spin state, but it is strongly disfavored energetically. It is significantly higher in energy than its corresponding S2L-7 (S = 5/2) isomer and is, in fact, the highest-energy five-proton isomer of all models considered, with the energy difference separating it from the minimum-energy isomer increasing from 12 kcal mol−1 to over 18 kcal mol−1 with the use of hybrid functionals. Thus, in contrast to the high-valent, quasi-energetic and interconvertible S2H-1a/b forms, no low-valent model set can explain the EPR phenomenology of the S2 state in a similar complete way.
Additional information is provided by the 55Mn HFCs for the models with S = 1/2 spin ground states. The experimental pattern of one HFC close to 300 MHz, one close to 250 MHz and two close to 200 MHz, is reproduced quite well by the high-valent S2-state models (Table 2), but not as well by the low-valent models. S2L-1a, S2L-3a and S2L-6 predict relatively large hyperfine couplings as they display tetramer-like spin projections, but the projected HFCs are smaller than for the HV case because Mn(III) site HFCs are smaller than Mn(IV) site HFCs. Thus, a cluster with more Mn(III) ions will have smaller projected HFCs compared to a cluster with more Mn(IV) ions, assuming similar spin projections. S2L-1c displays a different magnetic topology, resulting in HFCs that are uniformly too large. Among the present models, S2L-1a shows the most reasonable agreement with experiment.
S3 state low-valent models
Several candidate S3L models were constructed in an attempt to satisfy the criteria for the S2–S3 transition (Fig. 8). In principle the S1H models already described would represent candidates for S3L, as seen for S2L/S0H. In this case however, it is already evident from their reported properties that there can be no agreement with experimental constraints for the S3 state. These models display neither the correct spin state (SGS = 3) nor the correct Mn–Mn distances. Expanding upon this, S3L models where constructed based on S2L candidate structures which include an additional water ligand (H2O/OH−) as required for high valent S3 state models (S3H). Using S2L-1, S2L-3, S2L-6, and S2L-7 as starting points, seven five-proton models and five six-proton S3L models were constructed (Fig. 8). The core geometry of S3L-1 features three reasonably short Mn–Mn distances (2.80–2.85 Å) and can be thus considered consistent with EXAFS within DFT accuracy. The other models show at most two such distances, at variance with all interpretations of EXAFS data for the S3 state.62,117,120,129S3L-1 is also the lowest-energy structure for the five-proton isomers. However, it has to be excluded as a candidate for the S3 state because it is diamagnetic, with a large energy difference between the ground and first excited S = 1 state (Table S5†). The correct S = 3 ground state is seen for two five-proton models S3L-2 and S3L-3, but they are both higher in energy than S3L-1 and disagree with EXAFS. Two of the six-proton models, S3L-8 and S3L-10, also have the correct ground state. S3L-8 is by far the lowest energy isomer in its subset, but fails to satisfy the requirement of three short Mn–Mn distances. | ||
| Fig. 8 Protonation patterns, oxidation states, Mn–Mn distances (Å), relative total energies (kcal mol−1), and ground spin states for the S3L models. Blue lines indicate the orientation of Jahn–Teller axes. | ||
The calculated 55Mn HFCs provide additional evidence in the case of the S3L models. Table 3 lists computed values for all models with an S = 3 ground state. Crucially, no S3L model can reproduce the two classes of 55Mn HFC observed experimentally,46 thus providing a further argument against the LV scheme. Additionally, no S3L model satisfies the requirement for all Mn ions having isotropic HFCs, as shown by the anisotropic values listed in Table S8.† Overall, despite individual S3L models satisfying one or more of the constraints related to the S3 state of the OEC, there is no single S3L model among the ones studied here that is consistent with all geometric, electronic and spectroscopic criteria.
S1 state low-valent models
Low-valent S1 state models were built using the same protonation patterns as in the S2L models. The average oxidation state of 3.0 for the S1 state in the LV scheme can be formed either with all Mn ions as Mn(III), or with the oxidation state pattern II–III2–IV. The latter is certainly possible, since Mn(IV) and Mn(II) ions are known to coexist without comproportionation.182–184 Several S1L structures were found for which the variational energy minimization leads to the second combination of oxidation states, with the Mn(II) ion always at the Mn4 site (Fig. 9). However, this oxidation state distribution is always energetically disfavored. Among the four-proton models the lowest energy structure S1L-1 is of the Mn(III)4 type, whereas the mixed-valent isomers lie at least 17 kcal mol−1 higher in energy. In the set of five-proton models, energy differences between III4 and II–III2–IV are smaller, but the two Mn(III)4 models S1L-6 and S1L-7a are still energetically preferred. In all S1L models the proton of His337 has been transferred to the O3 bridge, as observed in other studies of low oxidation state OEC models.90 We note that S1L-6 corresponds to the model proposed by Pace and Stranger as a best fit to the 1.9 Å resolution crystallographic model.107 Previously, the same groups had suggested LV S1 state models corresponding to the present S1L-1 and S1L-4 in terms of protonation states and oxidation state distributions.108 | ||
| Fig. 9 Protonation patterns, oxidation states, Mn–Mn distances (Å), relative total energies (kcal mol−1), and ground spin states for the S1L models. Blue bars indicate the orientation of Jahn–Teller axes. | ||
In terms of geometry, the results in Fig. 9 suggest that regardless of relative energetics, all S1L models are inconsistent with the EXAFS constraints described previously and with the Mn–Mn distances of the recent XFEL structure.114 Rather than having three or even two short Mn–Mn distances, only one model (S1L-2) contains a single Mn–Mn distance close to 2.8 Å. Overestimation of these distances by more than 0.1 Å in the DFT models is unlikely since comparison with crystallographic data on Mn(III) complexes confirms that the Mn–O bond lengths, the extent of Jahn–Teller distortions, and the preferred orientation of the Jahn–Teller axes with respect to the nature of the ligands (e.g. O2−vs. OH−) are correctly predicted.185
In terms of electronic structure, no ground state with S < 3 is observed for any of the S1L models, owing to their magnetic coupling topology: the J23 pathway is always ferromagnetic (Table S6†) as in the S1H models and in agreement with experimental and computational data on mixed-valence oxo-bridged model complexes.185,186 However, in contrast to the S1H models, all S1L models also display ferromagnetic J12 values as a result of O3 protonation, leading to high-spin ground states. The presence or absence of an antiferromagnetic J34 interaction differentiates models with S = 3 from those with S = 6 or S = 8 ground states, but the experimentally observed lower spin states (S = 0 ground state; low lying S = 1 excited state) remain inaccessible for all S1L models (Fig. 9 and Table S9†).
S0 state low-valent models
We also evaluated several models for the S0 state, all of which display Mn(II)Mn(III)3 oxidation states (see Fig. S12†). All S0L models are at odds with EXAFS Mn–Mn distances for the S0 state, as the shortest Mn–Mn distance observed is 2.90 Å, whereas the experimental constraints require two or three Mn–Mn distances shorter than 2.80 Å (Table 1). In addition, none of these models reproduces the correct S = 1/2 ground state, yielding instead energetically well-separated high-spin ground states of S = 7/2 or 9/2 (see Table S10†). The necessary presence of a Mn(II) ion is also incompatible with the interpretation of 55Mn-ENDOR spectra of the S0 state.31,161,177Mn K pre-edge X-ray absorption spectroscopy
In the preceding sections, EXAFS metrics were used to evaluate the models on a geometric basis. However, complementary information can be derived from the XANES region, which provides insight into the electronic structure. Since the proposed S state models should be consistent with both spectral regions, here we extend the evaluation of the high-valent and low-valent schemes by comparing the Mn K pre-edge XAS spectra of selected structural models with experimental data.24 This serves as an independent control of the electronic structure of these models.Mn K-edge X-ray absorption spectra arise from excitations of Mn 1 s electrons into unoccupied molecular orbitals. These spectra are dominated by dipole-allowed—and thus intense—transitions into Mn 4p orbitals, known as the edge, which can in principle be correlated with the oxidation state of the Mn ions. At lower energies, excitations into unoccupied Mn 3d orbitals are observed; these are formally dipole-forbidden but gain intensity through admixture of 4p character. This defines the pre-edge region that extends over approximately 7 eV and contains information about the local electronic structure and ligand environment of the Mn ions. Computational studies of the Mn K edge (1s–4p) for diverse OEC models have been interpreted in favor of both the LV106 and the HV187 schemes, albeit using different theoretical approaches. Given the ambiguities in calculating the Mn K edge, we here focus on the more well-defined and computationally accessible 1s–3d transitions that give rise to the pre-edge spectral region. Importantly, it has been shown that the energies and intensities of calculated pre-edge spectra can be reliably correlated with experiment,149,188–196 using as reference a large set of 17 Mn complexes149,190,197,198 with oxidation states ranging from II to V that encompass both the HV and the LV scheme.
The experimental Mn K pre-edge spectra24 of all catalytic intermediates of the OEC are displayed in Fig. 10 (top). These are normalized experimental data, where the background of the rising edge has not been subtracted. The pre-edge region extends from 6538–6545 eV, with two features for each intermediate at ca. 6541 eV and 6543 eV. A third, lowest-energy feature is potentially present for S0 and S1 at ca. 6539.5 eV. Importantly, the pre-edge peak positions do not move significantly upon oxidation of the cluster. The pre-edge intensity increases as the cluster advances in the catalytic cycle, with a more pronounced intensity increase between S0 and S1 than in the subsequent steps. It should be noted that the subtraction of the rising edge background may alter this visual impression as far as the relative intensities are concerned, but the position of the peak maxima should be largely unaffected by background subtraction.
 | ||
| Fig. 10 Mn K pre-edge spectra of the OEC. (Top to bottom) Experimental spectra from ref. 24, calculated spectra for HV and for LV models. The spectra are colored in blue for S0, green for S1, red for S2 and orange for S3. | ||
Fig. 10 compares the experimental data (top panel) with the calculated pre-edge regions for the best HV (S0H-1a, S1H-1a, S2H-1a, S3H-1) and LV models (S0L-3, S1L-1, S2L-6, S3L-8). These calculations do not include the rising edge background, which may affect the relative intensities of the pre-edge spectra. Strikingly, neither the intensity nor the energy trends are reproduced by the calculated pre-edge spectra of the LV models. The maxima of the first peaks are spread over a range of 1.1 eV, while the spectrum of S0L-3 is the most intense. Both of these observations are in complete contrast to experiment.
On the other hand, even though there is no perfect agreement in the relative intensities of the S1 and S2 state spectra, the peak maxima for all HV models fall within 0.1 eV and thus are in excellent agreement with the experimental data. Quantitative comparison between the calculated and experimental intensities would require fits to experimental data and exceeds the scope of the present work. Analysis of the acceptor orbitals for the lowest energy transitions reveals that the character of the transitions is the same for all models studied here: the excitations are into orbitals of predominant Mn d character with contributions from the directly coordinating ligands. The differences in energy and intensity of the transitions arise from differences in the local ligand sphere symmetries and oxidation states of the Mn ions, and are thus direct probes of their local geometric and electronic structure (see the ESI† for a more detailed discussion of calculated intensities, including a comparison between the pre-edge spectra for the two forms of the S2 state). Overall, the computed Mn K pre-edge results are in line with the preceding observations: the pre-edge region of the HV models is in agreement with experimental data, while the LV models diverge strongly from experiment for the lowest S states.
Conclusions
The results presented in this work for all the (semi)stable S states of the OEC, serve to unify diverse experimental observations within a common framework, allowing a definitive conclusion regarding the individual oxidation state assignments for the Mn ions to be reached. We have studied the largest number of low-valent models ever constructed and reported, for all S states, including all known literature suggestions107,108 that can be accommodated within the crystal structure of PSII by Umena et al.110 and expanding considerably beyond them. No variation of protonation level, pattern or bonding topology of structures that follow the low-valent paradigm could produce a consistent set of models for all S0–S3 states. Although individual LV models of the S2 and S3 states satisfy some, but never all, experimental criteria, all low-valent S1 and S0 state models are in complete disagreement with experiment in all respects. They exhibit too long Mn–Mn distances compared with EXAFS despite the applied backbone constraints, they yield without exception high-spin ground states incompatible with available EPR data, and they have Mn K pre-edge profiles that deviate strongly from experiment. Although the low oxidation state scheme can thus be excluded from further consideration as a valid description of the Kok cycle, the set of LV structures could serve as models of reduced (negative) S states. These can be produced by various treatments199–201 and have been invoked as structural models for the photoreduced crystallographic model of the OEC.90 Moreover, if sufficiently understood they could provide important information on the final stages of assembly and activation of the catalytic cluster. A preliminary discussion of the present LV models as candidates for the S−1 and S−2 states of the OEC is provided in the ESI.†In contrast, using models constructed according to the high-valent paradigm leads to excellent agreement with experimental constraints for the individual intermediates. Importantly a self-consistent progression of states, comprising structures which served as the best models for individual S states, is observed. This model set is simultaneously consistent with experimental constraints concerning deprotonation and water-binding events along the catalytic cycle (see Fig. 11). With respect to questions relevant to the HV scheme itself, specifically the precise identity and distribution of Mn oxidation states in the S0 state and the possibility of ligand radical formation in the S3 state,23–27,61,64,66 the present work supports the absence of Mn(II) in the S0 state and the Mn-centered oxidation in the S2–S3 transition.
 | ||
| Fig. 11 Models for each S state of the Kok cycle, showing the optimized geometry, protonation pattern and Mn oxidation states of the inorganic core. | ||
Although no similar comprehensive comparison of the two oxidation state paradigms has been attempted before, we note that in addition to the agreement with EXAFS distances, support for the HV scheme derives from simulations of EXAFS spectra for individual high-valent models, some of which resemble closely the ones selected here as best HV candidates.78,80,202 It is also important to stress that despite hypothetical water oxidation mechanisms that might be accommodated within an LV scheme, to the best of our knowledge it is only with high-valent models that complete and detailed mechanistic pathways for water oxidation have been proposed from quantum chemical calculations.67–70,73 As reported also for synthetic Mn systems,203 the high oxidation states of the Mn ions are presumably related to oxyl radical formation.204,205 This is the basis of the most prevalent mechanistic hypothesis proposed by Siegbahn on the basis of energy optimization, where O–O bond formation is proposed to advance through low-barrier oxo–oxyl coupling in the S4 state.69,73,206 Note that the assignment of high oxidation states for the Mn ions for the biological OEC is also in agreement with the assignment of average Mn oxidation states close to Mn(IV) for synthetic manganese oxide water oxidation catalysts.207
In summary, it was shown through extensive comparison of high-valent and low-valent models for the individual S0–S3 state catalytic intermediates of the OEC that only the high-valent scheme, that is, Mn(III)3Mn(IV) for the S0 state up to Mn(IV)4 for the S3 state, can lead to spectroscopically consistent models for all (semi)stable catalytic intermediates. Further advances in our understanding of the dynamic structure and the regulation of the OEC in these states remain necessary and are currently being pursued by many research groups. One of the greatest challenges now appears to lie in obtaining experimental information about the most critical final steps of water oxidation, that is, on the transient states related to oxygen evolution and regeneration of the S0 state. It is expected that information obtained by new techniques such as X-ray free-electron laser protein crystallography,114,208,209 coupled with high-level spectroscopy-oriented quantum chemical approaches, will be pivotal for achieving this goal in the near future.
Acknowledgements
Alain Boussac is gratefully acknowledged for providing the EPR samples. Financial support was provided by the Max Planck Society. JM was supported by Energimyndigheten, the Solar Fuels strong research environment (Umeå University) and the Artificial Leaf Project Umeå (K&A Wallenberg foundation).Notes and references
- T. A. Faunce, W. Lubitz, A. W. Rutherford, D. MacFarlane, G. F. Moore, P. Yang, D. G. Nocera, T. A. Moore, D. H. Gregory, S. Fukuzumi, K. B. Yoon, F. A. Armstrong, M. R. Wasielewski and S. Styring, Energy Environ. Sci., 2013, 6, 695–698 Search PubMed.
- T. R. Cook, D. K. Dogutan, S. Y. Reece, Y. Surendranath, T. S. Teets and D. G. Nocera, Chem. Rev., 2010, 110, 6474–6502 CrossRef CAS PubMed.
- W. Lubitz, E. J. Reijerse and J. Messinger, Energy Environ. Sci., 2008, 1, 15–31 CAS.
- M. D. Kärkäs, O. Verho, E. V. Johnston and B. Åkermark, Chem. Rev., 2014, 114, 11863–12001 Search PubMed.
- S. Berardi, S. Drouet, L. Francas, C. Gimbert-Surinach, M. Guttentag, C. Richmond, T. Stoll and A. Llobet, Chem. Soc. Rev., 2014, 43, 7501–7519 RSC.
- D. G. Nocera, Acc. Chem. Res., 2012, 45, 767–776 CrossRef CAS PubMed.
- M. Wiechen, H.-M. Berends and P. Kurz, Dalton Trans., 2012, 41, 21–31 RSC.
- J. P. McEvoy and G. W. Brudvig, Chem. Rev., 2006, 106, 4455–4483 CrossRef CAS PubMed.
- N. Cox, D. A. Pantazis, F. Neese and W. Lubitz, Acc. Chem. Res., 2013, 46, 1588–1596 CrossRef CAS PubMed.
- J. Messinger and G. Renger, in Primary Processes of Photosynthesis, Part 2: Principles and Apparatus, The Royal Society of Chemistry, Cambridge, 2008, vol. 9, pp. 291–349 Search PubMed.
- A. Grundmeier and H. Dau, Biochim. Biophys. Acta, Bioenerg., 2012, 1817, 88–105 CrossRef CAS PubMed.
- D. A. Pantazis, N. Cox, W. Lubitz and F. Neese, in Encyclopedia of Inorganic and Bioinorganic Chemistry, John Wiley & Sons, Ltd, 2014 Search PubMed.
- P. Joliot, G. Barbieri and R. Chabaud, Photochem. Photobiol., 1969, 10, 309–329 CrossRef CAS PubMed.
- B. Kok, B. Forbush and M. McGloin, Photochem. Photobiol., 1970, 11, 457–475 CrossRef CAS PubMed.
- D. J. Vinyard, G. M. Ananyev and G. C. Dismukes, Annu. Rev. Biochem., 2013, 82, 577–606 CrossRef CAS PubMed.
- G. C. Dismukes and Y. Siderer, Proc. Natl. Acad. Sci. U. S. A., 1981, 78, 274–278 CrossRef CAS.
- D. B. Goodin, V. K. Yachandra, R. D. Britt, K. Sauer and M. P. Klein, Biochim. Biophys. Acta, Bioenerg., 1984, 767, 209–216 CrossRef CAS.
- J. C. de Paula, W. F. Beck, A.-F. Miller, R. B. Wilson and G. W. Brudvig, J. Chem. Soc., Faraday Trans., 1987, 83, 3635–3651 RSC.
- J. C. De Paula and G. W. Brudvig, J. Am. Chem. Soc., 1985, 107, 2643–2648 CrossRef CAS.
- J. C. De Paula, W. F. Beck and G. W. Brudvig, J. Am. Chem. Soc., 1986, 108, 4002–4009 CrossRef CAS.
- G. W. Brudvig, W. F. Beck and J. C. de Paula, Annu. Rev. Biophys. Biophys. Chem., 1989, 18, 25–46 CrossRef CAS PubMed.
- O. Hansson and L. E. Andreasson, Biochim. Biophys. Acta, 1982, 679, 261–268 CrossRef CAS.
- H. Dau, L. Iuzzolino and J. Dittmer, Biochim. Biophys. Acta, Bioenerg., 2001, 1503, 24–39 CrossRef CAS.
- J. Messinger, J. H. Robblee, U. Bergmann, C. Fernandez, P. Glatzel, H. Visser, R. M. Cinco, K. L. McFarlane, E. Bellacchio, S. A. Pizarro, S. P. Cramer, K. Sauer, M. P. Klein and V. K. Yachandra, J. Am. Chem. Soc., 2001, 123, 7804–7820 CrossRef CAS PubMed.
- T.-a. Ono, T. Noguchi, Y. Inoue, M. Kusunoki, T. Matsushita and H. Oyanagi, Science, 1992, 258, 1335–1337 CAS.
- L. Iuzzolino, J. Dittmer, W. Dörner, W. Meyer-Klaucke and H. Dau, Biochemistry, 1998, 37, 17112–17119 CrossRef CAS PubMed.
- T. A. Roelofs, W. Liang, M. J. Latimer, R. M. Cinco, A. Rompel, J. C. Andrews, K. Sauer, V. K. Yachandra and M. P. Klein, Proc. Natl. Acad. Sci. U. S. A., 1996, 93, 3335–3340 CrossRef CAS.
- R. J. Pace, L. Jin and R. Stranger, Dalton Trans., 2012, 41, 11145–11160 RSC.
- M. Zheng and G. C. Dismukes, Inorg. Chem., 1996, 35, 3307–3319 CrossRef CAS PubMed.
- L. Jin, P. Smith, C. J. Noble, R. Stranger, G. R. Hanson and R. J. Pace, Phys. Chem. Chem. Phys., 2014, 16, 7799–7812 RSC.
- L. V. Kulik, B. Epel, W. Lubitz and J. Messinger, J. Am. Chem. Soc., 2007, 129, 13421–13435 CrossRef CAS PubMed.
- J. M. Peloquin, K. A. Campbell, D. W. Randall, M. A. Evanchik, V. L. Pecoraro, W. H. Armstrong and R. D. Britt, J. Am. Chem. Soc., 2000, 122, 10926–10942 CrossRef CAS.
- J. M. Peloquin and R. D. Britt, Biochim. Biophys. Acta, Bioenerg., 2001, 1503, 96–111 CrossRef CAS.
- N. Ioannidis, G. Zahariou and V. Petrouleas, Biochemistry, 2006, 45, 6252–6259 CrossRef CAS PubMed.
- A. Haddy, Photosynth. Res., 2007, 92, 357–368 CrossRef CAS PubMed.
- K. A. Åhrling, S. Peterson and S. Styring, Biochemistry, 1997, 36, 13148–13152 CrossRef PubMed.
- J. Messinger, J. H. A. Nugent and M. C. W. Evans, Biochemistry, 1997, 36, 11055–11060 CrossRef CAS PubMed.
- J. Messinger, J. H. Robblee, W. O. Yu, K. Sauer, V. K. Yachandra and M. P. Klein, J. Am. Chem. Soc., 1997, 119, 11349–11350 CrossRef CAS PubMed.
- K. A. Åhrling, S. Peterson and S. Styring, Biochemistry, 1998, 37, 8115–8120 CrossRef PubMed.
- D. Koulougliotis, D. J. Hirsh and G. W. Brudvig, J. Am. Chem. Soc., 1992, 114, 8322–8323 CrossRef CAS.
- W.-Y. Hsieh, K. A. Campbell, W. Gregor, R. D. Britt, D. W. Yoder, J. E. Penner-Hahn and V. L. Pecoraro, Biochim. Biophys. Acta, Bioenerg., 2004, 1655, 149–157 CrossRef CAS PubMed.
- J. L. Zimmermann and A. W. Rutherford, Biochemistry, 1986, 25, 4609–4615 CrossRef CAS.
- A. Haddy, K. V. Lakshmi, G. W. Brudvig and H. A. Frank, Biophys. J., 2004, 87, 2885–2896 CrossRef CAS PubMed.
- N. Ioannidis and V. Petrouleas, Biochemistry, 2000, 39, 5246–5254 CrossRef CAS PubMed.
- A. Boussac, M. Sugiura, A. W. Rutherford and P. Dorlet, J. Am. Chem. Soc., 2009, 131, 5050–5051 CrossRef CAS PubMed.
- N. Cox, M. Retegan, F. Neese, D. A. Pantazis, A. Boussac and W. Lubitz, Science, 2014, 345, 804–808 CrossRef CAS PubMed.
- L. Zaltsman, G. M. Ananyev, E. Bruntrager and G. C. Dismukes, Biochemistry, 1997, 36, 8914–8922 CrossRef CAS PubMed.
- J. Dasgupta, G. M. Ananyev and G. C. Dismukes, Coord. Chem. Rev., 2008, 252, 347–360 CrossRef CAS PubMed.
- D. R. J. Kolling, N. Cox, G. M. Ananyev, R. J. Pace and G. C. Dismukes, Biophys. J., 2012, 103, 313–322 CrossRef CAS PubMed.
- T. Kuntzleman and C. F. Yocum, Biochemistry, 2005, 44, 2129–2142 CrossRef CAS PubMed.
- J. Messinger, G. Seaton, T. Wydrzynski, U. Wacker and G. Renger, Biochemistry, 1997, 36, 6862–6873 CrossRef CAS PubMed.
- J. Messinger, M. Badger and T. Wydrzynski, Proc. Natl. Acad. Sci. U. S. A., 1995, 92, 3209–3213 CrossRef CAS.
- K. Beckmann, J. Messinger, M. Badger, T. Wydrzynski and W. Hillier, Photosynth. Res., 2009, 102, 511–522 CrossRef CAS PubMed.
- N. Cox and J. Messinger, Biochim. Biophys. Acta, Bioenerg., 2013, 1827, 1020–1030 CrossRef CAS PubMed.
- W. Hillier and T. Wydrzynski, Biochim. Biophys. Acta, Bioenerg., 2001, 1503, 197–209 CrossRef CAS.
- J. Messinger, Phys. Chem. Chem. Phys., 2004, 6, 4764–4771 RSC.
- W. Hillier and T. Wydrzynski, Coord. Chem. Rev., 2008, 252, 306–317 CrossRef CAS PubMed.
- J. Cole, V. K. Yachandra, R. D. Guiles, A. E. McDermott, R. D. Britt, S. L. Dexheimer, K. Sauer and M. P. Klein, Biochim. Biophys. Acta, Bioenerg., 1987, 890, 395–398 CrossRef CAS.
- V. K. Yachandra, K. Sauer and M. P. Klein, Chem. Rev., 1996, 96, 2927–2950 CrossRef CAS PubMed.
- V. K. Yachandra, V. J. DeRose, M. J. Latimer, I. Mukerji, K. Sauer and M. P. Klein, Science, 1993, 260, 675–679 CAS.
- H. Dau, P. Liebisch and M. Haumann, Anal. Bioanal. Chem., 2003, 376, 562–583 CrossRef CAS PubMed.
- M. Haumann, C. Müller, P. Liebisch, L. Iuzzolino, J. Dittmer, M. Grabolle, T. Neisius, W. Meyer-Klaucke and H. Dau, Biochemistry, 2005, 44, 1894–1908 CrossRef CAS PubMed.
- D. Kuzek and R. J. Pace, Biochim. Biophys. Acta, Bioenerg., 2001, 1503, 123–137 CrossRef CAS.
- R. D. Guiles, J. L. Zimmermann, A. E. McDermott, V. K. Yachandra, J. L. Cole, S. L. Dexheimer, R. D. Britt, K. Wieghardt and U. Bossek, Biochemistry, 1990, 29, 471–485 CrossRef CAS.
- D. J. MacLachlan, J. H. A. Nugent and M. C. W. Evans, Biochim. Biophys. Acta, Bioenerg., 1994, 1185, 103–111 CrossRef CAS.
- H. Dau, P. Liebisch and M. Haumann, Phys. Scr., 2005, 2005, 844 CrossRef.
- P. E. M. Siegbahn, Chem.–Eur. J., 2008, 14, 8290–8302 CrossRef CAS PubMed.
- P. E. M. Siegbahn, Philos. Trans. R. Soc., B, 2008, 363, 1221–1228 CrossRef CAS PubMed.
- P. E. M. Siegbahn, Acc. Chem. Res., 2009, 42, 1871–1880 CrossRef CAS PubMed.
- P. E. M. Siegbahn, J. Photochem. Photobiol., B, 2011, 104, 94–99 CrossRef CAS PubMed.
- P. E. M. Siegbahn, Phys. Chem. Chem. Phys., 2012, 14, 4849–4856 RSC.
- P. E. M. Siegbahn, J. Am. Chem. Soc., 2013, 135, 9442–9449 CrossRef CAS PubMed.
- P. E. M. Siegbahn, Biochim. Biophys. Acta, Bioenerg., 2013, 1827, 1003–1019 CrossRef CAS PubMed.
- E. M. Sproviero, J. A. Gascon, J. P. McEvoy, G. W. Brudvig and V. S. Batista, J. Chem. Theory Comput., 2006, 2, 1119–1134 CrossRef CAS.
- E. M. Sproviero, J. A. Gascon, J. P. McEvoy, G. W. Brudvig and V. S. Batista, J. Am. Chem. Soc., 2008, 130, 6728–6730 CrossRef CAS PubMed.
- E. M. Sproviero, J. A. Gascon, J. P. McEvoy, G. W. Brudvig and V. S. Batista, J. Am. Chem. Soc., 2008, 130, 3428–3442 CrossRef CAS PubMed.
- E. M. Sproviero, J. A. Gascon, J. P. McEvoy, G. W. Brudvig and V. S. Batista, Coord. Chem. Rev., 2008, 252, 395–415 CrossRef CAS PubMed.
- S. Luber, I. Rivalta, Y. Umena, K. Kawakami, J. R. Shen, N. Kamiya, G. W. Brudvig and V. S. Batista, Biochemistry, 2011, 50, 6308–6311 CrossRef CAS PubMed.
- I. Rivalta, M. Amin, S. Luber, S. Vassiliev, R. Pokhrel, Y. Umena, K. Kawakami, J. R. Shen, N. Kamiya, D. Bruce, G. W. Brudvig, M. R. Gunner and V. S. Batista, Biochemistry, 2011, 50, 6312–6315 CrossRef CAS PubMed.
- R. Pal, C. F. A. Negre, L. Vogt, R. Pokhrel, M. Z. Ertem, G. W. Brudvig and V. S. Batista, Biochemistry, 2013, 52, 7703–7706 CrossRef CAS PubMed.
- K. Kanda, S. Yamanaka, T. Saito, Y. Umena, K. Kawakami, J.-R. Shen, N. Kamiya, M. Okumura, H. Nakamura and K. Yamaguchi, Chem. Phys. Lett., 2011, 506, 98–103 CrossRef CAS PubMed.
- H. Isobe, M. Shoji, S. Yamanaka, Y. Umena, K. Kawakami, N. Kamiya, J. R. Shen and K. Yamaguchi, Dalton Trans., 2012, 41, 13727–13740 RSC.
- T. Saito, S. Yamanaka, K. Kanda, H. Isobe, Y. Takano, Y. Shigeta, Y. Umena, K. Kawakami, J. R. Shen, N. Kamiya, M. Okumura, M. Shoji, Y. Yoshioka and K. Yamaguchi, Int. J. Quantum Chem., 2012, 112, 253–276 CrossRef CAS.
- K. Yamaguchi, H. Isobe, S. Yamanaka, T. Saito, K. Kanda, M. Shoji, Y. Umena, K. Kawakami, J. R. Shen, N. Kamiya and M. Okumura, Int. J. Quantum Chem., 2012, 113, 525–541 CrossRef.
- S. Yamanaka, T. Saito, K. Kanda, H. Isobe, Y. Umena, K. Kawakami, J. R. Shen, N. Kamiya, M. Okumura, H. Nakamura and K. Yamaguchi, Int. J. Quantum Chem., 2012, 112, 321–343 CrossRef CAS.
- M. Shoji, H. Isobe, S. Yamanaka, Y. Umena, K. Kawakami, N. Kamiya, J. R. Shen and K. Yamaguchi, Catal. Sci. Technol., 2013, 3, 1831–1848 CAS.
- K. Yamaguchi, S. Yamanaka, H. Isobe, T. Saito, K. Kanda, Y. Umena, K. Kawakami, J. R. Shen, N. Kamiya, M. Okumura, H. Nakamura, M. Shoji and Y. Yoshioka, Int. J. Quantum Chem., 2013, 113, 453–473 CrossRef CAS.
- M. Kusunoki, Biochim. Biophys. Acta, Bioenerg., 2007, 1767, 484–492 CrossRef CAS PubMed.
- M. Kusunoki, J. Photochem. Photobiol., B, 2011, 104, 100–110 CrossRef CAS PubMed.
- A. Galstyan, A. Robertazzi and E. W. Knapp, J. Am. Chem. Soc., 2012, 134, 7442–7449 CrossRef CAS PubMed.
- D. Bovi, D. Narzi and L. Guidoni, Angew. Chem., Int. Ed., 2013, 52, 11744–11749 CrossRef CAS PubMed.
- S. Schinzel, J. Schraut, A. V. Arbuznikov, P. E. M. Siegbahn and M. Kaupp, Chem.–Eur. J., 2010, 16, 10424–10438 CrossRef CAS PubMed.
- D. A. Pantazis, M. Orio, T. Petrenko, S. Zein, W. Lubitz, J. Messinger and F. Neese, Phys. Chem. Chem. Phys., 2009, 11, 6788–6798 RSC.
- W. Ames, D. A. Pantazis, V. Krewald, N. Cox, J. Messinger, W. Lubitz and F. Neese, J. Am. Chem. Soc., 2011, 133, 19743–19757 CrossRef CAS PubMed.
- N. Cox, L. Rapatskiy, J.-H. Su, D. A. Pantazis, M. Sugiura, L. Kulik, P. Dorlet, A. W. Rutherford, F. Neese, A. Boussac, W. Lubitz and J. Messinger, J. Am. Chem. Soc., 2011, 133, 3635–3648 CrossRef CAS PubMed.
- J.-H. Su, N. Cox, W. Ames, D. A. Pantazis, L. Rapatskiy, T. Lohmiller, L. V. Kulik, P. Dorlet, A. W. Rutherford, F. Neese, A. Boussac, W. Lubitz and J. Messinger, Biochim. Biophys. Acta, Bioenerg., 2011, 1807, 829–840 CrossRef CAS PubMed.
- D. A. Pantazis, W. Ames, N. Cox, W. Lubitz and F. Neese, Angew. Chem., Int. Ed., 2012, 51, 9935–9940 CrossRef CAS PubMed.
- M. Pérez Navarro, W. M. Ames, H. Nilsson, T. Lohmiller, D. A. Pantazis, L. Rapatskiy, M. M. Nowaczyk, F. Neese, A. Boussac, J. Messinger, W. Lubitz and N. Cox, Proc. Natl. Acad. Sci. U. S. A., 2013, 110, 15561–15566 CrossRef PubMed.
- M. Retegan, F. Neese and D. A. Pantazis, J. Chem. Theory Comput., 2013, 9, 3832–3842 CrossRef CAS.
- T. Lohmiller, V. Krewald, M. Pérez Navarro, M. Retegan, L. Rapatskiy, M. M. Nowaczyk, A. Boussac, F. Neese, W. Lubitz, D. A. Pantazis and N. Cox, Phys. Chem. Chem. Phys., 2014, 16, 11877–11892 RSC.
- Y. Kurashige, G. K.-L. Chan and T. Yanai, Nat. Chem., 2013, 5, 660–666 CrossRef CAS PubMed.
- M. Retegan, N. Cox, W. Lubitz, F. Neese and D. A. Pantazis, Phys. Chem. Chem. Phys., 2014, 16, 11901–11910 RSC.
- D. Narzi, D. Bovi and L. Guidoni, Proc. Natl. Acad. Sci. U. S. A., 2014, 111, 8723–8728 CrossRef CAS PubMed.
- S. Petrie, R. Stranger, P. Gatt and R. J. Pace, Chem.–Eur. J., 2007, 13, 5082–5089 CrossRef CAS PubMed.
- S. Petrie, R. Stranger and R. L. Pace, Chem.–Eur. J., 2008, 14, 5482–5494 CrossRef CAS PubMed.
- A. R. Jaszewski, S. Petrie, R. J. Pace and R. Stranger, Chem.–Eur. J., 2011, 17, 5699–5713 CrossRef CAS PubMed.
- P. Gatt, S. Petrie, R. Stranger and R. J. Pace, Angew. Chem., Int. Ed., 2012, 51, 12025–12028 CrossRef CAS PubMed.
- S. Petrie, P. Gatt, R. Stranger and R. J. Pace, Phys. Chem. Chem. Phys., 2012, 14, 11333–11343 RSC.
- A. R. Jaszewski, R. Stranger and R. J. Pace, J. Phys. Chem. B, 2011, 115, 4484–4499 CrossRef CAS PubMed.
- Y. Umena, K. Kawakami, J.-R. Shen and N. Kamiya, Nature, 2011, 473, 55–60 CrossRef CAS PubMed.
- J. Yano, J. Kern, K.-D. Irrgang, M. J. Latimer, U. Bergmann, P. Glatzel, Y. Pushkar, J. Biesiadka, B. Loll, K. Sauer, J. Messinger, A. Zouni and V. K. Yachandra, Proc. Natl. Acad. Sci. U. S. A., 2005, 102, 12047–12052 CrossRef CAS PubMed.
- M. Grabolle, M. Haumann, C. Müller, P. Liebisch and H. Dau, J. Biol. Chem., 2006, 281, 4580–4588 CrossRef CAS PubMed.
- A. Robertazzi, A. Galstyan and E. W. Knapp, CrystEngComm, 2011, 13, 6369–6372 RSC.
- M. Suga, F. Akita, K. Hirata, G. Ueno, H. Murakami, Y. Nakajima, T. Shimizu, K. Yamashita, M. Yamamoto, H. Ago and J.-R. Shen, Nature, 2014, 517, 99–103 CrossRef PubMed.
- J. Yano and V. Yachandra, Chem. Rev., 2014, 114, 4175–4205 CrossRef CAS PubMed.
- H. Dau, A. Grundmeier, P. Loja and M. Haumann, Philos. Trans. R. Soc., B, 2008, 363, 1237–1243 CrossRef CAS PubMed.
- J. Yano, J. Kern, K. Sauer, M. J. Latimer, Y. Pushkar, J. Biesiadka, B. Loll, W. Saenger, J. Messinger, A. Zouni and V. K. Yachandra, Science, 2006, 314, 821–825 CrossRef CAS PubMed.
- Y. Pushkar, J. Yano, P. Glatzel, J. Messinger, A. Lewis, K. Sauer, U. Bergmann and V. Yachandra, J. Biol. Chem., 2007, 282, 7198–7208 CrossRef CAS PubMed.
- J. Yano, Y. Pushkar, P. Glatzel, A. Lewis, K. Sauer, J. Messinger, U. Bergmann and V. Yachandra, J. Am. Chem. Soc., 2005, 127, 14974–14975 CrossRef CAS PubMed.
- C. Glöckner, J. Kern, M. Broser, A. Zouni, V. Yachandra and J. Yano, J. Biol. Chem., 2013, 288, 22607–22620 CrossRef PubMed.
- W. Liang, T. A. Roelofs, R. M. Cinco, A. Rompel, M. J. Latimer, W. O. Yu, K. Sauer, M. P. Klein and V. K. Yachandra, J. Am. Chem. Soc., 2000, 122, 3399–3412 CrossRef CAS PubMed.
- D. A. Pantazis, M. Orio, T. Petrenko, S. Zein, E. Bill, W. Lubitz, J. Messinger and F. Neese, Chem.–Eur. J., 2009, 15, 5108–5123 CrossRef CAS PubMed.
- C. Baffert, M. Orio, D. A. Pantazis, C. Duboc, A. G. Blackman, G. Blondin, F. Neese, A. Deronzier and M.-N. Collomb, Inorg. Chem., 2009, 48, 10281–10288 CrossRef CAS PubMed.
- M. Orio, D. A. Pantazis, T. Petrenko and F. Neese, Inorg. Chem., 2009, 48, 7251–7260 CrossRef CAS PubMed.
- S. Schinzel and M. Kaupp, Can. J. Chem., 2009, 87, 1521–1539 CrossRef CAS.
- J. Schraut, A. V. Arbuznikov, S. Schinzel and M. Kaupp, ChemPhysChem, 2011, 12, 3170–3179 CrossRef CAS PubMed.
- V. Krewald, F. Neese and D. A. Pantazis, J. Am. Chem. Soc., 2013, 135, 5726–5739 CrossRef CAS PubMed.
- J. H. Robblee, J. Messinger, R. M. Cinco, K. L. McFarlane, C. Fernandez, S. A. Pizarro, K. Sauer and V. K. Yachandra, J. Am. Chem. Soc., 2002, 124, 7459–7471 CrossRef CAS PubMed.
- H. Dau and M. Haumann, Coord. Chem. Rev., 2008, 252, 273–295 CrossRef CAS PubMed.
- R. M. Cinco, J. H. Robblee, A. Rompel, C. Fernandez, V. K. Yachandra, K. Sauer and M. P. Klein, J. Phys. Chem. B, 1998, 102, 8248–8256 CrossRef CAS PubMed.
- R. M. Cinco, K. L. McFarlane Holman, J. H. Robblee, J. Yano, S. A. Pizarro, E. Bellacchio, K. Sauer and V. K. Yachandra, Biochemistry, 2002, 41, 12928–12933 CrossRef CAS PubMed.
- Y. Pushkar, J. Yano, K. Sauer, A. Boussac and V. K. Yachandra, Proc. Natl. Acad. Sci. U. S. A., 2008, 105, 1879–1884 CrossRef CAS PubMed.
- H. Dau and M. Haumann, J. Synchrotron Radiat., 2003, 10, 76–85 CrossRef CAS PubMed.
- M.-F. Charlot, A. Boussac and G. Blondin, Biochim. Biophys. Acta, Bioenerg., 2005, 1708, 120–132 CrossRef CAS PubMed.
- F. Neese, Wiley Interdiscip. Rev.: Comput. Mol. Sci., 2012, 2, 73–78 CrossRef CAS.
- E. van Lenthe, E. J. Baerends and J. G. Snijders, J. Chem. Phys., 1993, 99, 4597–4610 CrossRef CAS PubMed.
- E. van Lenthe, E. J. Baerends and J. G. Snijders, J. Chem. Phys., 1994, 101, 9783–9792 CrossRef CAS PubMed.
- C. van Wüllen, J. Chem. Phys., 1998, 109, 392–399 CrossRef PubMed.
- M. Filatov and D. Cremer, Mol. Phys., 2003, 101, 2295–2302 CrossRef CAS.
- S. Grimme, J. Antony, S. Ehrlich and H. Krieg, J. Chem. Phys., 2010, 132, 154104–154119 CrossRef PubMed.
- J. P. Perdew, Phys. Rev. B: Condens. Matter Mater. Phys., 1986, 33, 8822–8824 CrossRef.
- A. D. Becke, Phys. Rev. A: At., Mol., Opt. Phys., 1988, 38, 3098–3100 CrossRef CAS.
- D. A. Pantazis, X. Y. Chen, C. R. Landis and F. Neese, J. Chem. Theory Comput., 2008, 4, 908–919 CrossRef CAS.
- F. Weigend and R. Ahlrichs, Phys. Chem. Chem. Phys., 2005, 7, 3297–3305 RSC.
- F. Weigend, Phys. Chem. Chem. Phys., 2006, 8, 1057–1065 RSC.
- A. Klamt and D. Schüürman, J. Chem. Soc., Perkin Trans. 2, 1993, 799–805 RSC.
- V. N. Staroverov, G. E. Scuseria, J. Tao and J. P. Perdew, J. Chem. Phys., 2003, 119, 12129–12137 CrossRef CAS PubMed.
- F. Neese, F. Wennmohs, A. Hansen and U. Becker, Chem. Phys., 2009, 356, 98–109 CrossRef CAS PubMed.
- M. Roemelt, M. A. Beckwith, C. Duboc, M.-N. Collomb, F. Neese and S. DeBeer, Inorg. Chem., 2012, 51, 680–687 CrossRef CAS PubMed.
- M. Sugiura, F. Rappaport, K. Brettel, T. Noguchi, A. W. Rutherford and A. Boussac, Biochemistry, 2004, 43, 13549–13563 CrossRef CAS PubMed.
- E. Reijerse, F. Lendzian, R. Isaacson and W. Lubitz, J. Magn. Reson., 2012, 214, 237–243 CrossRef CAS PubMed.
- A. Schweiger and G. Jeschke, Principles of pulse electron paramagnetic resonance, Oxford University Press, Oxford, 2001 Search PubMed.
- U. Bossek, H. Hummel, T. Weyhermüller, K. Wieghardt, S. Russell, L. van der Wolf and U. Kolb, Angew. Chem., Int. Ed. Engl., 1996, 35, 1552–1554 CrossRef CAS.
- P. E. M. Siegbahn, ChemPhysChem, 2011, 12, 3274–3280 CrossRef CAS PubMed.
- J. Schraut and M. Kaupp, Chem.–Eur. J., 2014, 20, 7300–7308 CrossRef CAS PubMed.
- A. Robertazzi, A. Galstyan and E. W. Knapp, Biochim. Biophys. Acta, Bioenerg., 2014, 1837, 1316–1321 CrossRef CAS PubMed.
- P. E. M. Siegbahn, Phys. Chem. Chem. Phys., 2014, 16, 11893–11900 RSC.
- L. Rapatskiy, N. Cox, A. Savitsky, W. M. Ames, J. Sander, M. M. Nowaczyk, M. Rögner, A. Boussac, F. Neese, J. Messinger and W. Lubitz, J. Am. Chem. Soc., 2012, 134, 16619–16634 CrossRef CAS PubMed.
- C. P. Aznar and R. D. Britt, Philos. Trans. R. Soc., B, 2002, 357, 1359–1366 CrossRef CAS PubMed.
- N. Cox, W. Ames, B. Epel, L. V. Kulik, L. Rapatskiy, F. Neese, J. Messinger, K. Wieghardt and W. Lubitz, Inorg. Chem., 2011, 50, 8238–8251 CrossRef CAS PubMed.
- L. V. Kulik, B. Epel, W. Lubitz and J. Messinger, J. Am. Chem. Soc., 2005, 127, 2392–2393 CrossRef CAS PubMed.
- A. Klauss, M. Haumann and H. Dau, Proc. Natl. Acad. Sci. U. S. A., 2012, 109, 16035–16040 CrossRef CAS PubMed.
- T. Noguchi, Philos. Trans. R. Soc., B, 2008, 363, 1189–1195 CrossRef CAS PubMed.
- H. Suzuki, M. Sugiura and T. Noguchi, Biochemistry, 2008, 47, 11024–11030 CrossRef CAS PubMed.
- H. Nilsson, T. Krupnik, J. Kargul and J. Messinger, Biochim. Biophys. Acta, Bioenerg., 2014, 1837, 1257–1262 CrossRef CAS PubMed.
- P. Glatzel, H. Schroeder, Y. Pushkar, T. Boron, S. Mukherjee, G. Christou, V. L. Pecoraro, J. Messinger, V. K. Yachandra, U. Bergmann and J. Yano, Inorg. Chem., 2013, 52, 5642–5644 CrossRef CAS PubMed.
- J. L. Zimmermann and A. W. Rutherford, Biochim. Biophys. Acta, Bioenerg., 1984, 767, 160–167 CrossRef CAS.
- G. W. Brudvig, J. L. Casey and K. Sauer, Biochim. Biophys. Acta, Bioenerg., 1983, 723, 366–371 CrossRef CAS.
- M. Haumann, O. Bögershausen and W. Junge, FEBS Lett., 1994, 355, 101–105 CrossRef CAS.
- M. Haumann, O. Bögershausen, D. Cherepanov, R. Ahlbrink and W. Junge, Photosynth. Res., 1997, 51, 193–208 CrossRef CAS.
- W. Hillier and T. Wydrzynski, Biochemistry, 2000, 39, 4399–4405 CrossRef CAS PubMed.
- M. Iizasa, H. Suzuki and T. Noguchi, Biochemistry, 2010, 49, 3074–3082 CrossRef CAS PubMed.
- R. J. Debus, Coord. Chem. Rev., 2008, 252, 244–258 CrossRef CAS PubMed.
- S. Styring and A. W. Rutherford, Biochemistry, 1987, 26, 2401–2405 CrossRef CAS.
- S. Styring and A. W. Rutherford, Biochim. Biophys. Acta, Bioenerg., 1988, 933, 378–387 CrossRef CAS.
- J. H. Robblee, R. M. Cinco and V. K. Yachandra, Biochim. Biophys. Acta, Bioenerg., 2001, 1503, 7–23 CrossRef CAS.
- L. V. Kulik, W. Lubitz and J. Messinger, Biochemistry, 2005, 44, 9368–9374 CrossRef CAS PubMed.
- T. Ichino and Y. Yoshioka, Chem. Phys. Lett., 2012, 545, 107–111 CrossRef CAS PubMed.
- M. Lundberg and P. E. M. Siegbahn, Phys. Chem. Chem. Phys., 2004, 6, 4772–4780 RSC.
- Z. Deák, S. Peterson, P. Geijer, K. A. Åhrling and S. Styring, Biochim. Biophys. Acta, Bioenerg., 1999, 1412, 240–249 CrossRef.
- B. Nöring, D. Shevela, G. Renger and J. Messinger, Photosynth. Res., 2008, 98, 251–260 CrossRef PubMed.
- T. Afrati, C. Dendrinou-Samara, C. R. Raptopoulou, A. Terzis, V. Tangoulis and D. P. Kessissoglou, Angew. Chem., Int. Ed., 2002, 41, 2148–2150 CrossRef CAS.
- M. Alexiou, C. Dendrinou-Samara, A. Karagianni, S. Biswas, C. M. Zaleski, J. Kampf, D. Yoder, J. E. Penner-Hahn, V. L. Pecoraro and D. P. Kessissoglou, Inorg. Chem., 2003, 42, 2185–2187 CrossRef CAS PubMed.
- M. K. Chan and W. H. Armstrong, J. Am. Chem. Soc., 1990, 112, 4985–4986 CrossRef CAS.
- T. C. Stamatatos and G. Christou, Philos. Trans. R. Soc., A, 2008, 366, 113–125 CrossRef CAS PubMed.
- D. A. Pantazis, V. Krewald, M. Orio and F. Neese, Dalton Trans., 2010, 39, 4959–4967 RSC.
- B. Brena, P. E. M. Siegbahn and H. Ågren, J. Am. Chem. Soc., 2012, 134, 17157–17167 CrossRef CAS PubMed.
- S. DeBeer George, T. Petrenko and F. Neese, J. Phys. Chem. A, 2008, 112, 12936–12943 CrossRef CAS PubMed.
- P. Chandrasekaran, S. C. E. Stieber, T. J. Collins, J. L. Que, F. Neese and S. DeBeer, Dalton Trans., 2011, 40, 11070–11079 RSC.
- V. Krewald, B. Lassalle-Kaiser, T. T. Boron, C. J. Pollock, J. Kern, M. A. Beckwith, V. K. Yachandra, V. L. Pecoraro, J. Yano, F. Neese and S. DeBeer, Inorg. Chem., 2013, 52, 12904–12914 CrossRef CAS PubMed.
- F. A. Lima, R. Bjornsson, T. Weyhermuller, P. Chandrasekaran, P. Glatzel, F. Neese and S. DeBeer, Phys. Chem. Chem. Phys., 2013, 15, 20911–20920 RSC.
- D. F. Leto and T. A. Jackson, Inorg. Chem., 2014, 53, 6179–6194 CrossRef CAS PubMed.
- N. Leidel, P. Chernev, K. G. V. Havelius, S. Ezzaher, S. Ott and M. Haumann, Inorg. Chem., 2012, 51, 4546–4559 CrossRef CAS PubMed.
- T. J. Penfold, S. Karlsson, G. Capano, F. A. Lima, J. Rittmann, M. Reinhard, M. H. Rittmann-Frank, O. Braem, E. Baranoff, R. Abela, I. Tavernelli, U. Rothlisberger, C. J. Milne and M. Chergui, J. Phys. Chem. A, 2013, 117, 4591–4601 CrossRef CAS PubMed.
- A. C. Bowman, S. Sproules and K. Wieghardt, Inorg. Chem., 2012, 51, 3707–3717 CrossRef CAS PubMed.
- R. Sarangi, L. Yang, S. G. Winikoff, L. Gagliardi, C. J. Cramer, W. B. Tolman and E. I. Solomon, J. Am. Chem. Soc., 2011, 133, 17180–17191 CrossRef CAS PubMed.
- J. Yano, J. Robblee, Y. Pushkar, M. A. Marcus, J. Bendix, J. M. Workman, T. J. Collins, E. I. Solomon, S. DeBeer George and V. K. Yachandra, J. Am. Chem. Soc., 2007, 129, 12989–13000 CrossRef CAS PubMed.
- E. R. Hall, C. J. Pollock, J. Bendix, T. J. Collins, P. Glatzel and S. DeBeer, J. Am. Chem. Soc., 2014, 136, 10076–10084 CrossRef CAS PubMed.
- P. J. Riggs-Gelasco, R. Mei, C. F. Yocum and J. E. Penner-Hahn, J. Am. Chem. Soc., 1996, 118, 2387–2399 CrossRef CAS.
- C. Goussias, N. Ioannidis and V. Petrouleas, Biochemistry, 1997, 36, 9261–9266 CrossRef CAS PubMed.
- M. Higuchi, T. Noguchi and K. Sonoike, Biochim. Biophys. Acta, Bioenerg., 2003, 1604, 151–158 CrossRef CAS.
- X. Li, E. M. Sproviero, U. Ryde, V. S. Batista and G. Chen, Int. J. Quantum Chem., 2013, 113, 474–478 CrossRef CAS.
- W. M. C. Sameera, C. J. McKenzie and J. E. McGrady, Dalton Trans., 2011, 40, 3859–3870 RSC.
- K. Yamaguchi, Y. Takahara and T. Fueno, in Applied Quantum Chemistry, ed. V. H. Smith Jr, H. F. Scheafer III and K. Morokuma, D. Reidel, Boston, 1986, pp. 155–184 Search PubMed.
- P. E. M. Siegbahn and R. H. Crabtree, J. Am. Chem. Soc., 1999, 121, 117–127 CrossRef CAS.
- P. E. M. Siegbahn, Chem.–Eur. J., 2006, 12, 9217–9227 CrossRef CAS PubMed.
- I. Zaharieva, M. M. Najafpour, M. Wiechen, M. Haumann, P. Kurz and H. Dau, Energy Environ. Sci., 2011, 4, 2400–2408 CAS.
- C. Kupitz, S. Basu, I. Grotjohann, R. Fromme, N. A. Zatsepin, K. N. Rendek, M. S. Hunter, R. L. Shoeman, T. A. White, D. Wang, D. James, J.-H. Yang, D. E. Cobb, B. Reeder, R. G. Sierra, H. Liu, A. Barty, A. L. Aquila, D. Deponte, R. A. Kirian, S. Bari, J. J. Bergkamp, K. R. Beyerlein, M. J. Bogan, C. Caleman, T.-C. Chao, C. E. Conrad, K. M. Davis, H. Fleckenstein, L. Galli, S. P. Hau-Riege, S. Kassemeyer, H. Laksmono, M. Liang, L. Lomb, S. Marchesini, A. V. Martin, M. Messerschmidt, D. Milathianaki, K. Nass, A. Ros, S. Roy-Chowdhury, K. Schmidt, M. Seibert, J. Steinbrener, F. Stellato, L. Yan, C. Yoon, T. A. Moore, A. L. Moore, Y. Pushkar, G. J. Williams, S. Boutet, R. B. Doak, U. Weierstall, M. Frank, H. N. Chapman, J. C. H. Spence and P. Fromme, Nature, 2014, 513, 261–265 CrossRef CAS PubMed.
- J. Kern, R. Tran, R. Alonso-Mori, S. Koroidov, N. Echols, J. Hattne, M. Ibrahim, S. Gul, H. Laksmono, R. G. Sierra, R. J. Gildea, G. Han, J. Hellmich, B. Lassalle-Kaiser, R. Chatterjee, A. S. Brewster, C. A. Stan, C. Glöckner, A. Lampe, D. DiFiore, D. Milathianaki, A. R. Fry, M. M. Seibert, J. E. Koglin, E. Gallo, J. Uhlig, D. Sokaras, T.-C. Weng, P. H. Zwart, D. E. Skinner, M. J. Bogan, M. Messerschmidt, P. Glatzel, G. J. Williams, S. Boutet, P. D. Adams, A. Zouni, J. Messinger, N. K. Sauter, U. Bergmann, J. Yano and V. K. Yachandra, Nat. Commun., 2014, 5, 4371 CAS.
Footnote |
| † Electronic supplementary information (ESI) available: Additional methodological details and discussion, Tables S1–S10, Fig. S1–S16, spin populations, parameters of optimized structures, experimental details and analysis of 55Mn ENDOR at 2.5 K, analysis of calculated Mn K pre-edge XAS, discussion of reduced S states. See DOI: 10.1039/c4sc03720k |
| This journal is © The Royal Society of Chemistry 2015 |