DOI:
10.1039/C4SC01963F
(Edge Article)
Chem. Sci., 2015,
6, 1832-1845
The energy blocker inside the power house: mitochondria targeted delivery of 3-bromopyruvate†
Received
1st July 2014
, Accepted 24th October 2014
First published on 27th October 2014
Abstract
A key hallmark of many aggressive cancers is accelerated glucose metabolism. The enzymes that catalyze the first step of glucose metabolism are hexokinases. Elevated levels of hexokinase 2 (HK2) are found in cancer cells, but only in a limited number of normal tissues. Metabolic reprogramming of cancer cells using the energy blocker 3-bromopyruvate (3-BP), which inhibits HK2, has the potential to provide tumor-specific anticancer agents. However, the unique structural and functional characteristics of mitochondria prohibit selective subcellular targeting of 3-BP to modulate the function of this organelle for therapeutic gain. A mitochondria-targeted gold nanoparticle (T-3-BP-AuNP), decorated with 3-BP and delocalized lipophilic triphenylphosphonium cations to target the mitochondrial membrane potential (Δψm), was developed for delivery of 3-BP to cancer cell mitochondria by taking advantage of the higher Δψm in cancer cells compared to normal cells. In vitro studies demonstrated an enhanced anticancer activity of T-3-BP-AuNPs compared to the non-targeted construct NT-3-BP-AuNP or free 3-BP. The anticancer activity of T-3-BP-AuNPs was further enhanced upon laser irradiation by exciting the surface plasmon resonance band of AuNP and thereby utilizing a combination of 3-BP chemotherapeutic and AuNP photothermal effects. The lower toxicity of T-3-BP-NPs in normal mesenchymal stem cells indicated that these NPs preferentially kill cancer cells. T-3-BP-AuNPs showed an enhanced ability to modulate cancer cell metabolism by inhibiting glycolysis as well as demolishing mitochondrial oxidative phosphorylation. Our findings demonstrate that concerted chemo-photothermal treatment of glycolytic cancer cells with a single NP capable of targeting mitochondria, mediating simultaneous release of a glycolytic inhibitor and photothermal ablation, may have promise as a new anticancer therapy.
Introduction
The majority of cancers use aerobic glycolysis, which is accompanied by high rates of glucose consumption and lactate production, even when oxygen is available for oxidative phosphorylation (OXPHOS).1 Hexokinase (HK) is a key enzyme involved in the first step of the glycolysis pathway in transferring a phosphate group from adenosine triphosphate (ATP) to glucose to produce glucose-6-phosphate. There are four different hexokinase isoforms (HK1–4) in mammalian cells, which differ in their expression, subcellular localizations, and catalytic properties.2 HK1 and 2, with their ability to bind to mitochondria through their interactions with the voltage dependent anion channel (VDAC), play significant roles in mitochondrial homeostasis.3 The highly glycolytic environment of aggressive cancers requires an up-regulation of the HK2 protein level in cancer cells. In cancer cells, approximately 80% of HK2 is associated with the mitochondria though the interaction with VDAC.4 Mitochondria-bound HK2 can acquire the required ATP for glucose phosphorylation to accelerate the glycolytic rate and stimulate the tricarboxylic acid (TCA) cycle in the mitochondria. The interactions of VDAC and HK2 on the outer mitochondrial membrane (OMM) not only increase mitochondrial energy metabolism, but also down-regulate the apoptotic pathway by suppressing cytochrome c release. An increased association of HK2 with the mitochondria in cancer cells via VDAC, which has privileged access to mitochondrial ATP and regulates the opening of the mitochondrial permeability transition (MPT) pore, causes resistance to apoptosis in cancer cells.5 This significant translocation of HK2 from the cytoplasm to the OMM in cancer cells, combined with its important roles in the glycolytic pathway, makes HK2 an attractive target for anticancer therapeutic modality development.6 A brominated derivative of pyruvic acid, 3-bromopyruvate (3-BP) is an alkylating agent that selectively kills cancer cells by inhibiting HK2.7 3-BP has the ability to suppress the glycolytic capacity of tumor cells by abolishing the activity of mitochondrially-bound HK2.8 3-BP also participates in the inhibition of the mitochondrial succinate dehydrogenase, mitochondrial phosphate carrier (PiC), and adenine nucleotide carrier (ANC).
The characteristic alterations of mitochondrial function in cancer, the association of HK2 to the OMM via VDAC, the ability of 3-BP to inhibit HK2, and the subsequent apoptosis of cancer cells led to many studies to evaluate the therapeutic potential of 3-BP. However, 3-BP showed limited clinical potential, caused by non-specificity such as the interaction with HK1 or other metabolic proteins and systemic toxicity.9,10 Once inside cells, 3-BP has several non-glycolytic targets, such as V-ATPases, sarcoplasmic reticulum Ca2+-ATPases, carbonic anhydrases, and histone deacetylases. A family of proton-coupled monocarboxylate transporters (MCTs) are involved in the transport of monocarboxylic acids such as lactate, pyruvate, butyrate, and acetate across the plasma membrane. Although these transporters are up-regulated in cancer cells to compensate for the increased lactic acid production and consequent efflux from the cell, we hypothesized that 3-BP will face a tremendous challenge in its uptake by the MCTs in cancer cells. To circumvent this, mitochondria-targeted local delivery strategies can be extremely important to enhance the overall treatment efficacy and to reduce the toxic effects of 3-BP. A variety of targeted nanoparticles (NPs) have the ability to take current medicine to the next level through precise delivery, and improving the pharmacokinetics (PK) and biodistribution (bioD) of small molecule based drugs.11 One of the most studied nanostructures in medicine are gold NPs (AuNPs), which can be constructed in different sizes and shapes, and have the ability to be decorated with drug molecules and targeting moieties.12 Furthermore, when AuNPs are illuminated with light of wavelengths of 650–900 nm, the photons will be strongly absorbed or scattered and the absorbed light can be transformed into heat, a process known as the photothermal effect, causing an increase in temperature. The heat generated from the photothermal effect can be used to destroy cancer cells directly.13 With these properties in mind, we hypothesized that the use of a mitochondria-targeted AuNP system will allow the delivery of 3-BP specifically to the mitochondria and subsequent laser irradiation will further enhance the therapeutic efficacy of the engineered construct by the photothermal effect. In this article, we highlight the findings related to a remarkable increase in the anti-tumor activity of 3-BP by mitochondrial delivery using a triphenylphosphonium (TPP) cation-modified AuNP (T-3-BP-AuNP) (Scheme 1), efficient inhibition of glycolysis, and subsequent changes in the mitochondrial bioenergetics.
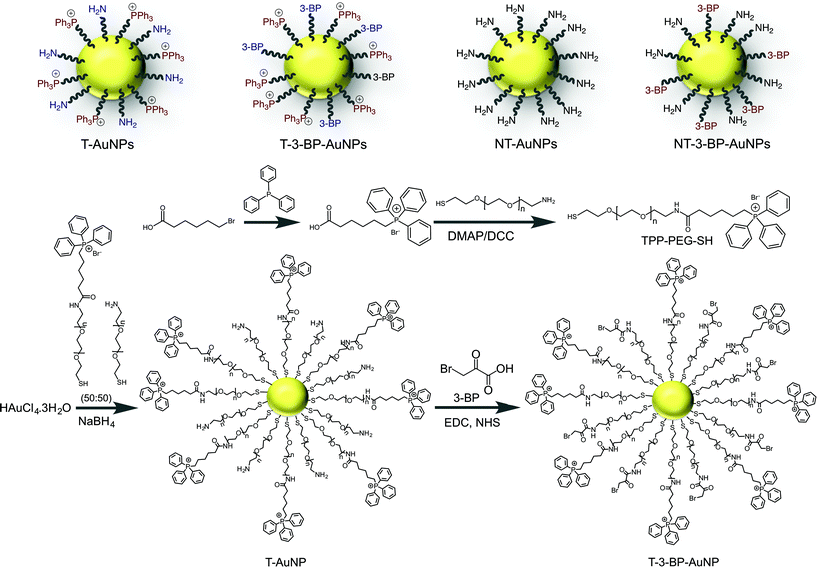 |
| | Scheme 1 Engineered AuNP and control NPs used in the mitochondria-targeted delivery of 3-BP. Synthesis of the mitochondria-targeted TPP-modified PEG ligand and T-AuNP, and conjugation of 3-BP. | |
Results and discussion
AuNPs for targeted delivery of 3-BP
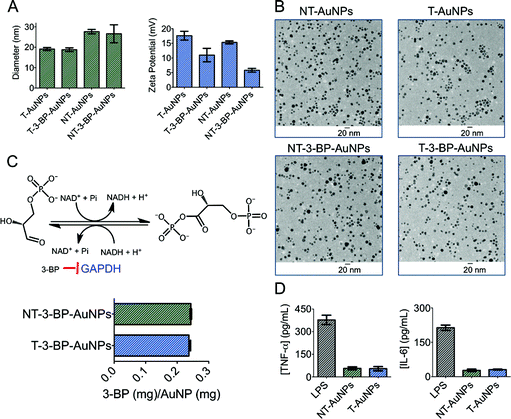
AuNPs are widely used in the delivery of therapeutics due to their unique surface chemistry, tunable sizes and shapes, and optical properties.14 However, one of the important issues in the clinical translation of AuNPs is their toxicological effect. A recent study demonstrated that unmodified citrate-coated AuNPs can cause inhibition of cell proliferation in a concentration- and size-dependent manner.15 Therefore, it is very important to design a biocompatible surface-functionalized AuNP for the delivery of 3-BP inside mitochondria. Polyethylene glycol (PEG) is extensively used to protect surfaces from nonspecific interactions with biomolecules.16 To deliver 3-BP inside the mitochondria, we constructed AuNPs covered with lipophilic cationic-TPP moieties attached to PEG. The lipophilic TPP cations easily permeate lipid bilayers, driven by the plasma membrane potential (∼−30 to −60 mV), to enter the cytoplasm and then concentrate several hundred-fold into the mitochondria due to the large mitochondrial membrane potential (Δψm) (∼−150 to −180 mV) maintained across the inner mitochondrial membrane (IMM). To construct T-AuNPs, we synthesized TPP–PEG–SH (Fig. S1–S3) by reacting NH2–PEG–SH with TPP–(CH2)5–COOH (Scheme 1). The –TPP group in TPP–PEG–SH allows for mitochondria targeting and the –SH acts as an anchoring group to the AuNP surface. T-AuNPs were synthesized through the reduction of HAuCl4·3H2O and simultaneous stabilization with a mixture of NH2–PEG–SH and TPP–PEG–SH. The amine groups from T-AuNPs were conjugated with 3-BP using a standard amide coupling reaction to give T-3-BP-AuNPs (Scheme 1). To investigate the advantages of delivering 3-BP inside the mitochondria, we constructed a non-targeted system, NT-AuNP, as a control. NT-AuNPs were constructed from HAuCl4·3H2O using NH2–PEG–SH and the amine groups were used to conjugate 3-BP to generate NT-3-BP-AuNPs. The AuNPs were characterized using dynamic light scattering (DLS), zeta potential measurements, and transmission electron microscopy (TEM) (Fig. 1A and B and S4, and Table S1 in ESI†). The intensity-weighted averages or the Z averages of these NPs were mostly between 20 and 30 nm and were narrowly distributed. In our previous studies, we demonstrated that TPP containing positively charged NPs of suitable size have the ability to enter the mitochondria of cells, whereas negatively charged particles, or NPs that are not highly positively charged or are larger in size, are mostly distributed in the cytosol.17 Zeta potential measurements indicated that the T-AuNP surface is positively charged and the conjugation of 3-BP on the surface lowered the potential by ∼6 mV. Non-targeted NPs with surface –NH2 groups showed a positive zeta potential and the conjugation of 3-BP diminished the positive charge by ∼10 mV. The small sizes and positively charged surfaces (coated with highly lipophilic cationic TPP moieties) of T-3-BP-AuNPs play significant roles in their navigation to the mitochondria. The morphology of these NPs was mostly spherical, as demonstrated by TEM (Fig. 1B). To demonstrate the versatility in biomedical applications, the dispersion stability of these AuNPs was evaluated by freeze drying the NPs and assessing the formation of aggregates and change in color upon making an aqueous suspension at a concentration of 10 mg mL−1. No visible aggregation or change in the color was observed (Fig. S5 in ESI†) and the resuspended NPs demonstrated similar sizes and zeta potential. The T- and NT-AuNPs showed surface plasmon bands at 540 and 523 nm, respectively (Fig. S6 in ESI†). Upon conjugation of 3-BP on the surface of both T- and NT-AuNPs, no changes in the diameter, nor broadening or red shift of the surface plasmon band were observed indicating that no aggregation of AuNPs occurred during surface modification.
 |
| | Fig. 1 (A) Characterization of different AuNPs using DLS. (B) TEM of the AuNPs. (C) Quantification of 3-BP using GAPDH assay. (D) Non-immunogenic behavior of NT- and T-AuNPs determined using ELISA. | |
It is a challenging task to quantify 3-BP in AuNPs using conventional analytical methods. We therefore devised an enzyme inhibition assay to quantify the coupling efficiency of 3-BP on the NP surface based on the fact that glyceraldehyde-3-phosphate dehydrogenase (GAPDH) is an intracellular target of 3-BP (Fig. 1C). Pyruvylation of GAPDH by 3-BP causes inhibition of the enzymatic function. The enzyme activity of GAPDH can be determined using a KDalert™ GAPDH assay kit. Generation of a standard curve (Fig. S6†) by treating GAPDH with known concentrations of 3-BP, dissolution of the Au core of T- and NT-3-BP-AuNPs with potassium iodide (KI), and subsequent treatment with GAPDH allowed us to quantify the amount of 3-BP present on the NP surface (Fig. 1C). Similar coupling efficiencies of 3-BP on the surfaces of T- and NT-AuNPs were noted (∼8%, Table S1 in ESI†).
Macrophages are one of the principal immune effector cells; hence, the immunological response from RAW 264.7 macrophage cells when exposed to T- and NT-AuNPs was studied by analyzing the production of pro-inflammatory cytokines, tumor necrosis factor alfa (TNF-α) and interleukin-6 (IL-6), using the enzyme-linked immunosorbent assay (ELISA) (Fig. 1D). Neither the control cells or the cells treated with T- and NT-AuNPs showed any secretion of either TNF-α or IL-6. Both the cytokines were detected in the cells treated with bacterial lipopolysaccharide (LPS) as a control (Fig. 1D). These results indicate that the AuNPs do not elicit an immunological response and do not induce the production of pro-inflammatory cytokines, even at a high concentration of 10 mg mL−1.
HK2 binding affinity of released 3-BP from T- and NT-AuNPs
The ability of 3-BP from T-3-BP-AuNPs and NT-3-BP-AuNPs to covalently modify HK2 was tested using human HK2 recombinant protein of molecular mass 104.1 kDa expressed in Escherichia coli. Incubation of HK2 with T-3-BP-AuNPs and NT-3-BP-AuNPs and quantification of 3-BP-bound HK2 using a bicinchoninic acid (BCA) assay after dissolving the Au core with KI indicated that 3-BP from both T- and NT-AuNPs has the ability to covalently bind to HK2 (Fig. 2A). T- and NT-AuNPs without 3-BP did not show the presence of any protein under these conditions (Fig. S7 in ESI†). These data rule out the possibility that HK2 is simply adsorbed on the surface without interaction with 3-BP (Fig. S7 in ESI†).
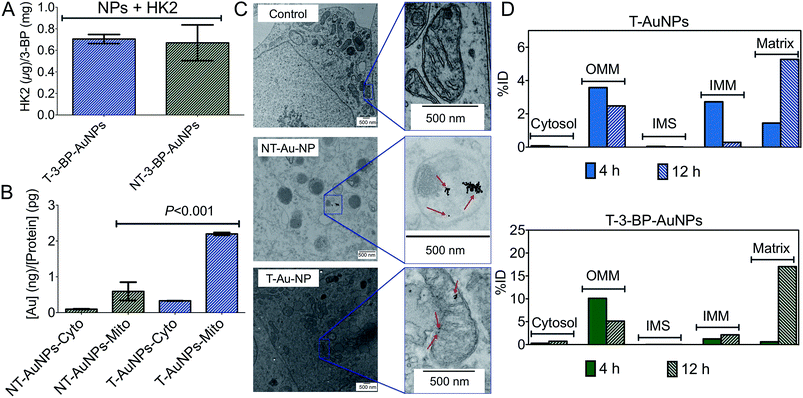 |
| | Fig. 2 (A) HK2 binding profile of T-3-BP-AuNPs and NT-3-BP-AuNPs. Mitochondrial and cytosolic distribution of T-AuNPs and NT-AuNPs in PC3 cells from (B) ICP-MS and (C) cellular TEM. (D) Time-dependent distribution of T-AuNPs and T-3-BP-AuNPs in mitochondrial compartments of PC3 cells. Cyto: cytosolic fraction; Mito: mitochondrial fraction. The data are presented as percent-injected dose (%ID). | |
Intracellular location of T-3-BP-AuNPs
3-BP has several intracellular targets, and thus the distribution of the T-AuNPs is the key factor in determining the efficacy of 3-BP. Where T-AuNPs or NT-AuNPs are located is essential information for understanding intracellular compartmentation of 3-BP. We first investigated the distribution of NT- and T-AuNPs in the mitochondria and cytosol of prostate cancer (PCa) PC3 cells. Treatment of these cells with the NPs for 12 h, isolation of mitochondrial (mito) and cytosolic (cyto) fractions, and quantification of gold by inductively coupled plasma mass spectrometry (ICP-MS) indicated that the overall uptake of T-AuNPs was higher than that of NT-AuNPs (Fig. 2B). Most of the T-AuNPs were associated with the mitochondria. Only a small fraction of the NT-AuNPs were associated with the mitochondria, which might be attributed to the positively charged amine groups on the surface of these NPs. The highly lipophilic cationic –TPP groups18 are responsible for the greater association of the T-AuNPs with the mitochondria. We also investigated intracellular trafficking of T- and NT-AuNPs in PC3 cells using conventional TEM. The NT-AuNPs were found inside non-mitochondrial compartments, and the T-AuNPs were located inside the mitochondria of these cells (Fig. 2C).
We next assessed the exact location of the T-AuNPs and T-3-BP-AuNPs inside the mitochondria and investigated the time dependence of NP accumulation in different mitochondrial compartments. PC3 cells were treated with T-AuNPs and T-3-BP-AuNPs for 4 h and 12 h, and the mitochondrial sub-fractions, OMM, IMM, the intermembrane space (IMS), and matrix, were isolated from the treated cells at both the time points, and gold was quantified in these fractions using ICP-MS (Fig. 2D). T-AuNPs and T-3-BP-AuNPs demonstrated very similar patterns in their mitochondrial distribution; however, the overall concentrations of T-3-BP-AuNPs were higher in the mitochondrial compartments compared to the T-AuNPs without any 3-BP. At an early stage after 4 h incubation, both T-AuNPs and T-3-BP-AuNPs were found in the OMM, and at 12 h, almost all the T-AuNPs and T-3-BP-AuNPs were located inside the matrix.
These observations indicate that the T-3-BP-AuNPs distributed in the OMM will be able to modify HK2 bound to VDAC. Complete localization of T-3-BP-AuNPs at 12 h might also be due to the opening of the VDACs upon deactivation of HK2 by 3-BP. The time-dependent intra-mitochondrial distribution patterns of T-3-BP-AuNPs indicated that the 3-BP delivered by T-AuNPs will be able to attack all of its intracellular targets for maximum efficacy. The exact mechanism of how 3-BP will be released from the NPs in the cellular environment warrants further investigation. However, various proteases within the mitochondria regulate mitochondrial biogenesis to ensure complete degradation of excess or damaged proteins and we believe that the T-NPs will take advantage of these proteases to release 3-BP.
Anti-proliferative effects of T-3-BP-AuNPs
We determined the effect of AuNPs on the proliferation of two different PCa cell lines, PC3 and DU145 cells, using the 3-(4,5-dimethylthiazol-2-yl)-2,5-diphenyltetrazolium bromide (MTT) assay. The widely used PCa cell lines PC3 and DU145 show differences in their metabolic phenotype. Both the DU145 and PC3 lines have higher rates of lactate production; however, these cell lines differ in their glycolytic rates. PC3 cells show higher mRNA levels for glycolytic enzymes.19 The glycolytic reliance of PC3 and DU145 cells is believed to be due to OXPHOS insufficiencies related to mitochondrial dysfunction. T-3-BP-AuNPs exhibited the highest efficacy in inhibiting the proliferation of both PC3 and DU145 cells, NT-3-BP-AuNPs demonstrated a significantly reduced inhibition compared to the T-3-BP-AuNPs, and free 3-BP showed only a modest inhibition (Fig. 3A, Table 1). Consistent with the above observations, T-3-BP-AuNPs exhibited an enhanced cytotoxic effect on breast cancer MCF-7 cells compared to NT-3-BP-AuNPs or free 3-BP (Fig. S8† and Table 1). No inhibition in cell growth was observed with T-AuNPs and NT-AuNPs without 3-BP (Fig. S8 in ESI,†Table 1). It is very interesting to note that T-3-BP-AuNPs showed highly cytotoxic behavior in cancer cells but these NPs demonstrated a negligible impact on normal human mesenchymal stem cells (hMSCs) (Fig. 3A). Hyperpolarization of Δψm is frequently observed in tumor cells and most carcinoma-derived cell lines show a higher Δψm than normal epithelial cells.20 We believe that the diminished toxicity of T-3-BP-AuNPs in normal hMSC cells is due to the lower mitochondrial accumulation of T-NPs by hMSCs. These findings provide proof of the concept demonstration that delivery of 3-BP to the mitochondria using the NP system results in enhanced uptake and cytotoxicity in cancer cells.
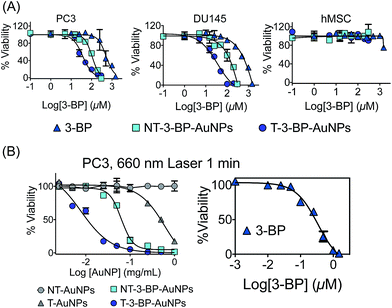 |
| | Fig. 3 (A) Cell viability in PC3, DU145 and hMSC cells after treatment with 3-BP, T-3-BP-AuNPs and NT-3-BP-AuNPs. Cell viability was assessed using the MTT assay after treatment with the indicated concentrations of the test articles for 72 h. The data are mean ± SD (n = 3 wells). (B) Cell viability of PC3 cells after treatment with T-AuNPs, NT-AuNPs, 3-BP, T-3-BP-AuNPs and NT-3-BP-AuNPs followed by 660 nm laser radiation for 1 min per well. The data are mean ± SD (n = 3 wells). | |
Table 1 IC50 values of the different constructs in different cells
|
|
PC3a (μM) |
DU145a (μM) |
MCF-7a (μM) |
PC3 + Laserb (μg mL−1) |
|
With respect to 3-BP.
With respect to AuNP.
With respect to 3-BP, IC50 = 0.34 μM.
|
| T-AuNPs |
N/A |
N/A |
N/A |
550 ± 90 |
| NT-AuNPs |
N/A |
N/A |
N/A |
N/A |
| 3-BP |
271 ± 9 |
541 ± 37 |
274 ± 36 |
N/Ac |
| T-3-BP-AuNPs |
13 ± 3 |
28 ± 8 |
1.4 ± 0.4 |
10 ± 3 |
| NT-3-BP-AuNPs |
45 ± 6 |
109 ± 7 |
29 ± 4 |
60 ± 3 |
Moreover, T-3-BP-AuNPs demonstrated an enhanced cytotoxic activity when combined with 660 nm laser irradiation compared to NT-3-BP-AuNPs or free 3-BP with laser treatment. It is interesting to note that T-AuNPs without any 3-BP showed an enhanced cytotoxicity under laser irradiation, whereas NT-AuNPs did not show any significant toxicity in the presence of photo-irradiation (Fig. 3B, Table 1). These findings suggest that the higher accumulation of T-AuNPs inside the mitochondria might be responsible for their toxicity under photo-irradiation by inducing local mitochondrial damage.21 Together, these results support that T-AuNP is highly effective for selective delivery of 3-BP, and T-3-BP-AuNPs demonstrated the effects of targeted chemotherapy and the photothermal effect. The pro-apoptotic effect of T-3-BP-AuNPs, NT-3-BP-AuNPs, and free 3-BP was studied in PC3 cells both in the dark and under 660 nm laser irradiation for 1 min (Fig. S8 in ESI†). Our data suggests that 3-BP can promote apoptosis at a much lower concentration when delivered with a mitochondria-targeted delivery system and the use of AuNPs as a delivery system further enhances its activity by utilizing the photothermal activity of gold nanocrystals.
Lactate reduction and ATP depletion
The final product of glycolysis is lactate. Hence, we quantified the intracellular and extracellular lactate levels in PC3 cells treated with 3-BP, T-3-BP-AuNPs, NT-3-BP-AuNPs, T-AuNP, and NT-AuNPs. Extracellular lactate levels were found to be much higher than those observed inside the cells (Fig. 4A and B). Our results showed that the levels of both intracellular and extracellular lactate declined with treatment with free 3-BP, T-3-BP-AuNPs, and NT-3-BP-AuNPs. This decrease was more significant in cells that were treated with T-3-BP-AuNPs compared to the cells treated with either 3-BP or 3-BP conjugated to NT-AuNPs (Fig. 4A and B). Treatment with T-3-BP-AuNPs, NT-3-BP-AuNPs, and 3-BP resulted in a decrease in the level of ATP in PC3 cells (Fig. 4C). The PC3 cells were found to be much more sensitive to T-3-BP-AuNPs than free 3-BP or NT-3-BP-AuNPs as inferred from the intracellular ATP levels at 6 h (Fig. 4C). The present data shows that T-3-BP-AuNPs have the ability to deplete ATP and reduce lactate levels at lower 3-BP concentrations compared to free 3-BP or NT-3-BP-AuNPs. These observations further support the importance of delivering 3-BP to the mitochondria in modulating its efficacy.
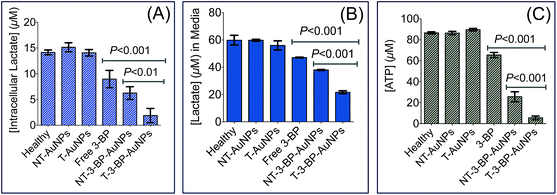 |
| | Fig. 4 Intracellular (A) and extracellular (B) lactate levels in PC3 cells after treatment with T-AuNP (1 mg mL−1), NT-AuNP (1 mg mL−1), T-3-BP-AuNP (14.1 μg mL−1 with respect to NP, 10 μM with respect to 3-BP), NT-3-BP-AuNP (13.7 μg mL−1 with respect to NP, 10 μM with respect to 3-BP) and free 3-BP (10 μM) for 6 h at 37 °C. (C) Changes in intracellular ATP content in PC3 cells after treatment with T-AuNP (1 mg mL−1), NT-AuNP (1 mg mL−1), T-3-BP-AuNP (14.1 μg mL−1 with respect to NP, 10 μM with respect to 3-BP), NT-3-BP-AuNP (13.7 μg mL−1 with respect to NP, 10 μM with respect to 3-BP) and free 3-BP (10 μM) for 6 h at 37 °C under 5% CO2 atmosphere. Results are represented as mean ± SD (n = 3). Statistical analyses were performed using one-way ANOVA with Tukey post-hoc test. | |
Perturbation of mitochondrial bioenergetics in cancer cells by T-3-BP-AuNPs
We performed real-time measurements of the extracellular acidification rate (ECAR), an indicator of glycolysis and oxygen consumption rate (OCR) that is a marker of OXPHOS in PC3 cells, after treatment with T-3-BP-AuNPs, NT-3-BP-AuNPs, and free 3-BP using a Seahorse XF24 extracellular flux analyzer (Fig. 5). Glycolytic parameters were calculated by monitoring changes in the ECAR in response to sequential addition of D-glucose to assess glycolysis, oligomycin to measure maximal glycolytic capacity, and 2-deoxy-D-glucose (2-DG) as a measure of glycolytic reserve capacity (Fig. 5A and B). Administration of an excess of glucose to T-3-BP-AuNP treated PC3 cells in glucose-depleted medium gave only a modest increase in the ECAR levels, indicating the activity of T-3-BP-AuNPs in glycolysis inhibition. Under similar conditions, 3-BP delivered by NT-AuNPs showed less efficiency in glycolysis inhibition and free 3-BP at this low concentration of 10 μM did not show any glycolysis inhibitory effect (Fig. 5A). The significant inhibition of glycolysis by T-3-BP-AuNPs in PC3 cells was further supported by the sequential administration of oligomycin and 2-DG, from which the cells treated with T-3-BP-AuNPs did not show any significant changes in the ECAR levels. These data demonstrate the remarkable ability of 3-BP to inhibit glycolysis at a low concentration of 10 μM only when delivered with a mitochondria-targeted delivery system. We next assessed the effects of T-3-BP-AuNPs on the mitochondrial OXPHOS pathway and compared the results with when 3-BP was either delivered with a NT-AuNP or in the free form (Fig. 5C and D). By following the changes in the OCR values (Fig. 5C) in response to the addition of oligomycin to give maximal glycolytic capacity, carbonyl cyanide 4-trifluoromethoxy-phenylhydrazone (FCCP) as an uncoupling agent that allows maximum electron transport and therefore gives a measure of the maximum OXPHOS respiration capacity, and a combination of mitochondrial complex III inhibitor antimycin A and mitochondrial complex I inhibitor rotenone that allow the precise measurement of mitochondrial uncoupling, the spare respiratory capacity, coupling efficiency, ETC accelerator response, and basal respiration (Fig. 5D) were measured. A significant decrease in the OCR of the PC3 cells that were treated with T-3-BP-AuNPs was noted. We believe that the origin of this reduction was the ability of T-3-BP-AuNPs to target mitochondria-bound HK2 leading to loss of the mitochondrial integrity. Free 3-BP however has no preference for mitochondrial and cytosolic HK2. NT-3-BP-AuNPs showed a preference for cytosolic HK2 as shown by their ability to reduce glycolysis and induce apoptosis; however, NT-3-BP-AuNPs did not affect the overall mitochondrial integrity. T-3-BP-AuNPs suppressed basal levels of OXPHOS and affected the ability of cancer cells to upregulate OXPHOS in response to agents such as FCCP that uncouple the mitochondrial proton gradient from ATP production. The effect of T-3-BP-AuNPs on OXPHOS at a low 3-BP concentration of 10 μM is an important finding. We believe that T-3-BP-AuNPs do not exert their effects via a single molecular target within the mitochondrial respiratory chain, but through several collective disruptions that leads to the impairment of OXPHOS.
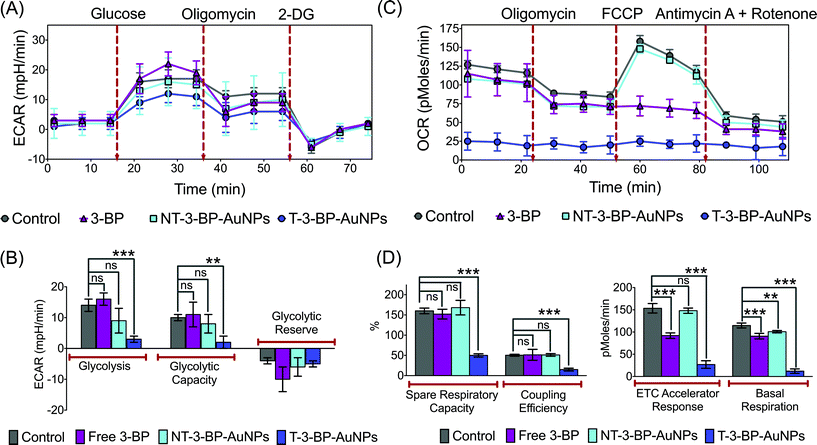 |
| | Fig. 5 Bioenergetics analyses in PC3 cells. (A) A representative graph of ECAR outputs from the XF24 analyzer of the control, T-3-BP-AuNP, NT-3-BP-AuNP, and free 3-BP treated PC3 cells and the response to glucose, oligomycin, and 2-DG and (B) comparison of glycolysis, glycolytic capacity, and glycolytic reserve in the treated cells. (C) A representative graph of OCR outputs from the XF24 analyzer of the control, T-3-BP-AuNP, NT-3-BP-AuNP, and free 3-BP treated PC3 cells and the response to oligomycin, FCCP, and antimycin A/rotenone and (D) comparison of spare respiratory capacity, coupling efficiency, ETC accelerator response and basal respiration in the treated cells. ***, P < 0.001; **, P = 0.001–0.01; non-significant (ns), P > 0.05. | |
In vivo bioD and PK Properties of T-Au-NPs
In order to obtain insight into the bioD, PK, and excretion profiles of T-AuNP and NT-AuNP accumulation, we investigated the biokinetics after intravenous injection of T-AuNPs and NT-AuNPs in Sprague Dawley rats. We chose to use T- and NT-AuNPs without 3-BP in these studies since the small molecular weight of 3-BP in comparison to the PEG used to coat the AuNPs should not change the PK parameters significantly and there is no available analytical tool to trace PK parameters in terms of 3-BP. Blood samples at predetermined time points up to 24 h post injection, and organs after 24 h were collected and analyzed for Au by ICP-MS (Fig. S9†). PK parameters calculations revealed a plasma elimination half life (t1/2) of ∼4.3 h for T-AuNPs and ∼8.8 h for NT-AuNPs (Table 2, Fig. S9 in ESI†). These high half lives indicated that both types of NP will be in circulation for a prolonged time. The small CL and high AUC further support the long-circulation properties of these NPs. The variation of T- and NT-Au-NPs in the spleen, liver, lungs, brain, heart, kidney, and testes at 24 h post-dose indicated maximum NP accumulation in the liver for both T and NT systems (Fig. S9 in ESI†). BioD studies also indicated that the TPP-modified T-AuNPs demonstrated a similar distribution profile to that shown by –NH2 modified NT-AuNPs.
Table 2 PK parameters of T-NPs and NT-AuNPs using a one-compartment modela
|
|
T-AuNPs |
NT-AuNPs |
|
AUC, area under curve; Cmax, peak plasma concentration; CL, total body clearance; t1/2, plasma half-life; Vd, volume of distribution.
|
| Route of administration |
IV |
IV |
| Dose level, μg per animal |
797.8 ± 4.9 |
818 ± 35 |
| Dose level, mg kg−1 |
2.7 |
2.7 |
| AUC [0–24 h], ng h mL−1 mg−1 kg−1 |
401![[thin space (1/6-em)]](https://www.rsc.org/images/entities/char_2009.gif) 918 ± 22581 918 ± 22581 |
25094 ± 3313 |
|
C
max, ng mL−1 |
176770 ± 831 |
6250 ± 721 |
|
V
d, L kg−1 |
738.8 ± 12.5 |
25.1 ± 0.8 |
|
C
L [t = 0], L h−1 kg−1 |
119.9 ± 10.0 |
2.0 ± 0.0 |
|
t
1/2 (h) |
4.3 ± 0.3 |
8.8 ± 0.2 |
Potential intracellular targets of 3-BP using mitochondria-targeted delivery system
Altogether, our data showed that T-3-BP-AuNPs have enormous potential in enhancing the efficacy of 3-BP. The overall potential mechanism of action of 3-BP when delivered with the T-AuNP system is represented in Fig. 6. The MCT is implicated as a 3-BP transporter and free 3-BP might not enter cells in the absence of MCT. When 3-BP is conjugated to a mitochondria-targeted NP system, as in the T-3-BP-AuNPs, even in the absence of MCTs or when the MCTs are engaged in the cellular efflux of excess lactate in highly proliferative glycolytic cancers, T-3-BP-AuNPs with Δψm-targeted –TPP moieties will be taken up by cancer cells by the utilization of the natural uptake mechanisms of AuNPs and the fact that cancer cells frequently have more negatively charged Δψm.20b,22 Once inside the cells, 3-BP released in the cytosol will inhibit cytosolic HK2. T-3-BP-AuNPs localized at the OMM in the early stage of trafficking will release 3-BP for potential dissociation of HK2 from VDAC, thereby promoting cellular apoptosis. T-3-BP-NPs localized in the mitochondrial matrix will play significant roles in the shutting down of mitochondrial OXPHOS by inhibiting succinate dehydrogenase and other enzymes such as PIC and ANC.
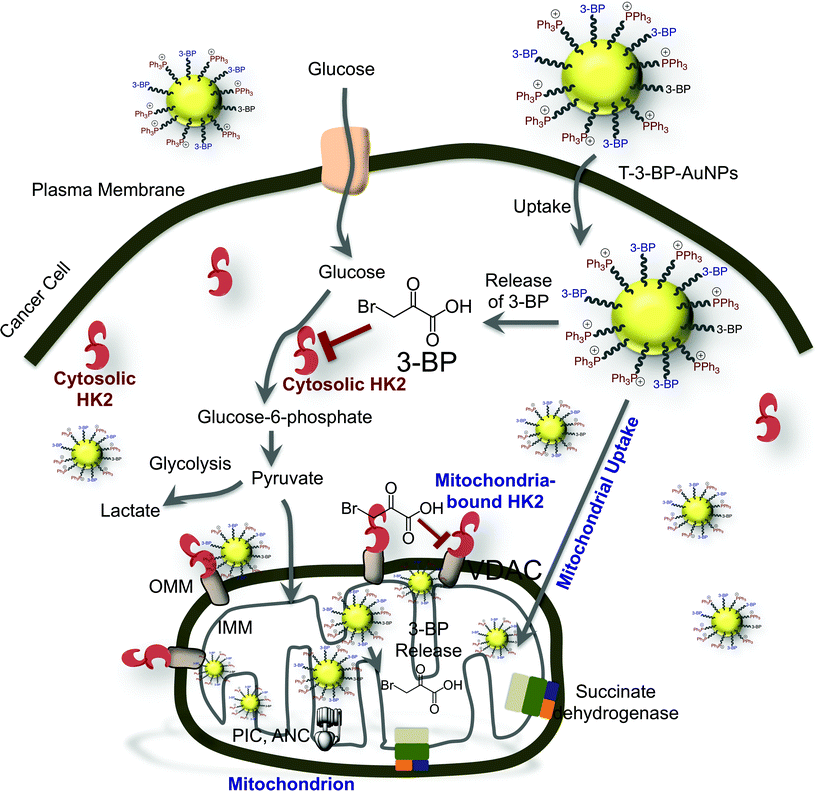 |
| | Fig. 6 The various cellular targets and possible mechanism of action of 3-BP when it is delivered using a mitochondria-targeted delivery system. | |
Conclusions
In conclusion, this study showed that 3-BP delivered by a mitochondria-targeted NP system has enormous potential in increasing the therapeutic window of free 3-BP. To the best of our knowledge, this is the first demonstration of engineering of such a NP system for mitochondrial delivery of 3-BP. Furthermore, we demonstrated that mitochondrial compartmentalization of 3-BP when delivered using a T-AuNP system is time-dependent and utilizes different targets of 3-BP in the mitochondrial compartments, further enhancing the 3-BP activity. 3-BP released from T-AuNP showed HK2 inhibition, anti-proliferative effects in PC3 and DU145 cell lines, inhibition of lactate production, inhibition of glycolysis, and blocked energy metabolism in these cells, finally triggering cell death. The targeted T-3-BP-AuNPs did not show any significant toxicity in normal hMSC cells. The efficiencies of all these activities for T-3-BP-AuNPs were much higher compared to 3-BP that was delivered using a non-targeted NP system or was in its free form. Treatment-derived toxicity, cell-insensitivity to metabolic drugs such as free 3-BP, and a lack of therapeutic selectivity are still the major issues in developing strategies leading to a cancer cure. Given their ability to selectively deliver 3-BP inside mitochondria, T-3-BP-AuNPs could constitute a leading construct in the development of chemotherapeutics that can target the unique neoplastic alterations of glucose metabolism and up regulation of HK2. This study showed the potential that delivery of 3-BP using a mitochondria-targeted delivery system is an effective means of enhancing efficacy, thus providing new strategies for 3-BP-based therapy.
Experimental
Materials and instrumentation
A detailed description of materials and instruments can be found in ESI.†
Animals
Animals were obtained from Harlan Laboratory and handled in accordance with “The Guide for the Care and Use of Laboratory Animals” of the American Association for Accreditation of Laboratory Animal Care (AAALAC), the Animal Welfare Act (AWA), and other applicable federal and state guidelines. All animal work presented here was approved by the Institutional Animal Care and Use Committee (IACUC) of University of Georgia.
Cell line and cell culture
Human prostate cancer PC3 and DU145 cells, human breast cancer MCF-7 cells, and RAW 264.7 macrophages were procured from the American type culture collection (ATCC). hMSC cells were purchased from Lonza. PC3 cells were grown in Roswell Park Memorial Institute (RPMI) 1640 medium supplemented with 10% FBS and 1% penicillin/streptomycin. DU145 and MCF-7 cells were grown at 37 °C in 5% CO2 in Eagle's minimum essential medium (EMEM) supplemented with 10% fetal bovine serum (FBS) and 1% penicillin/streptomycin. hMSCs were grown in mesenchymal stem cell basal medium supplemented with 2% FBS, 1% penicillin/streptomycin, recombinant human fibroblast growth factor-basic (5 ng mL−1), recombinant human fibroblast growth factor-acidic (5 ng mL−1), and recombinant human epithelial growth factor (5 ng mL−1). RAW 264.7 macrophages were cultured in RPMI medium supplemented with 10% FBS and 1% penicillin/streptomycin. PC3, DU145, and RAW 264.7 cells were passed every 3 to 4 days and restarted from frozen stocks upon reaching pass number 20. hMSCs were passed every 4 days and restarted from frozen stock upon reaching pass number 11.
Statistics
All data were expressed as mean ± S.D (standard deviation). Statistical analyses were performed using GraphPad Prism® software v. 5.00. Comparisons between two values were performed using an unpaired Student t test. A one-way ANOVA with a post-hoc Tukey test was used to identify significant differences among the groups.
Synthesis of TPP–(CH2)5–COOH
TPP–(CH2)5–COOH was constructed following a synthetic method reported by us.23 6-Bromohexanoic acid (0.5 g, 2.6 mmol) and triphenylphosphine (0.7 g, 2.7 mmol) were dissolved in acetonitrile (15 mL). The resulting mixture was heated to reflux under a nitrogen flow for 24 h. The solution was cooled to room temperature and concentrated under reduced pressure. The resulting viscous oil was washed with hexanes (2 × 15 mL) and diethyl ether (3 × 15 mL) to produce a white solid (0.85 g, 87% yield). 1H NMR (CDCl3): δ 9.3 [s, 1H], 7.8–7.6 [m, 15], 3.52 [t, 2H], 2.3 [t, 2H], 1.61 [m, 6H] ppm. 13C NMR (CDCl3): δ 175, 135.2, 133.4, 130.2, 118.5, 34.3, 29.5, 23.9, 22.8, 22.4, 22.1 ppm. 31P NMR (CDCl3): δ 24.39 ppm.
Synthesis of SH–PEG–TPP
SH–PEG–NH2 (0.2 g, 0.0571 mmol), TPP–(CH2)5–COOH (0.043 g, 0.1142 mmol), and 4-dimethylaminopyridine (DMAP) (0.014 g, 0.1142 mmol) were dissolved in 7 mL CH2Cl2, cooled to 0 °C while stirring, and a solution of dicyclohexylcarbodiimide (DCC) (0.024 g, 0.1142 mmol) in 1 mL CH2Cl2 was added. The mixture was warmed to room temperature and stirred overnight. The precipitated reaction by-product dicyclohexylurea was filtered off and the filtrate was precipitated in chilled diethyl ether. The resulting solid was centrifuged at 5000 revolutions per minute (rpm) for 15 min. The supernatant was decanted and the resulting wet solid was lyophilized to result in white solid. Once dry, the white powder was dissolved in water and dialyzed for 24 h, changing the water every 4 h, using Spectra/Por® dialysis membranes with a molecular weight cutoff of 1000 Da to remove free TPP–(CH2)5–COOH. Yield: 50% (0.11 g). 1H NMR (CDCl3): δ 7.82–7.57 [m, 15H], 3.81 [m, 2H], 3.71 [m, 2H], 3.64 [m, 414H], 3.46 [m, 2H], 2.88 [m, 2H], 2.04 [m, 2H], 1.73 [m, 2H] ppm (Fig. S1 in ESI†). 13C NMR (CDCl3): δ 207.15, 131.51, 131.48, 129.99, 129.9, 126.95, 126.83, 66.9 ppm (Fig. S2 in ESI†). 31P NMR (CDCl3): δ 24.63 ppm (Fig. S3 in ESI†).
Synthesis of T- and NT-AuNPs
For T-AuNP synthesis, a solution of SH–PEG–TPP (0.1 g, 0.25 mmol) and SH–PEG–NH2 (0.1 g, 0.25 mmol) was prepared in 15 mL H2O and gold(III) chloride trihydrate (HAuCl4·3H2O) (0.05 g, 0.12 mmol) was added. This mixture was vigorously stirred for 10 min until all of the gold salt was dissolved. The reduction was carried out by adding drop wise a freshly prepared aqueous solution of sodium borohydride (0.05 g, 1.2 mmol in 3 mL H2O) with vigorous stirring and 15 mL of deionized (DI) water was then added to the mixture. After 24 h, the solution was dialyzed using a Spectra/Por® dialysis membrane with a MW cutoff of 5000 Da against H2O for 12 h. The water was changed every hour. The NPs were further purified using differential centrifugation at 7000 rpm for 30 min. After centrifugation, the supernatant was kept and the pellet was discarded to obtain monodispersed T-Au-NPs. The non-targeted NPs (NT-Au-NPs) were prepared by following the same synthetic method as mentioned for T-AuNPs, using SH–PEG–NH2 (0.2 g, 0.5 mmol) and HAuCl4·3H2O (0.05 g, 0.12 mmol).
Synthesis of T-3-BP-AuNPs and NT-3-BP-AuNPs
3-BP was conjugated to the surface of the T-AuNPs and NT-AuNPs by amide coupling. 3-BP (30 mg, 0.18 mmol), N-hydroxysuccinimide (NHS) (39 mg, 0.12 mmol), and ethyl(dimethylaminopropyl) carbodiimide (EDC) (30 mg, 0.18 mmol) were dissolved in H2O (5 mL). 3-BP was allowed to activate for 6 h at 25 °C. To this, T-AuNPs or NT-AuNPs (10 mg mL−1, 5 mL) were added and the mixture stirred overnight at 25 °C. NPs were purified by dialysis (MW cutoff of 2000 Da) against water for 8 h changing the water every hour. NPs were lyophilized and freshly resuspended in nanopure water prior to use.
Determination of 3-BP loading using GAPDH assay
The activity of 3-BP on GAPDH was used to determine 3-BP loading on AuNPs, using a KDalert™ GAPDH assay kit. GAPDH was treated with predetermined concentrations of 3-BP to generate a standard curve (Fig. S6†). AuNPs (100 μL, 10 mg mL−1) were treated with 1.0 mM potassium iodide (KI) to dissolve the gold core and then 10 μL of the NPs was then added to the GAPDH enzyme (10 μL, 0.133 U mL−1) and subjected to the activity assay. The NP/GAPDH enzyme suspension (10 μL) was then added to the KDalert™ master mix (90 μL) in a 96 well plate. The mixture was gently shaken to ensure complete mixing and the fluorescence was measured (excitation: 560 nm, emission: 590 nm).
Determination of immune response from NPs in RAW 264.7 macrophages using ELISA
RAW 264.7 macrophages were plated at a concentration of 50000 cells per mL in 96 well plates and allowed to grow for 12 h. The cells were incubated with T-AuNP (10 mg mL−1) or NT-AuNP (10 mg mL−1) for 24 h at 37 °C. Additionally, LPS alone (100 ng mL−1) was added to the macrophage culture to serve as a control. ELISA was performed on the supernatants against the pro-inflammatory cytokines IL-6 and TNF-α. Antibody coated plates were prepared by treating ELISA-compatible Thermo Scientific Nunc 96-well plates with the antibody for 12 h at 4 °C and then blocked with 10% FBS in phosphate buffered saline (PBS) for 1 h at room temperature followed by 5 washings with the washing buffer (1X PBS with 0.05% v/v Tween® 20). Macrophage supernatants (100 μL) were added to the plates and incubated for 2 h at room temperature, followed by 5 washes with the washing buffer and sequential incubations with the cytokine–biotin conjugate and streptavidin working solution. The substrate reagent containing 3,3′,5,5'-tetramethylbenzidine (100 μL) was then added to each well, incubated for 15 min in the dark, and the reaction stopped by adding 50 μL stop solution containing 0.1 M H2SO4. The absorbance was recorded at 450 nm using a BioTek Synergy HT well plate reader.
HK2 binding assay
The HK2 binding ability of T and NT 3-BP loaded AuNPs was tested using human HK2 recombinant protein of molecular mass 104.1 kDa expressed in Escherichia coli. T-AuNPs, NT-AuNPs, T-3-BP-AuNP, and NT-3-BP-AuNPs (10 mg mL−1 with respect to AuNP and 1.4 mM with respect to 3-BP) were treated with 1 μL of a solution of 1.0 mg mL−1 of HK2 (in 20 mM Tris pH 8.0 and 10% glycerol) for 1 h at 37 °C. HK2-bound NPs were then centrifuged at 12000 rpm for 30 min and supernatants were discarded to remove unbound HK2. This process was repeated 3 times and finally the NP pellet obtained was resuspended in water. BCA assay directly on the HK2 bound to AuNP did not show any signal. Therefore, the Au core was dissolved using 1 mM KI and a BCA assay was performed to quantify the amount of HK2 bound to 3-BP. A standard curve was constructed using bovine serum albumin (BSA) (Fig. S7 in ESI†).
Quantification of AuNPs in the mitochondrial compartments
PC3 cells were grown at a density of 5 × 10⁵ per mL cells in 30 mL RPMI medium overnight in a T-150 flask. The medium was changed and T-AuNPs or NT-AuNPs were added (1 mg mL−1) and incubated for 12 h. The medium was changed and the cells were rinsed with 1X PBS (3×). The cells were isolated by trypsinization and centrifuged for 3 min at 1800 rpm. The final cell suspension was resuspended in reagent A from the mitochondria isolation kit for mammalian cells and incubated on ice for 2 min. After 2 min, reagent B (10 μL) was added and incubated on ice for 5 min, vortexing each minute. These cells were treated with reagent C and the cells were centrifuged at 700 × g for 10 min. The resulting supernatant was collected containing the mitochondrial and cytosolic fractions. This was further centrifuged at 12000 × g for 15 min at 4 °C to yield a mitochondrial pellet and the cytosolic supernatant. The resulting pellet was further purified with washing and centrifugation at 12000 × g for 5 min to yield the mitochondrial fraction. These fractions were analyzed for the amount of gold using ICP-MS and the amount of protein recovered using a BCA assay. To evaluate the exact location of the T-AuNPs and T-3-BP-AuNPs within the mitochondria, the mitochondria were further fractionated. PC3 cells were grown at a density of 5 × 10⁵ per mL cells in 30 mL RPMI medium overnight in a T-150 flask. The medium was changed and T-AuNPs or T-3-BP-AuNPs were added (1 mg mL−1) and incubated for either 4 or 12 h. After the given time, the cells were trypsinized and repeatedly washed with PBS at 1800 rpm for 3 min. The mitochondria were isolated as described above. This was further subfractionated into the OMM, the IMS, the IMM, and the matrix. The freshly isolated PC3 mitochondria in PBS (1X) were incubated with protease inhibitor (0.125 mg mL−1) and 0.6% digitonin for 10 min on ice. Immediately after incubation, the mitochondria were centrifuged at 10000 × g for 10 min at 4 °C. The supernatant (SN-I) contained the OMM fraction and the interstitial membrane space. The pellet was resuspended in 150 mmol L−1 KCl with protease inhibitor (0.125 mg mL−1) and incubated on ice for 10 min. This was centrifuged at 10000 × g for 10 min at 4 °C. The supernatant, which contained the mitochondrial matrix, was collected. To this, 50 μL of 1X cell lysis buffer (30 mM Tris–HCl, 0.1 mM EDTA, 20% w/v sucrose) was added. This was subsequently sonicated and centrifuged at 10000 × g for 15 min at 4 °C. The supernatant (SN-II) was collected, containing the purified IMM fraction and matrix. SN-I and SN-II were centrifuged at 105000 × g for 60 min. The pellet from SN-I contained the OMM fraction and the supernatant contained the interstitial membrane space. The pellet from SN-II was resuspended in PBS containing Lubrol WX (0.5 mg mL−1) and 37% sucrose and incubated for 15 min on ice. This was once again centrifuged at 105000 × g for 60 min at 4 °C. The collected pellet contained the IMM fraction and the supernatant contained the matrix. The collected fractions were analyzed for Au concentration using ICP-MS. A BCA assay was performed on all the fractions in order to calculate the Au (ng)/protein (pg).
Cellular TEM studies
PC3 cells were plated on a 6-well plate at a density of 0.5 × 10⁶ per mL and allowed to attach overnight. The medium was changed, AuNPs were added (T-AuNPs and NT-AuNPs, 1 mg mL−1), and the cells were incubated for 12 h at 37 °C. The cells were washed 3× with 1X PBS to remove AuNPs that had not been internalized. The cells were trypsinized followed by 3 washes by centrifugation (4 °C, 1800 rpm, 3 min). The cells were then fixed with 1% glutaraldehyde for 1 h at room temperature followed by 3 washes with 1X PBS. Fixation was followed by a counter fixation with 1% osmium tetroxide for 1 h at room temperature. The residual osmium tetroxide was removed by repeated washing with PBS and water. The cells were then transitioned into 100% ethanol in a series incubations (10 min per incubation, room temperature) increasing the ethanol percentage by 25 each time. Once in 100% ethanol, the cells were transitioned to 100% propylene oxide increasing the percentage by 50% each incubation (30 min/incubation, room temperature). To ensure that the residual ethanol was removed, the cells were then washed with 100% propylene oxide (3 times, room temperature, 10 min/wash). The cells were then infiltrated with EmBed 812 resin by slowly increasing the amount of resin in propylene oxide by 25% each incubation (1 h/incubation, room temperature). The samples in fresh 100% resin were placed in an oven at 60 °C overnight in order to polymerize the resin. The hardened blocks were then trimmed and sectioned on an ultramicrotome to a thickness of ∼50 nm. The sections were collected on a copper grid and imaged on a JEM-1210 Transmission Electron Microscope equipped with an XR41C Bottom-Mount CCD Camera.
Cell death analyses
Cytotoxicity profiles of T-AuNPs, NT-AuNPs, T-3-BP-AuNPs, NT-3-BP-AuNPs, and 3-BP were studied using the MTT assay against prostate cancer PC3 and DU145 cell lines, breast cancer MCF-7 cells, and hMSC cells. Cells (2000 cells per well) were seeded on a 96-well plate in 100 μL of desired medium and incubated for 24 h. The cells were then treated with different constructs at varying concentrations, incubated for 12 h at 37 °C, and the medium changed. The cells were further incubated for an additional 60 h at 37 °C under 5% CO2. For photothermal MTT studies, after 4 h treatment of the cells with NPs, the cells were irradiated with 660 nm laser (power 20.0 mV) light with fiber optics for 1 min per well and the irradiated cells were incubated for 12 h at 37 °C, followed by a medium change and further incubation for 60 h. The cells were then treated with 20 μL MTT (5 mg mL−1 in PBS) for 5 h. The medium was removed, the cells were lysed with 100 μL of DMSO, and the absorbance of the purple formazan was recorded at 550 nm using a Bio-Tek Synergy HT microplate reader with background absorbance measured at 800 nm. Each well was in triplicate and each experiment was repeated three times. Cytotoxicity was expressed as the mean percentage increase relative to the unexposed control ± standard deviation (SD). Cytotoxicity data (where appropriate) was fitted to a sigmoidal curve and a three parameters logistic model used to calculate the IC50, which is the concentration of chemotherapeutics causing 50% inhibition in comparison to untreated controls. The mean IC50 is the concentration of agent that reduces cell growth by 50% under the experimental conditions and is the average from at least three independent measurements that were reproducible and statistically significant. The IC50 values were reported at ±99% confidence intervals. This analysis was performed using GraphPad Prism (San Diego, U.S.A).
For apoptosis detection, PC3 cells were plated at a density of 1 × 10⁶ cells per mL and allowed to grow for 14 h. Medium was changed and cells were treated with T-AuNP (1 mg mL−1), NT-AuNP (1 mg mL−1), T-3-BP-AuNP (14.1 μg mL−1 with respect to NP, 10 μM with respect to 3-BP), NT-3-BP-AuNP (13.7 μg mL−1 with respect to NP, 10 μM with respect to 3-BP) and free 3-BP (10 μM or 1 mM) for 6 h at 37 °C. For apoptosis detection after laser treatment, cells were treated with T-AuNP (1 mg mL−1), NT-AuNP (1 mg mL−1), T-3-BP-AuNP (14.1 μg mL−1 with respect to NP, 10 μM with respect to 3-BP), NT-3-BP-AuNP (13.7 μg mL−1 with respect to NP, 10 μM with respect to 3-BP) and free 3-BP (10 μM) for 4 h at 37 °C, irradiated with a laser of 660 nm for 1 min, and further incubated for 12 h. Cells were trypsinized and the cell pellet was collected by centrifugation at 1800 rpm for 3 min at 4 °C. The cell pellet was washed 3 times with cold 1X PBS, and centrifuged at 1800 rpm for 3 min, and the supernatants were discarded. Cells were counted and resuspended in 1X annexin-binding buffer at a density of ∼1 × 10⁶ cells per mL, preparing a sufficient volume to have 100 μL per assay. To 100 μL of cell suspension, 5 μL Alexa Fluor® 488 annexin V and 1 μL 100 μg mL−1 PI working solution were added, incubated for 15 min at room temperature, followed by addition of 400 μL 1X annexin-binding buffer, gently mixing in ice, and the samples were analyzed.
Lactate determination
Extra- and intracellular lactate levels were quantified using methods reported by us.23 PC3 cells were seeded at a density of 1 × 10⁶ cells per mL and allowed to grow for 12 h at 37 °C under 5% CO2. Cells were treated with T-AuNP (1 mg mL−1), NT-AuNP (1 mg mL−1), T-3-BP-AuNP (14.1 μg mL−1 with respect to NP, 10 μM with respect to 3-BP), NT-3-BP-AuNP (13.7 μg mL−1 with respect to NP, 10 μM with respect to 3-BP) and free 3-BP (10 μM) for 6 h at 37 °C. After 6 h, the medium was removed and the cells were homogenized. The lysate and the medium supernatant were added to the enzyme and substrate working reagent mixture and incubated for 30 min. Lactate concentration was measured by using a Bio-Tek Synergy HT microplate reader at 450 nm and comparing to a standard curve.
CellTiter-Glo® luminescent ATP quantification
PC3 cells were seeded at a density of 1 × 10⁶ cells per mL in a 12 well plate and allowed to grow for 12 h at 37 °C under 5% CO2. Cells were treated with T-AuNP (1 mg mL−1), NT-AuNP (1 mg mL−1), T-3-BP-AuNP (14.1 μg mL−1 with respect to NP, 10 μM with respect to 3-BP), NT-3-BP-AuNP (13.7 μg mL−1 with respect to NP, 10 μM with respect to 3-BP) and free 3-BP (10 μM) for 6 h at 37 °C under 5% CO2 atmosphere. Control wells containing medium without cells were used to obtain a background luminescence value. Plates were then equilibrated at room temperature for ∼30 min. A volume of CellTiter-Glo reagent equal to the volume of cell culture medium present in each well was added, and this was mixed for 2 min in a shaker to induce cell lysis. The plates were incubated at room temperature for an additional 10 min to stabilize the luminescence signal. Luminescence was recorded using a plate reader. ATP quantification was carried out from a standard curve using ATP disodium salt hydrate.
Mitochondrial bioenergetics assay
Prior to the assay, XF sensor cartridges were hydrated. To each well of an XF utility plate, 1 mL of Seahorse Bioscience calibrant was added and the XF sensor cartridges were placed on top of the utility plate, and kept at 37 °C incubator without CO2 for a minimum of 12 h. PC3 cells were cultured in XF24-well cell culture microplates (Seahorse Bioscience) at a density of 5 × 10⁴ cells per well (0.32 cm2) in 200 μL growth medium and then incubated for 24 h at 37 °C under 5% CO2 atmosphere. The three key parameters of glycolytic function, glycolysis, glycolytic capacity, and glycolytic reserve, were assessed using a Seahorse XF glycolysis stress kit. After the cells were attached, an additional 100 μL growth medium was added and the cells were incubated for 24 h at 37 °C under 5% CO2 atmosphere. The cells were treated with T-3-BP-AuNP (10 μM with respect to 3-BP), NT-3-BP-AuNP (10 μM with respect to 3-BP), and 3-BP (10 μM) for 6 h at 37 °C under 5% CO2 atmosphere. After 6 h, all but 50 μL of the culture medium was removed from each well and the cells were rinsed two times with 600 μL of XF stress test glycolysis optimization medium pre-warmed to 37 °C, and finally 610 μL of glucose-depleted optimization medium was added to each well and the plate was incubated at 37 °C without CO2 for 1 h prior to assay. The OCR and the ECAR were measured simultaneously for 16 min to establish a baseline rate. Glycolysis, glycolytic capacity, and glycolytic reserve were calculated by subtracting the average rates before and after the addition of glucose (10 mM), ATP synthase inhibitor oligomycin (1.0 μM), and 2-deoxy-D-glucose (2-DG) (100 mM). These three compounds were injected consecutively with a specific time gap and ECAR values were measured after each injection. Different parameters of respiration, basal respiration, coupling efficiency, and spare respiratory capacity, were investigated by using a Seahorse XF-24 cell Mito Stress Test Kit. PC3 cells were plated and treated with different constructs as mentioned above. After 6 h incubation with the constructs, the medium was changed as above with the optimization medium supplemented with sodium pyruvate, L-glutamine, and D-glucose to a final volume of 500 μL. The different parameters of respiration were calculated by subtracting the average respiration rates before and after the addition of the electron transport inhibitors oligomycin (1.0 μM) and FCCP (1.0 μM), an ionophore that is a mobile ion carrier, and a mixture of antimycin-A (1.0 μM) (which is a complex III inhibitor) and rotenone (1.0 μM), a mitochondrial inhibitor that prevents the transfer of electrons from the Fe–S center in complex I to ubiquinone. The parameters calculated included: basal respiration (baseline respiration minus antimycin-A post injection respiration), ATP turnover (baseline respiration minus oligomycin post injection respiration), maximal respiratory capacity (FCCP stimulated respiration minus antimycin-A post injection respiration) and reserve respiratory capacity (FCCP stimulated respiration minus baseline respiration). Test articles on each well had five replicates.
In vivo BioD and PK of T-NPs and NT-AuNPs
BioD and PK properties of T-AuNPs and NT-AuNPs were determined using male Sprague Dawley rats weighing around ∼300 g. Two rats per group had T-AuNP-NPs and NT-AuNPs administered by intravenous injections with ∼500 μL of T-AuNPs and ∼250 μL of NT-AuNPs (T-AuNPs: 16 mg kg−1 with respect to total NP, 2.7 mg kg−1 with respect to Au; NT-AuNPs: 8.3 mg kg−1 with respect to total NP, 2.7 mg kg−1 with respect to Au) or saline. At varying time intervals, blood samples were collected in heparinized tubes and centrifuged in order to collect blood plasma. The percentage of Au was calculated by taking into consideration that blood constitutes 7% of body weight and plasma constitutes 55% of blood volume.24 The amount of Au from the AuNPs in the blood plasma was calculated using ICP-MS. After 24 h, the animals were sacrificed and the vital organs were collected. The collective urine and feces were also collected over a 24 h period. The overall bioD was calculated by analyzing the amount of Au in each organ as well as the feces and urine using ICP-MS. Before analysis, the liver samples were dissolved in PerkinElmer Solvable (product number: 6NE9100), and other organs and feces were dissolved in concentrated HNO3 for 24 h at room temperature with gentle heating and shaking. The calculations for AUC, Cmax, Tmax, and CL (t = 0) were performed using GraphPad Prism (Version 5.01). PK parameters were determined by fitting the data using a one-compartmental model equation.
Acknowledgements
This work was supported by a start-up grant from the National Institutes of Health (P30 GM 092378) to UGA and by the Office of the Vice President for Research, UGA to S.D. S. M. thanks the Grimes Family Distinguished Graduate Fellowship in Natural Sciences. We thank Prof. Rick Tarleton for the Seahorse XF analyzer. We thank Dr. Nagesh Kolishetti for helpful discussions and critical reading of the manuscript.
Notes and references
-
(a) M. G. Vander Heiden, L. C. Cantley and C. B. Thompson, Science, 2009, 324, 1029–1033 CrossRef CAS PubMed;
(b) O. Warburg, Science, 1956, 123, 309–314 CAS;
(c) P. P. Hsu and D. M. Sabatini, Cell, 2008, 134, 703–707 CrossRef CAS PubMed.
- J. E. Wilson, J. Exp. Biol., 2003, 206, 2049–2057 CrossRef CAS.
- S. P. Mathupala, Y. H. Ko and P. L. Pedersen, Oncogene, 2006, 25, 4777–4786 CrossRef CAS PubMed.
-
(a) E. Bustamante and P. L. Pedersen, Proc. Natl. Acad. Sci. U. S. A., 1977, 74, 3735–3739 CrossRef CAS;
(b) R. A. Nakashima, M. G. Paggi, L. J. Scott and P. L. Pedersen, Cancer Res., 1988, 48, 913–919 CAS.
- J. G. Pastorino, N. Shulga and J. B. Hoek, J. Biol. Chem., 2002, 277, 7610–7618 CrossRef CAS PubMed.
- P. L. Pedersen, S. Mathupala, A. Rempel, J. F. Geschwind and Y. H. Ko, Biochim. Biophys. Acta, 2002, 1555, 14–20 CrossRef CAS.
- P. L. Pedersen, J. Bioenerg. Biomembr., 2012, 44, 1–6 CrossRef CAS PubMed.
- Z. Chen, H. Zhang, W. Lu and P. Huang, Biochim. Biophys. Acta, 2009, 1787, 553–560 CrossRef CAS PubMed.
-
(a) P. Dell'Antone, Med. Chem., 2009, 5, 491–496 CrossRef;
(b) P. E. Porporato, S. Dhup, R. K. Dadhich, T. Copetti and P. Sonveaux, Front. Pharmacol., 2011, 2, 49 Search PubMed.
- K. Birsoy, T. Wang, R. Possemato, O. H. Yilmaz, C. E. Koch, W. W. Chen, A. W. Hutchins, Y. Gultekin, T. R. Peterson, J. E. Carette, T. R. Brummelkamp, C. B. Clish and D. M. Sabatini, Nat. Genet., 2013, 45, 104–108 CrossRef CAS PubMed.
-
(a) S. Dhar, N. Kolishetti, S. J. Lippard and O. C. Farokhzad, Proc. Natl. Acad. Sci. U. S. A., 2011, 108, 1850–1855 CrossRef CAS PubMed;
(b) J. Hrkach, D. Von Hoff, M. Mukkaram Ali, E. Andrianova, J. Auer, T. Campbell, D. De Witt, M. Figa, M. Figueiredo, A. Horhota, S. Low, K. McDonnell, E. Peeke, B. Retnarajan, A. Sabnis, E. Schnipper, J. J. Song, Y. H. Song, J. Summa, D. Tompsett, G. Troiano, T. Van Geen Hoven, J. Wright, P. LoRusso, P. W. Kantoff, N. H. Bander, C. Sweeney, O. C. Farokhzad, R. Langer and S. Zale, Sci. Transl. Med., 2012, 4, 128–139 Search PubMed;
(c) S. Marrache, R. K. Pathak, K. L. Darley, J. H. Choi, D. Zaver, N. Kolishetti and S. Dhar, Curr. Med. Chem., 2013, 20, 3500–3514 CrossRef CAS;
(d) R. K. Pathak, N. Kolishetti and S. Dhar, WIREs Nanomed. Nanobiotechnol., 2014 DOI:10.1002/wnan.1305.
- D. A. Giljohann, D. S. Seferos, W. L. Daniel, M. D. Massich, P. C. Patel and C. A. Mirkin, Angew. Chem., Int. Ed., 2010, 49, 3280–3294 CrossRef CAS PubMed.
- S. Wang, K. J. Chen, T. H. Wu, H. Wang, W. Y. Lin, M. Ohashi, P. Y. Chiou and H. R. Tseng, Angew. Chem., Int. Ed., 2010, 49, 3777–3781 CrossRef CAS PubMed.
-
(a) N. L. Rosi, D. A. Giljohann, C. S. Thaxton, A. K. Lytton-Jean, M. S. Han and C. A. Mirkin, Science, 2006, 312, 1027–1030 CrossRef CAS PubMed;
(b) D. S. Seferos, A. E. Prigodich, D. A. Giljohann, P. C. Patel and C. A. Mirkin, Nano Lett., 2009, 9, 308–311 CrossRef CAS PubMed;
(c) S. Dhar, W. L. Daniel, D. A. Giljohann, C. A. Mirkin and S. J. Lippard, J. Am. Chem. Soc., 2009, 131, 14652–14653 CrossRef CAS PubMed;
(d) R. Arvizo, R. Bhattacharya and P. Mukherjee, Expert Opin. Drug Delivery, 2010, 7, 753–763 CrossRef CAS PubMed.
- R. R. Arvizo, S. Saha, E. Wang, J. D. Robertson, R. Bhattacharya and P. Mukherjee, Proc. Natl. Acad. Sci. U. S. A., 2013, 110, 6700–6705 CrossRef CAS PubMed.
- P. Kingshott and H. J. Griesser, Curr. Opin. Solid State Mater. Sci., 1999, 4, 403–412 CrossRef CAS.
-
(a) S. Marrache and S. Dhar, Proc. Natl. Acad. Sci. U. S. A., 2012, 109, 16288–16293 CrossRef CAS PubMed;
(b) S. Marrache, S. Tundup, D. A. Harn and S. Dhar, ACS Nano, 2013, 7, 7392–7402 CrossRef CAS PubMed;
(c) S. Marrache, R. K. Pathak and S. Dhar, Proc. Natl. Acad. Sci. U. S. A., 2014, 111, 10444–10449 CrossRef CAS PubMed.
- M. F. Ross, G. F. Kelso, F. H. Blaikie, A. M. James, H. M. Cocheme, A. Filipovska, T. Da Ros, T. R. Hurd, R. A. Smith and M. P. Murphy, Biochemistry, 2005, 70, 222–230 CAS.
- L. H. Higgins, H. G. Withers, A. Garbens, H. D. Love, L. Magnoni, S. W. Hayward and C. D. Moyes, Biochim. Biophys. Acta, 2009, 1787, 1433–1443 CrossRef CAS PubMed.
-
(a) K. K. Singh, V. Ayyasamy, K. M. Owens, M. S. Koul and M. Vujcic, J. Hum. Genet., 2009, 54, 516–524 CrossRef CAS PubMed;
(b) L. B. Chen, Annu. Rev. Cell Dev. Biol., 1988, 4, 155–181 CrossRef CAS PubMed;
(c) D. M. Hockenbery, Cancer Cell, 2002, 2, 1–2 CrossRef CAS.
- Y. Pan, A. Leifert, D. Ruau, S. Neuss, J. Bornemann, G. Schmid, W. Brandau, U. Simon and W. Jahnen-Dechent, Small, 2009, 5, 2067–2076 CrossRef CAS PubMed.
- J. S. Modica-Napolitano and J. R. Aprille, Adv. Drug Delivery Rev., 2001, 49, 63–70 CrossRef CAS.
- R. K. Pathak, S. Marrache, D. A. Harn and S. Dhar, ACS Chem. Biol., 2014, 9, 1178–1187 CrossRef CAS PubMed.
- H. B. Lee and M. D. Blaufox, J. Nucl. Med., 1985, 26, 72–76 CAS.
Footnote |
| † Electronic supplementary information (ESI) available: Details of materials and instrumentation, additional experimental details, additional figures and tables. See DOI: 10.1039/c4sc01963f |
|
| This journal is © The Royal Society of Chemistry 2015 |

 Open Access Article
 This Open Access Article is licensed under a Creative Commons Attribution-Non Commercial 3.0 Unported Licence