DOI:
10.1039/C5RA16036G
(Paper)
RSC Adv., 2015,
5, 82259-82270
Effect of chemically reduced graphene oxide on the isothermal and non-isothermal phase separation behavior of poly(methyl methacrylate)/poly(styrene-co-acrylonitrile) binary polymer blends
Received
10th August 2015
, Accepted 16th September 2015
First published on 17th September 2015
Abstract
The effect of a small amount of chemically reduced graphene oxide (CRGO) on the isothermal and non-isothermal phase separation behavior of poly(methyl methacrylate)/poly(styrene-co-acrylonitrile) (PMMA/SAN) blends was investigated by using time-resolved small angle laser light scattering (SALLS). During the non-isothermal process, a quantitative logarithm function can be established to describe the relationship between the cloud point Tc and heating rate k as given by Tc = A![[thin space (1/6-em)]](https://www.rsc.org/images/entities/char_2009.gif) ln
ln![[thin space (1/6-em)]](https://www.rsc.org/images/entities/char_2009.gif) k + T0 for the unfilled and filled CRGO-filled PMMA/SAN systems. During the isothermal process, the TTS principle and WLF function are applicable to describe the temperature dependence of nonlinear phase separation behaviors at the early and late stages of spinodal decomposition (SD) for such unfilled and filled systems, indicating that the introduction of CRGO hardly changes the viscous diffusion essence of macromolecular chains during phase separation. However, the mechanical barrier effect of CRGO on the macromolecular viscous diffusion may result in the delay of their phase separation behavior. Furthermore, the effect of CRGO on the isothermal and non-isothermal phase-separation behavior of the blend matrix is found to be dependent on the composition of the blend matrix. CRGO may act as a nucleating agent to result in the decrease of Tc for the PMMA/SAN 37/63 system, while the mechanical barrier effect of CRGO on the macromolecular segment may retard the concentration fluctuation at the early stage of SD phase separation to cause the increase of Tc for the PMMA/SAN 57/43 system. Besides, when SAN is the minority of the blend matrix (PMMA/SAN 57/43), the selective location of CRGO may result in the more obvious viscosity increment and then the more remarkable hindering effect on the SD phase separation behavior of blend matrix.
k + T0 for the unfilled and filled CRGO-filled PMMA/SAN systems. During the isothermal process, the TTS principle and WLF function are applicable to describe the temperature dependence of nonlinear phase separation behaviors at the early and late stages of spinodal decomposition (SD) for such unfilled and filled systems, indicating that the introduction of CRGO hardly changes the viscous diffusion essence of macromolecular chains during phase separation. However, the mechanical barrier effect of CRGO on the macromolecular viscous diffusion may result in the delay of their phase separation behavior. Furthermore, the effect of CRGO on the isothermal and non-isothermal phase-separation behavior of the blend matrix is found to be dependent on the composition of the blend matrix. CRGO may act as a nucleating agent to result in the decrease of Tc for the PMMA/SAN 37/63 system, while the mechanical barrier effect of CRGO on the macromolecular segment may retard the concentration fluctuation at the early stage of SD phase separation to cause the increase of Tc for the PMMA/SAN 57/43 system. Besides, when SAN is the minority of the blend matrix (PMMA/SAN 57/43), the selective location of CRGO may result in the more obvious viscosity increment and then the more remarkable hindering effect on the SD phase separation behavior of blend matrix.
1. Introduction
The introduction of nano-fillers to a polymer matrix may open pathways to create novel engineered nanocomposites with enhanced strength, modulus, heat resistance, conductivity, permeability, fire retardancy, optical and magnetic properties.1–4 If the matrix is multiple-component, such as a polymer blend, these properties will depend on the morphology/structure of ternary polymer nanocomposites and the locations of nano-fillers. Hence, the effect of nano-filler on the miscibility and morphology evolution of the blend matrix should hardly be ignored. The sufficient understanding of the effect of filler on the thermodynamic and kinetics of phase-separation behavior for binary polymer blends, especially for polymer blends with critical phase behaviors, such as lower critical solution temperature (LCST) blends and upper critical solution temperature (UCST) blends, helps us predict and optimize the permanent stability, and then the ultimate performance of filled ternary polymer systems.
For the processing of immiscible polymer blends, the nanoparticles can be used as a compatibilizer to arrest the domain coarsening or stabilize the evolving morphologies.5,6 Hence, a wide range of nano-fillers in immiscible polymer blends has been explored to control the morphological features of blend matrix and improve their ultimate performance.7–11 On the other hand, partially miscible polymer blends have also attracted more interest because their morphologies may be controlled by the mechanism and the kinetics of phase separation, which may be strongly influenced by the incorporation of the nano-fillers. It is well known for binary partially miscible blends that the conventional phase separation theories are based either on a solid model or on a fluid model,12 while the phase-separation kinetics have been classified into two types: bicontinuous (and droplet) spinodal decomposition (SD) in the unstable region and nucleation-growth-type (NG) phase separation in the metastable region. The early stage of phase separation is well described by Cahn's linear theory13 and the Lifshitz–Slyozov–Wagner theory,12,14,15 respectively; while the late stage of phase separation follows self-similar growth and scaling laws.16 On the basis of above-mentioned theoretical models, the effect of fillers on phase separation is usually found to have close relationship with their surface affinity. Furthermore, the effect of nanoscaled spherical fillers on the phase separation behavior of partially miscible polymer blends or block copolymers has also been widely studied both by experimental observation17–21 and by theoretical simulation22–24 in recent years. However, the effect of nano-fillers with other topological shapes on the phase stability and kinetics of phase separation for such partially miscible blends is not yet fully understood.
As a two-dimensional sheet filler, the potential of graphene in polymeric nanocomposites has widely been explored for designing novel materials owing to their extraordinary combination of properties, such as high intrinsic mobility, high Young's modulus and thermal conductivity, excellent electrical conductivity and optical transmittance.25–29 It is envisaged that its large specific area and the oxygen functionalities in graphene allow the enhanced interactions with the polymeric matrix and consequently the better thermal, mechanical, conductive properties.30 Although there are some reports addressing structure–property relations in polymeric blends/nanocomposites containing graphene,31 the effect of grapheme on the phase separation of polymer blends has received limited attention.32
It is well known that the phase-separation behavior of many binary polymer blends, such as poly(methyl methacrylate)/poly(styrene-co-acrylonitrile) (PMMA/SAN) blend,33 PMMA/poly(α-methyl styrene-co-acrylonitrile) (PMMA/α-MSAN) blend,34 polystyrene/poly(vinyl methyl ether) (PS/PVME) blend,35 polycarbonate/PMMA (PC/PMMA) blend,36 and PS/poly(methyl methacrylate-stat-cyclohexyl methacrylate) (PS/PMsC) blend,37 shows typical nonlinearity and their equilibrium phase separation temperature can be hardly obtained through the simple linear tion. Such similar nonlinear phase separation behavior is also reported in PMMA/SAN/clay nanocomposite,38 PMMA/poly(vinyl acetate)/clay (PMMA/PVAc/clay) nanocomposite39 and PMMA/SAN/SiO2 nanocomposite.40 It was found in our previous results33–35 that the temperature dependence of SD phase separation behavior for binary polymer blends could be well described using the time-temperature superposition (TTS) principle and the Williams–Landel–Ferry (WLF) function. As is known, the relaxation time of amorphous polymers controlled by diffusion of segments and the temperature dependence of segment diffusion follow the TTS principle in the glass transition region.41,42 Hence, we believe that the viscous diffusion of macromolecular segments during phase separation plays an important role in phase-separation kinetics. For the nanocomposites, the effect of nano-filler on the viscous diffusion of macromolecular segments and the applicability of TTS principle and WLF function to their phase behavior should be further explored.
Although CRGO is black filler, the presence of a very small amount of CRGO hardly affects the transparency of the thin film samples. Hence, time-resolved small angle laser light scattering (SALLS) is also sensitive to the morphology change of multiphase/multi-component systems during phase separation process. In this work, PMMA/SAN blend was selected as a model blend matrix and the influence of two dimensional CRGO on the kinetics of phase separation in such blend matrix was investigated through time-resolved SALLS apparatus. Furthermore, we also try to explore the applicability of TTS principle and WLF function to describe the temperature dependence of phase separation for the nano-fillers filled blend system.
2. Experimental
2.1 Materials
Poly(methyl methacrylate) (PMMA) (IF850, Mn = 5.0 × 10⁴, Mw/Mn = 1.5, LG Co. Ltd, South Korea) and poly(styrene-co-acrylonitrile) (SAN) (PN-127H, AN content of 32 wt%, Mn = 5.2 × 10⁴, Mw/Mn = 1.7, Chimei Co. Ltd, Taiwan, China) were dried in vacuum oven at 100 °C for 24 h before use to remove any moisture. Natural graphite (99.8% pure grade, 325 mesh) was obtained from Alfa Aesar Co. Ltd, UK.
2.2 Sample preparation
Graphene oxide (GO) was synthesized from natural graphite powder via modified Hummers' method.43,44 Hydrazine hydrate (85%) was used as a reductant in the conversion of GO to CRGO.45 The details of the CRGO preparation were reported in our previous work.46 CRGO was dispersed into methyl ethyl ketone (MEK) and the suspension was ultrasonicated for 15 min before adding PMMA/SAN with different compositions at 5 wt% to the suspension. The mixture was then sonicated for another 15 min to achieve the uniform dispersion of CRGO in the PMMA/SAN blend solution. Subsequently, the suspension was cast onto the cover glasses at 30 °C. After the solvent evaporated at an ambient environment for 24 h, the samples were dried at 50 °C, 70 °C, 90 °C, 110 °C, 130 °C for another 5 days in vacuum oven to remove the residual MEK. Here, the PMMA/SAN blends denoted by A/B and PMMA/SAN/nanoparticle samples denoted by A/B/x were prepared by solution casting, where A and B are the volume fraction of PMMA and SAN in the binary blend, respectively. And x is the volume fraction of nanoparticles compared to the total amount of polymers.
2.3 Characterization
A custom-made time-resolved small angle laser light scattering apparatus was used. The specifications and operation protocols of this system were detailed in the literatures,47,48 as well as in our previous papers.33–35 During the isothermal annealing experiment, homogeneous samples were first annealed at 140 °C for 10 min, and then heated to the appointed temperatures for isothermal measurements. The accuracy of temperature control was about ±0.1 °C. In the non-isothermal experiments, the samples were annealed on a hot stage at 140 °C for 10 min, and then heated up at different heating rates. None of the samples exhibited any yellowing during the whole measurement procedure, indicating that no obvious degradation had occurred.
The dispersion of CRGO and morphological evolution of nanocomposites were observed by a transmission electron microscope (TEM, JEM 1200EX, Japan). The samples subjected to different annealing processes were quenched to freeze their morphology. Their TEM specimens were prepared by embedding nanocomposites in the epoxy resin (solidified at ambient temperature for 24 h) and ultramicro-toming with a diamond knife were prepared by ultramicro-toming with a diamond knife.
3. Theoretical background
Generally, the scattering intensity evolution associated with the gradient of concentration fluctuation size at the early stage of phase-separation for binary polymer blends can be described by the linear theory of Cahn and Hilliard.12,49 For ternary polymer nanocomposites, if the mechanism of phase separation hardly changes, such theory can be also applicable to describe the intensity evolution at the early stage of spinodal decomposition. Taking the thermal fluctuation of stable binary polymer blends into consideration, Cook50 modified the Cahn–Hilliard function into| | | I(q, t) = Is(q) + [I(q, 0) − Is(q)]exp[2R(q)t] | (1) |
in which Is(q) is the scattering intensity of the stable system. And the growth rate or amplification factor R(q) is further related by| |  | (2) |
in which M is the mobility coefficient of molecules, k is the energy gradient coefficient arising from contributions of composition gradient to the energy, fm is the mean field free energy of mixing, ϕ refers to volume fraction of one of the components. Here, q = 4π/λ![[thin space (1/6-em)]](https://www.rsc.org/images/entities/char_2009.gif) sin(θ/2) is the scattering vector, λ is the corresponding wavelength and θ is the scattering angle. The apparent diffusion coefficient Dapp included in eqn (2) describes the uphill diffusion during spinodal decomposition and is given as follows:
sin(θ/2) is the scattering vector, λ is the corresponding wavelength and θ is the scattering angle. The apparent diffusion coefficient Dapp included in eqn (2) describes the uphill diffusion during spinodal decomposition and is given as follows:| |  | (3) |
From eqn (1), it is obvious that plots of ln[(I(q, t) − Is(q))/(I(q, 0) − Is(q, 0)] vs. t yields R(q) and then from eqn (2) and (3), the Dapp and 2Mk values can be obtained from the intercept and slope of the plot of R(q)/q2vs. q2.
Differentiation of eqn (3) with respect of q yields the characteristic scattering vector qm with Im at the early stage of phase separation, the scattering vector corresponding to the correlation length of maximal growth Λ = 1/qm, which is no function of time as related by:
| |  | (4) |
In the late stage of SD, the prevalent mechanism is the nonlinear phase growth that causes the scattering halo to shrink to a smaller diameter, which is the coarsening process of the phase domains. This process follows the power laws, in which the time evolution of qm and I(qm) in the late stage is described as51,52
4. Results and discussion
4.1 Effect of CRGO on the non-isothermal phase separation behavior for PMMA/SAN blends
The typically nonlinear dependence of phase separation behaviors on the heating rate k for PMMA/SAN, PMMA/α-MSAN, PS/PVME binary blends were reported in our previous research,33–35 while the similar nonlinear dependence was also found in PMMA/SAN/SiO2, PMMA/SAN/clay and PMMA/PVAc/clay ternary nanocomposites.38–40Fig. 1(a) shows the temperature dependence of normalized scattering intensity IN for PMMA/SAN (57/43) blend at different heating rates and the corresponding qm. The plots of INvs. T for such blend at various heating rates are nearly similar. As shown in Fig. 1(a), the cloud point Tc can be obtained from the intersections of the tangents for the curves. It is obvious that their Tc also depends intensely on the heating rate and shifts towards the higher temperature with the increase of heating rate. Fig. 1(b) and (c) show the heating rate dependence of Tc for unfilled and 0.2 vol% CRGO filled PMMA/SAN (57/43) and (37/63) systems, respectively. Here, it should be noted that in our previous research, PMMA/SAN 70/30 (w/w), namely PMMA/SAN 67/33 (v/v), is found to be the critical composition for such blend.40 Hence, PMMA/SAN 57/43 is the near-critical composition, while 37/63 is the off-critical composition. It should be noted that the plots for such four systems appear as curves, rather than straight lines, which is similar to previous results for some other polymer blends and composites. This indicates that the presence of CRGO hardly changes the nonlinear dependence of phase separation behaviors on the heating rate for the blend matrix with near-critical or off-critical composition. Hence, the equilibrium phase-separation temperature of PMMA/SAN blends and PMMA/SAN/CRGO nanocomposites can hardly be obtained through the simple linear extrapolation of heating rate to zero. On the other hand, the semi-logarithmic plots of cloud point against heating rate for unfilled and 0.2 vol% CRGO filled PMMA/SAN systems all show good linearity, which indicates that the dependence of cloud point on heating rate for PMMA/SAN blends and PMMA/SAN/CRGO nanocomposites follows the logarithm function in the investigated heating rate range, which is described as| | Tc = A![[thin space (1/6-em)]](https://www.rsc.org/images/entities/char_2009.gif) ln ln![[thin space (1/6-em)]](https://www.rsc.org/images/entities/char_2009.gif) k + T0 k + T0 | (7) |
where A is the slope reflecting the heating rate dependence and T0 is the cloud point at a heating rate of 1 °C min−1. It is found that the slopes A are very similar for unfilled and filled PMMA/SAN (57/43) systems, indicating that the existence of CRGO has no effect on the sensitivity of the heating rate dependence of cloud point for PMMA/SAN blend with the near-critical composition. On the other hand, the slope for filled PMMA/SAN (37/63) nanocomposite is lower than that of unfilled blend and the slopes for unfilled and filled PMMA/SAN (37/63) systems are remarkably higher than those for PMMA/SAN (57/43) systems, suggesting the heating rate dependence of cloud point for the blend with off-critical composition is more sensitive than that for the blend with near-critical composition. Such result is also consistent with that found in PMMA/SMA blend.53 The cloud point is just the apparent initial temperature of phase separation during non-isothermal heating process. For the blend with near-critical composition, the metastable regime is quite narrow and the SD phase separation occurs at any investigated heating rates. However, the metastable regime for the blend with off-critical composition is relatively wide and the NG phase separation occurs at low heating rates, while the SD phase separation occurs at high heating rates. It can be found in our previous research that the presence of CRGO enlarges the metastable regime,46 especially for the blend with off-critical composition. Hence, the transition from NG to SD phase separation may occur in the nanocomposite at higher heating rates, resulting in the decrease of the sensitivity for the heating rate dependence of cloud point.
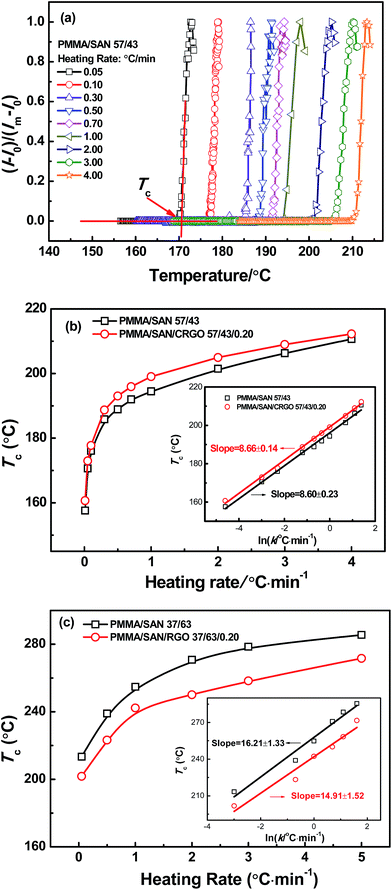 |
| | Fig. 1 (a) Temperature dependence of normalized scattering intensity for PMMA/SAN (57/43) blend at various heating rates and the corresponding qm. Heating rate dependence of cloud point Tc for (b) unfilled, 0.2 vol% filled PMMA/SAN (57/43) systems and (c) unfilled, filled PMMA/SAN (37/63) systems; the insets present semi-logarithmic curves of heating rate dependence of cloud point. | |
Fig. 2 shows the dependence of cloud points on PMMA content for unfilled and 0.20 vol% CRGO filled PMMA/SAN systems at the heating rate of 0.50 °C min−1. Here, it should be noted that when the content of PMMA in the blends and nanocomposites is lower than 28 vol% or higher than 78 vol%, their cloud points are higher than the thermal degradation temperatures of two polymers (PMMA: 282 °C and SAN: 275 °C). It can be found that the introduction of CRGO into PMMA/SAN blend matrix hardly changes their LCST characteristics and their critical composition, but the influence of CRGO on the cloud points obviously depends on the blend matrix composition of PMMA/SAN. Exactly, the presence of CRGO results in the slight increase of Tc for PMMA/SAN blend matrix with near-critical composition and the relatively remarkable decrease of Tc for the blend with off-critical composition. Such result looks conflicting with our previous research results, where the effect of CRGO on the phase separation temperature of PMMA/SAN matrix is almost independent on the composition of their blend matrix.46 It should be noted again that Tc is different from the binodal temperature Tb or the spinodal temperature Ts, and the non-isothermal phase separation at the heating rate of 0.50 °C min−1for the blend matrix with near-critical or off-critical composition follows SD or NG mechanisms, respectively. Namely, the increase of Tc for the blend matrix with near-critical composition just implies the increment of their Ts, while the decrease of Tc for the blend matrix with off-critical composition means the decline of their Tb. Hence, the dependence of Tc on the composition of their blend matrix is still consistent with the influence of CRGO on their Ts and Tb in our previous research. The increase or decrease of Tc depending on the blend composition is also found in two other systems, PMMA/SAN/SiO2![[thin space (1/6-em)]](https://www.rsc.org/images/entities/char_2009.gif) 40 and PMMA/SAN/clay38 nanocomposites. Here, CRGO may act as a nucleating agent to reduce the nucleation activation energy for the blend matrix with off-critical composition during the NG phase separation, resulting in the decline of their Tc.32 On the other hand, the absorption and mechanical barrier effect of CRGO on the macromolecular segment in the blend matrix with near-critical composition may retard the concentration fluctuation at the early stage of SD phase separation to cause the increment of their Tc. Therefore, different roles of CRGO in affecting NG and SD phase separation process may result in different variation trends of their Tcs for the blend matrix with different compositions.
40 and PMMA/SAN/clay38 nanocomposites. Here, CRGO may act as a nucleating agent to reduce the nucleation activation energy for the blend matrix with off-critical composition during the NG phase separation, resulting in the decline of their Tc.32 On the other hand, the absorption and mechanical barrier effect of CRGO on the macromolecular segment in the blend matrix with near-critical composition may retard the concentration fluctuation at the early stage of SD phase separation to cause the increment of their Tc. Therefore, different roles of CRGO in affecting NG and SD phase separation process may result in different variation trends of their Tcs for the blend matrix with different compositions.
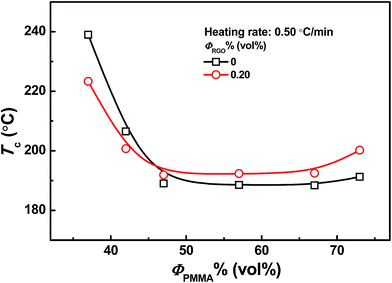 |
| | Fig. 2 Dependence of cloud points on PMMA content for unfilled and 0.2 vol% CRGO filled PMMA/SAN systems at the heating rate of 0.50 °C min−1. | |
4.2 Effect of CRGO on the isothermal phase separation behavior for PMMA/SAN blends
In order to investigate further the effect of CRGO on the kinetics of phase separation for PMMA/SAN blend matrix, the time evolution of their scattering profiles during isothermal annealing at different stages should be examined. To avoid the influence of background light, the real-time scattering intensity I(q, t) at the beginning of the experiment is subtracted. It can be observed from Fig. 3 that the characteristic scattering vectors (qm) with maximum scattering intensity Im(q, t) for PMMA/SAN blend and PMMA/SAN/CRGO nanocomposite do not vary with time at the early stage of phase separation, which is ascribed to the fixed spatial period of concentration fluctuation at this stage,42 while the scattering intensity increases exponentially with time. Such phenomenon indicates that the phase-separation behaviors of PMMA/SAN blend and PMMA/SAN/CRGO nanocomposite both follow the SD mechanism with the investigated temperature range (170–210 °C). Furthermore, qm for PMMA/SAN blend at the early stage is bigger than that for PMMA/SAN/CRGO nanocomposite and the scattering ring occurs earlier in the blend than in the nanocomposite, while the reduction of qm for the blend at the intermediate and late stages is obviously faster than that for the nanocomposite, suggesting that the presence of CRGO may result in increasing the domain size for the blend matrix at the early stage of phase separation and retarding the occurrence of phase separation and phase coarsening.
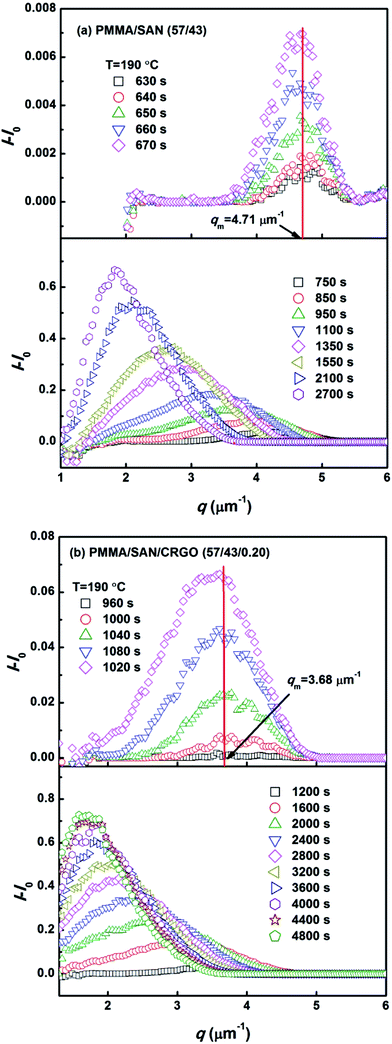 |
| | Fig. 3 Evolution of relative intensity versus q for (a) PMMA/SAN (57/43) blend and (b) PMMA/SAN/CRGO (57/43/0.2) nanocomposite at 190 °C during different stages. | |
To make a reliable comparison between the time evolution of scattering light at various annealing temperatures and to avoid the negative effect of sample diversity resulting from the concentration inhomogeneity and the thickness difference of various samples, I(t) at given q(t) is normalized as (I(t) − I(0))/(Im − I(0)), in which I(0) is the initial intensity at the beginning of experiment and Im is the maximum value of I(t) during isothermal annealing process. Fig. 4 gives semi-logarithmic plots of normalized scattering light intensity versus time for PMMA/SAN (57/43) blend and (b) PMMA/SAN/CRGO (57/43/0.2) nanocomposite during isothermal annealing at different temperatures. It is noted that all the curves at various temperatures are nearly similar and parallel to each other for unfilled and filled systems, implying that they can superpose with each other and then form a master curve by horizontal shifting. Here, the delay time tD is defined as the time when the sample begins to phase separate after reaching the given annealing temperature. Namely, tD is just the time when the normalized scattering intensity begins to increase remarkably, as shown in Fig. 4. It is noted that the delay time tD strongly depends on the annealing temperature and decreases with the increase of annealing temperature. The dependence of tD on the annealing temperature for unfilled and filled PMMA/SAN systems is given in Fig. 5. Here, it can be found obviously from Fig. 5 that tDs for two filled system are longer than those for two unfilled system, indicating that the incorporation of clay may postpone the occurrence of concentration fluctuation for the blend matrix at the early stage of SD phase separation. In other words, the presence of CRGO increases the phase stability of PMMA/SAN blend matrix. The inhibition of concentration fluctuation for the blend matrix is mainly manifested in two aspects: the limitation of neighboring macromolecular movement induced by the adsorption of CRGO on the polymer chain and the mechanical barrier effect of lamellar CRGO structure on the macromolecular chain. The aforementioned similarity and parallelism of the normalized scattering intensity curves at various temperatures may suggest the applicability of the TTS principle and WLF function to describe the temperature dependence of phase-separation behavior for the unfilled and filled systems. Here, we attempt to explore whether the temperature dependence of tD for the unfilled and filled systems is fitted by the WLF function54
| |  | (8) |
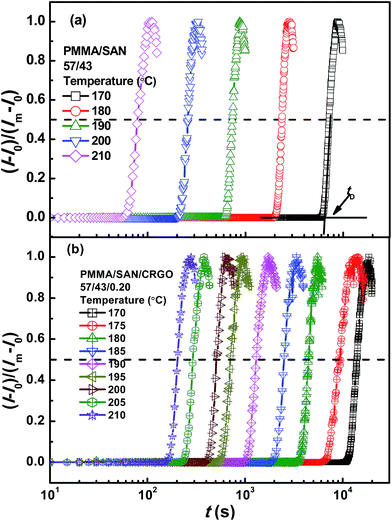 |
| | Fig. 4 Time dependence of normalized scattering intensity for (a) PMMA/SAN (57/43) blend and (b) PMMA/SAN/CRGO (57/43/0.2) nanocomposite at different annealing temperatures. | |
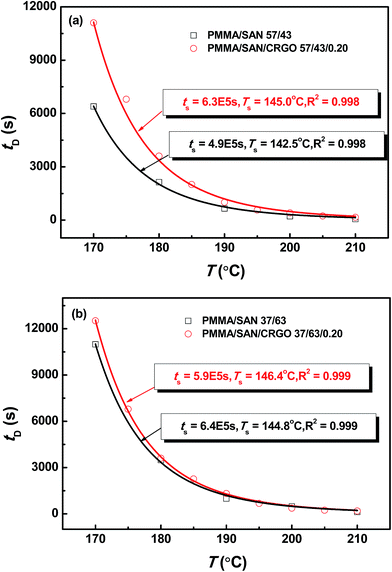 |
| | Fig. 5 Temperature dependence of delay time tD for PMMA/SAN blends and PMMA/SAN/CRGO nanocomposites. The solid lines correspond to the results simulated by eqn (9). | |
Assuming that C1 = 8.86 K and C2 = 101.6 K, the WLF function can be written as
| |  | (9) |
As shown in Fig. 5, the delay time tDs of unfilled and filled PMMA/SAN (57/43), (37/63) systems all obey the TTS principle and can be described by the WLF function well, which means that the introduction of CRGO may hardly change the viscoelastic essence of phase separation.
The presence of CRGO affects the thermodynamics of PMMA/SAN blends (including Tc and tD). It can be also noted from Fig. 4 that the slopes of normalized scattering intensity for unfilled and filled systems are different, indicating that their kinetics of phase separation is also distinct. Hence, the influence of clay on the kinetics of phase separation should be explored further. Fig. 6 shows the semilogarithmic plots of ln(I − Is) vs. time for different q ranging from 4.23 to 5.19 μm−1 at 180 °C. A satisfactory linearity exists at the early stage of SD, indicating that the phase-separation behavior follows the linear Cahn–Hilliard theory. According to the eqn (1), the value of R(q) as a function of q can be obtained from the initial slope of ln(I − Is) vs. time curves in Fig. 6. Accordance with eqn (2), R(q)/q2 were plotted against q2 in Fig. 7, and Dapp(T) and 2Mk(T) at different temperatures can be obtained from the intercepts and slopes of those plots. Under the investigated temperatures ranging from 180 to 210 °C, the plots of R(q)/q2vs. q2 follow linear relationship well at large q value. At small q values, the intensity is strongly influenced by the center intensity and the linear function is invalid. Hence, only the plots at large q values are shown in Fig. 7.
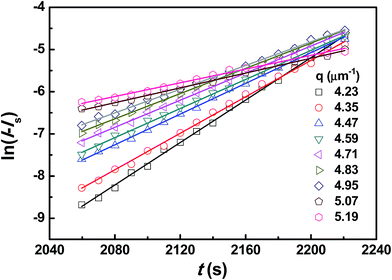 |
| | Fig. 6 Time evolution of ln(I − Is) of PMMA/SAN (57/43) blend for various q during the early stage of phase separation at 180 °C. | |
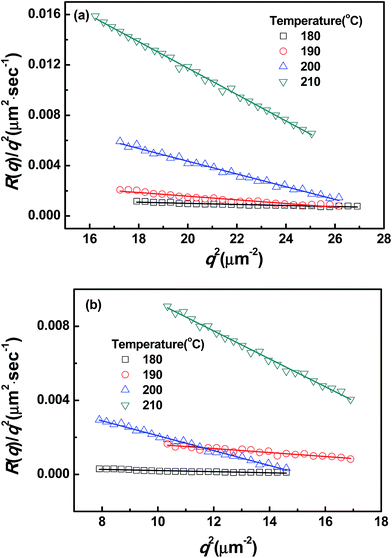 |
| | Fig. 7 Relationships between R(q)/q2 and q2 for (a) PMMA/SAN (57/43) blends and (b) PMMA/SAN/CRGO (57/43/0.2) nanocomposites at different temperatures. | |
Fig. 8 demonstrates the plots of Dapp(T) and 2Mk(T) for the unfilled and filled PMMA/SAN systems. It is obvious that for unfilled and filled systems, all the Dapp and 2Mk values nearly increase exponentially with the temperature in the investigated temperature region, similar with our previously reported PMMA/α-MSAN, PMMA/SAN/clay and PMMA/PVAc/clay systems.34,38,39 Such nonlinear phase-separation behavior is consistent with the nonlinear relationship between Tc and k during non-isothermal phase separation as mentioned above. Hence, the equilibrium spinodal temperature can be hardly obtained from the simple linear extrapolation of Dapp. The temperature dependence of delay time can be described by the WLF function. Hence, the applicability of the TTS principle to Dapp(T) and 2Mk(T) is also explored here. The solid lines are the results simulated as follows
| |  | (10) |
| |  | (11) |
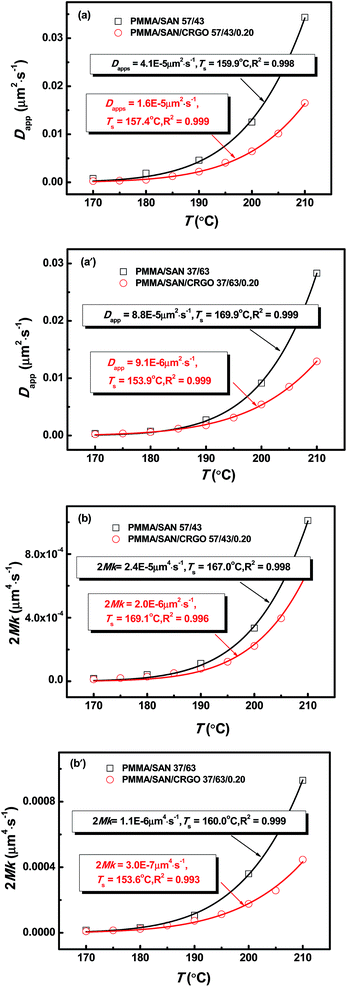 |
| | Fig. 8 Temperature dependence of (a) Dapp(T) and (b) 2Mk(T) for PMMA/SAN blends and PMMA/SAN/CRGO nanocomposites. The solid lines correspond to the results simulated by eqn (10) and (11), respectively. | |
It is obvious that the temperature dependence of Dapp(T) and 2Mk(T) also follows the TTS principle and can be also described well by the above-mentioned WLF function. Furthermore, it is also found that the Dapp values for the unfilled blends are obviously higher than those for the filled nanocomposites, indicating that the uphill diffusion at the early stage of SD for filled system is markedly retarded by the clay.
To further check the consistency of scattering data, the theoretical qm values calculated from Dapp and 2Mk as obtained above should be compared with the experimental values of qm. Fig. 9 shows a comparison between the temperature dependence of experimental values of qm and theoretical ones calculated using eqn (4). The theoretical values satisfactorily agree with the experimental data (with an experimental error of less than 5%), which indicates that the Dapp and 2Mk values obtained from light scattering experiments are reliable. Moreover, it is found that the qm values are almost independent of temperature, similar to the results for other blends reported in the literatures.34,37 On the other hand, the values of qm for PMMA/SAN (37/63) blends and PMMA/SAN/CRGO (37/63/0.20) nanocomposites are almost equivalent, while the qm values for PMMA/SAN (57/43) blends are higher than those for PMMA/SAN/CRGO (57/43/0.20) nanocomposites. In other words, the introduction of CRGO hardly affects the domain size of blend matrix with the minority of PMMA (PMMA/SAN 37/63) at the early stage of phase separation, but increases that of blend matrix with the majority of PMMA (PMMA/SAN 57/43). Fig. 10 shows the TEM micrographs of 0.2 vol% CRGO filled PMMA/SAN (57/43) and (37/63) nanocomposites after being annealed at 180 °C for 1500 s. It can be found that the well-dispersed CRGOs in two homogeneous blend matrices both tend to be selectively located in the SAN-rich phase (dark region) with the evolution of phase separation. Hence, the selective dispersion of CRGO in the SAN-rich phase may result in different effect of CRGO on the domain size for the blend matrix with different composition at the early stage of SD.
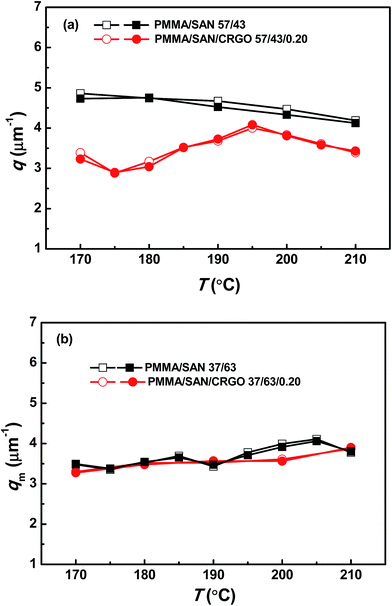 |
| | Fig. 9 Temperature dependence of scattering vector with maximum intensity qm for PMMA/SAN blends and PMMA/SAN/CRGO nanocomposites: experimental values (open symbols) and theoretical values (solid symbols) calculated by eqn (4). | |
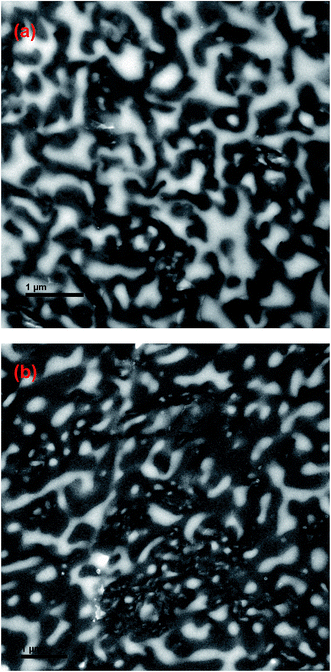 |
| | Fig. 10 TEM images for (a) PMMA/SAN/CRGO (57/43/0.2) nanocomposite and (b) PMMA/SAN/CRGO (37/63/0.2) nanocomposite after being annealed at 180 °C for 1500 s. | |
To obtain comprehensive parameters characterizing the kinetics of SD over a wide timescale, including both the early and late stage, the maximum scattering intensity (Im) and qm with Im for PMMA/SAN (57/43) blends and PMMA/SAN/CRGO (57/43/0.20) nanocomposites at 190 °C are plotted as a function of time in Fig. 11. At the early stage of SD, the qm values for two systems are constant, suggesting that the filled and unfilled systems follow the linear Cahn–Hilliard theory. In the later-stage SD the nonlinearity in the time evolution of the amplitude of the concentration fluctuation becomes increasingly important and the phase-separated structure coarsens with time. In general, time evolutions of qm(t) and Im(t) can be expressed by the scaling laws: qm(t) − t−α and Im(t) − tβ. The later-stage SD can be divided into intermediate stage and late stage.55 At the intermediate stage of SD, both the amplitude and wavelength of the concentration fluctuation increase with time. In the late stage of SD, the interfaces between two coexistence phases are well developed and the local concentration of each component in the domains approaches the equilibrium value. However, the size of domains is still growing to reduce the excess free energy associated with the interfacial area. The scaling exponents β and α in the intermediate stage exhibits the relationship of β > 3α, while the relationship changes into β = 3α in the late stage. It can be found in Fig. 11 that the relationships between β and α for the unfilled and filled systems both follow the above-mentioned theory. Furthermore, the introduction of CRGO results in the decrease of β and α values for the blend matrix in the intermediate and late stages and the delay of starting time for the intermediate and late stages of SD, indicating that the presence of filler may inhibit the domain coarsening of blend matrix. The similar phase separation behaviors at the late stage for unfilled and filled PMMA/SAN (57/43), (37/63) systems can be also found under different annealing temperatures, as shown in Fig. 12 and 13.
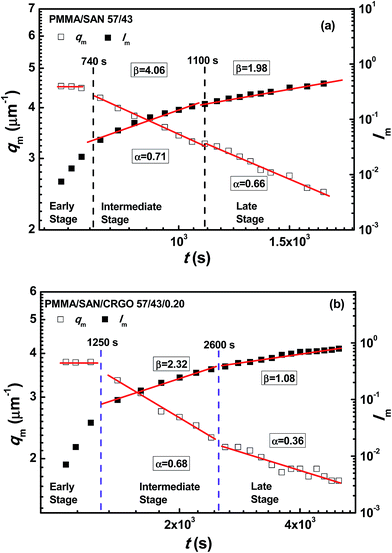 |
| | Fig. 11 Time evolution of scattering vector with maximum intensity qm and maximum scattering intensity Im for (a) PMMA/SAN (57/43) blends and (b) PMMA/SAN/CRGO (57/43/0.20) nanocomposites at 190 °C. | |
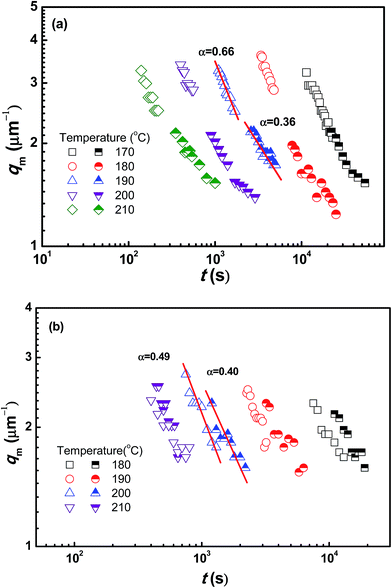 |
| | Fig. 12 Time evolution of scattering vector with maximum intensity qm for (a) PMMA/SAN (57/43) blends (open symbols), PMMA/SAN/CRGO (57/43/0.20) nanocomposites (half solid symbols) and (b) PMMA/SAN (37/63) blends (open symbols), PMMA/SAN/CRGO (37/63/0.20) nanocomposites (half solid symbols) at different annealing temperatures. | |
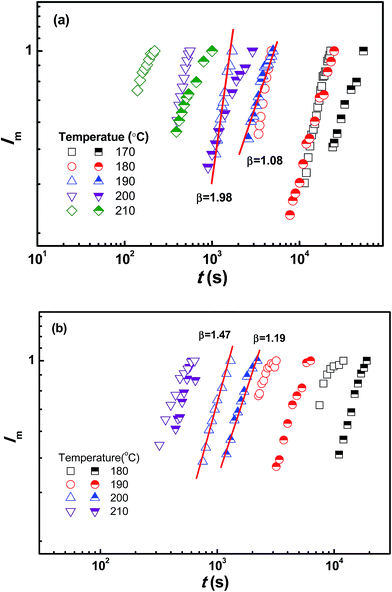 |
| | Fig. 13 Time evolution of maximum scattering intensity Im for (a) PMMA/SAN (57/43) blends (open symbols), PMMA/SAN/CRGO (57/43/0.20) nanocomposites (half solid symbols) and (b) PMMA/SAN (37/63) blends (open symbols), PMMA/SAN/CRGO (37/63/0.20) nanocomposites (half solid symbols) at different annealing temperatures. | |
As mentioned above, the delay time tD of normalized scattering intensity at the early stage of SD under different temperatures can be described by WLF-like function. Here, the relaxation time τ(Im) at the late stage of SD, defined as the time at which Im(qm) increases to the same value under various temperatures, can be obtained from Fig. 13. Plots of τ(Im) versus T for the unfilled, filled PMMA/SAN 57/43 and 37/63 systems are shown in Fig. 14. Similar to tD of normalized scattering intensity at the early stage of SD, the consistency of simulated results and experimental results indicates that the WLF-like function can be also applied satisfactorily to the relationships ate the late stage of SD. Accordingly, the temperature dependence of τ(Im) can be described as follows
| |  | (12) |
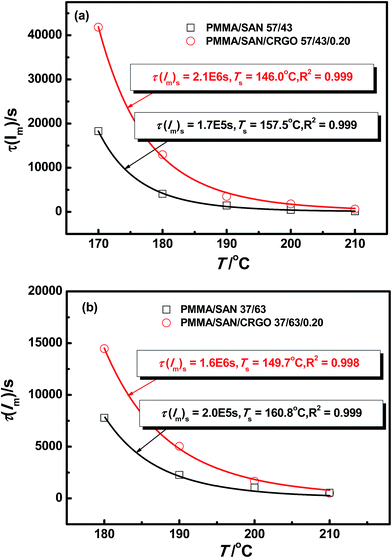 |
| | Fig. 14 Temperature dependence of τ(Im) for PMMA/SAN blends and PMMA/SAN/CRGO nanocomposites. The solid lines correspond to the results simulated by eqn (12). | |
It is found that the TTS principle and WLF function are applicable to describe the temperature dependence of delay time tD, apparent diffusion coefficient Dapp(T) at the early stage of SD, as well as the phase coarsening behavior at the late stage of SD for the unfilled and CRGO-filled PMMA/SAN systems. This may indicate that the introduction of CRGO hardly changes the viscous diffusion essence of macromolecular chains during phase separation, but the mechanical barrier effect of CRGO on the macromolecular viscous diffusion may just result in the decrease of Dapp(T) and the postpone of tD and τ(Im). Furthermore, the hindering effect of CRGO in PMMA/SAN (57/43) system during SD phase separation is more obvious than that in PMMA/SAN (37/63) system. Namely, the hindering effect of CRGO on the SD phase separation behavior of PMMA/SAN blend depends on the composition of blend matrix. Such phenomenon is similar with the results for PMMA/SAN/SiO2 systems in our previous research.40 The π–π conjugation occurs between CRGO honeycomb and SAN benzene ring, which might lead to the preferential localization of CRGO in the SAN-rich phase after the phase separation of blend matrix, as shown in Fig. 10.56 The evaluation of the wetting coefficient ω also confirms the location of CRGO in the SAN-rich phase.46 Hence, when SAN is the minority of blend matrix (PMMA/SAN 57/43), the selective location of CRGO may result in more obvious viscosity increment and then more remarkable hindering effect on the SD phase separation behavior of blend matrix. When SAN is the majority, the weakened hindering effect of CRGO on the SD behavior of 37/63 PMMA/SAN matrix can be understood. However, in the metastable regime CRGO may act as a nucleating agent to reduce the nucleation activation energy for the blend matrix with off-critical composition, resulting in the earlier occurrence of NG phase separation.
5. Conclusions
The nonlinear phase separation behavior in PMMA/SAN blends during isothermal and non-isothermal annealing process has been investigated in the presence of very small amount of CRGO by using time-resolved SALLS. During the non-isothermal process, a quantitative logarithm function can be established to describe the relationship between Tc and k as given by Tc = A![[thin space (1/6-em)]](https://www.rsc.org/images/entities/char_2009.gif) ln
ln![[thin space (1/6-em)]](https://www.rsc.org/images/entities/char_2009.gif) k + T0 for the unfilled and filled systems, in which the parameter A is reflecting the heating rate dependence. On the other hand, for the isothermal phase separation process, the TTS principle and WLF function are applicable to describe the nonlinear temperature dependence of delay time tD and apparent diffusion coefficient Dapp(T) at the early stage of SD, as well as the phase coarsening behavior at the late stage of SD for the unfilled and CRGO-filled PMMA/SAN systems. Such results may indicate that the introduction of CRGO hardly changes the viscous diffusion essence of macromolecular chains during phase separation, but the mechanical barrier effect of CRGO on the macromolecular viscous diffusion may just result in the decrease of Dapp(T) and the postpone of tD and τ(Im). Furthermore, the effect of CRGO on the isothermal and non-isothermal phase-separation behavior of blend matrix is found to be dependent on the composition of the blend matrix. For the blend matrix with off-critical composition, CRGO may act as a nucleating agent to result in the earlier occurrence of NG phase separation, while for the matrix with near-critical composition, the absorption and mechanical barrier effect of CRGO on the macromolecular segment may retard the concentration fluctuation at the early stage of SD phase separation to cause the delay of SD process. Besides, when SAN is the minority of blend matrix (PMMA/SAN 57/43), the selective location of CRGO may result in the more obvious viscosity increment and then the more remarkable hindering effect on the SD phase separation behavior of blend matrix.
k + T0 for the unfilled and filled systems, in which the parameter A is reflecting the heating rate dependence. On the other hand, for the isothermal phase separation process, the TTS principle and WLF function are applicable to describe the nonlinear temperature dependence of delay time tD and apparent diffusion coefficient Dapp(T) at the early stage of SD, as well as the phase coarsening behavior at the late stage of SD for the unfilled and CRGO-filled PMMA/SAN systems. Such results may indicate that the introduction of CRGO hardly changes the viscous diffusion essence of macromolecular chains during phase separation, but the mechanical barrier effect of CRGO on the macromolecular viscous diffusion may just result in the decrease of Dapp(T) and the postpone of tD and τ(Im). Furthermore, the effect of CRGO on the isothermal and non-isothermal phase-separation behavior of blend matrix is found to be dependent on the composition of the blend matrix. For the blend matrix with off-critical composition, CRGO may act as a nucleating agent to result in the earlier occurrence of NG phase separation, while for the matrix with near-critical composition, the absorption and mechanical barrier effect of CRGO on the macromolecular segment may retard the concentration fluctuation at the early stage of SD phase separation to cause the delay of SD process. Besides, when SAN is the minority of blend matrix (PMMA/SAN 57/43), the selective location of CRGO may result in the more obvious viscosity increment and then the more remarkable hindering effect on the SD phase separation behavior of blend matrix.
Acknowledgements
This work was financially supported by the National Natural Science Foundation of China (No. 51273173 and 51003093) and the Research Foundation of Education Bureau of Zhejiang Province (No. Y200908238).
Notes and references
- Y. Iwashita and H. Tanaka, Nat. Mater., 2006, 5, 147–152 CrossRef CAS PubMed.
- T. Kietzke, D. Neher, K. Landfester, R. Montenegro, R. Guntner and U. Scherf, Nat. Mater., 2003, 2, 408–412 CrossRef CAS PubMed.
- A. Balazs, T. Emrick and T. Russell, Nature, 2006, 314, 1107–1110 CAS.
- A. Taguet, P. Cassagnau and J. Lopez-Cuesta, Prog. Polym. Sci., 2014, 39, 1526–1563 CrossRef CAS PubMed.
- J. Vermant, G. Cioccolo, K. G. Nair and P. Moldenaers, Rheol. Acta, 2004, 43, 529–538 CrossRef CAS.
- S. Vandebril, J. Vermant and P. Moldenaers, Soft Matter, 2010, 6, 3353–3362 RSC.
- F. Fenouillot, P. Cassagnau and J. Majeste, Polymer, 2009, 50, 1333–1350 CrossRef CAS PubMed.
- A. V. Poyekar, A. R. Bhattacharyya, A. S. Panwar, G. P. Simon and D. S. Sutar, ACS Appl. Mater. Interfaces, 2014, 6, 11054–11067 CAS.
- X. Gao, S. M. Zhang, F. Mai, L. Lin, Y. Deng, H. Deng and Q. Fu, J. Mater. Chem., 2011, 21, 6401–6408 RSC.
- J. F. Gao, D. X. Yan, B. Yuan, H. D. Huang and Z. M. Li, Compos. Sci. Technol., 2010, 70, 1973 CrossRef CAS PubMed.
- H. Yui, G. Z. Wu, H. Sano, M. Sumita and K. Kino, Polymer, 2006, 47, 3599–3608 CrossRef CAS PubMed.
- P. C. Hohenberg and B. I. Halperin, Rev. Mod. Phys., 1977, 49, 435–479 CrossRef CAS.
- J. W. Cahn, J. Chem. Phys., 1965, 42, 93–99 CrossRef CAS PubMed.
- I. M. Lifshitz and V. Slyozov, J. Phys. Chem. Solids, 1961, 19, 35–50 CrossRef.
- C. Z. Wagner, Z. Elektrochem., 1961, 65, 581–591 CAS.
- H. Furukawa, Adv. Phys., 1985, 34, 703–750 CrossRef CAS PubMed.
- L. L. He, L. X. Zhang and H. J. Liang, J. Phys. Chem. B, 2008, 112, 4194–4203 CrossRef CAS PubMed.
- Y. Li and H. Shimizu, Macromolecules, 2008, 41, 5339–5344 CrossRef CAS.
- M. R. Bockstaller and E. L. Thomas, Phys. Rev. Lett., 2004, 93, 166106 CrossRef.
- T. Kietzke, D. Neher, M. Kumke, O. Ghazy, U. Ziener and K. Landfester, Small, 2007, 3, 1041–1048 CrossRef CAS PubMed.
- J. Gao, C. Huang, N. Wang, W. Yu and C. Zhou, Polymer, 2012, 53, 1772–1782 CrossRef CAS PubMed.
- P. Tian and G. D. Smith, J. Chem. Phys., 2006, 124, 184701 CrossRef PubMed.
- V. V. Ginzburg, Macromolecules, 2005, 38, 2362–2367 CrossRef CAS.
- A. J. Schultz, C. K. Hall and J. Genzer, Macromolecules, 2005, 38, 3007–3016 CrossRef CAS.
- Y. W. Zhu, S. Murali, W. W. Cai, X. S. Li, J. W. Suk, J. R. Potts and R. S. Ruoff, Adv. Mater., 2010, 22, 3906–3924 CrossRef CAS PubMed.
- C. N. R. Rao, A. K. Sood, K. S. Subrahmanyam and A. Govindaraj, Angew. Chem., Int. Ed., 2009, 48, 7752–7777 CrossRef CAS PubMed.
- G. Dai and J. L. Mishnaevsky, Comput. Mater. Sci., 2014, 95, 684–689 CrossRef CAS PubMed.
- H. Aguilar-Bolados, J. Brasero, M. A. Lopez-Manchado and M. Yazdani-Pedram, Composites, Part B, 2014, 67, 449–454 CrossRef CAS PubMed.
- F. You, D. Wang, J. Cao, X. Li, Z. M. Dang and G. H. Hu, Polym. Int., 2014, 63, 93–99 CrossRef CAS PubMed.
- T. Ramanathan, A. A. Abdala, S. Stankovich, D. A. Dikin, M. Herrera-Alonso, R. D. Piner, D. H. Adamson, H. C. Schniepp, X. Chen, R. S. Ruoff, S. T. Nguyen, I. A. Aksay, R. K. Prud'homme and L. C. Brinson, Nat. Nanotechnol., 2008, 3, 327–331 CrossRef CAS PubMed.
- H. Kim, A. A. Abdala and C. W. Macosko, Macromolecules, 2010, 43, 6515–6530 CrossRef CAS.
- G. Vleminckx, S. Bose, J. Leys, J. Vermant, M. Wübbenhorst, A. A. Abdala, C. Macosko and P. Moldenaers, ACS Appl. Mater. Interfaces, 2011, 3, 3172–3180 CAS.
- Q. Zheng, M. Peng, Y. H. Song and T. J. Zhao, Macromolecules, 2001, 34, 8483–8489 CrossRef CAS.
- M. Zuo, M. Peng and Q. Zheng, Polymer, 2005, 46, 11085–11092 CrossRef CAS PubMed.
- M. Zuo, Y. G. Shangguan and Q. Zheng, Polym. Int., 2009, 59, 787–795 Search PubMed.
- T. Kyu and J. M. Saldanha, Macromolecules, 1988, 21, 1021–1026 CrossRef CAS.
- V. Edel, Macromolecules, 1995, 28, 6219–6228 CrossRef CAS.
- D. Z. Pang, M. Zuo, J. S. Zhao and Q. Zheng, Chin. J. Polym. Sci., 2013, 31, 1470–1483 CrossRef CAS.
- J. S. Zhao, M. Zuo, C. Y. Lin and Q. Zheng, Chin. J. Polym. Sci., 2014, 32, 1419–1430 CrossRef CAS.
- M. Du, Q. Wu, M. Zuo and Q. Zheng, Eur. Polym. J., 2013, 49, 2721–2729 CrossRef CAS PubMed.
- G. Wisanrakkit and J. K. Gillham, J. Appl. Polym. Sci., 1990, 41, 2885–2929 CrossRef CAS PubMed.
- W. W. Christopher, W. D. Cook and A. A. Goodwin, Polymer, 1997, 38, 3251–3261 CrossRef.
- W. S. Hummers and R. E. Offeman, J. Am. Chem. Soc., 1958, 80, 1339 CrossRef CAS.
- Y. Q. Tan, Y. H. Song and Q. Zheng, Nanoscale, 2012, 4, 6997–7005 RSC.
- C. Ramirez and M. I. Osendi, Ceram. Int., 2014, 40, 11187–11192 CrossRef CAS PubMed.
- C. Y. Lin, M. Zuo, H. H. Li, T. Liu and Q. Zheng, Chin. J. Polym. Sci., 2015, 33, 1162–1175 CrossRef CAS.
- N. Parizel, F. Kempkes, C. Cirman, C. Picot and G. Weill, Polymer, 1998, 39, 291–298 CrossRef CAS.
- H. L. Snyder and P. Meakin, Macromolecules, 1983, 16, 757–762 CrossRef CAS.
- J. W. Cahn and J. E. Hilliard, J. Chem. Phys., 1958, 28, 258–267 CrossRef CAS PubMed.
- H. E. Cook, Acta Metall., 1970, 18, 297–306 CrossRef CAS.
- J. S. Langer, Acta Metall., 1973, 21, 1649–1659 CrossRef CAS.
- K. Binder and D. Stauffer, Phys. Rev. Lett., 1973, 33, 1006–1009 CrossRef.
- Y. Lin, Y. G. Shangguan, F. Chen, M. Zuo and Q. Zheng, Polym. Int., 2013, 62, 676–683 CrossRef CAS PubMed.
- M. L. Williams, R. F. Landel and J. D. Ferry, J. Am. Chem. Soc., 1955, 77, 3701–3707 CrossRef CAS.
- J. Kumaki and T. Hashimoto, Macromolecules, 1986, 19, 763–768 CrossRef CAS.
- Z. Yang, X. Shi, J. Yuan, H. Pu and Y. Liu, Appl. Surf. Sci., 2010, 257, 138–142 CrossRef CAS PubMed.
Footnote |
| † These authors contributed to the work equally and should be regarded as co-first authors. |
|
| This journal is © The Royal Society of Chemistry 2015 |
![[thin space (1/6-em)]](https://www.rsc.org/images/entities/char_2009.gif) ln
ln![[thin space (1/6-em)]](https://www.rsc.org/images/entities/char_2009.gif) k + T0 for the unfilled and filled CRGO-filled PMMA/SAN systems. During the isothermal process, the TTS principle and WLF function are applicable to describe the temperature dependence of nonlinear phase separation behaviors at the early and late stages of spinodal decomposition (SD) for such unfilled and filled systems, indicating that the introduction of CRGO hardly changes the viscous diffusion essence of macromolecular chains during phase separation. However, the mechanical barrier effect of CRGO on the macromolecular viscous diffusion may result in the delay of their phase separation behavior. Furthermore, the effect of CRGO on the isothermal and non-isothermal phase-separation behavior of the blend matrix is found to be dependent on the composition of the blend matrix. CRGO may act as a nucleating agent to result in the decrease of Tc for the PMMA/SAN 37/63 system, while the mechanical barrier effect of CRGO on the macromolecular segment may retard the concentration fluctuation at the early stage of SD phase separation to cause the increase of Tc for the PMMA/SAN 57/43 system. Besides, when SAN is the minority of the blend matrix (PMMA/SAN 57/43), the selective location of CRGO may result in the more obvious viscosity increment and then the more remarkable hindering effect on the SD phase separation behavior of blend matrix.
k + T0 for the unfilled and filled CRGO-filled PMMA/SAN systems. During the isothermal process, the TTS principle and WLF function are applicable to describe the temperature dependence of nonlinear phase separation behaviors at the early and late stages of spinodal decomposition (SD) for such unfilled and filled systems, indicating that the introduction of CRGO hardly changes the viscous diffusion essence of macromolecular chains during phase separation. However, the mechanical barrier effect of CRGO on the macromolecular viscous diffusion may result in the delay of their phase separation behavior. Furthermore, the effect of CRGO on the isothermal and non-isothermal phase-separation behavior of the blend matrix is found to be dependent on the composition of the blend matrix. CRGO may act as a nucleating agent to result in the decrease of Tc for the PMMA/SAN 37/63 system, while the mechanical barrier effect of CRGO on the macromolecular segment may retard the concentration fluctuation at the early stage of SD phase separation to cause the increase of Tc for the PMMA/SAN 57/43 system. Besides, when SAN is the minority of the blend matrix (PMMA/SAN 57/43), the selective location of CRGO may result in the more obvious viscosity increment and then the more remarkable hindering effect on the SD phase separation behavior of blend matrix.
![[thin space (1/6-em)]](https://www.rsc.org/images/entities/char_2009.gif) sin(θ/2) is the scattering vector, λ is the corresponding wavelength and θ is the scattering angle. The apparent diffusion coefficient Dapp included in eqn (2) describes the uphill diffusion during spinodal decomposition and is given as follows:
sin(θ/2) is the scattering vector, λ is the corresponding wavelength and θ is the scattering angle. The apparent diffusion coefficient Dapp included in eqn (2) describes the uphill diffusion during spinodal decomposition and is given as follows:

![[thin space (1/6-em)]](https://www.rsc.org/images/entities/char_2009.gif) ln
ln![[thin space (1/6-em)]](https://www.rsc.org/images/entities/char_2009.gif) k + T0
k + T0![[thin space (1/6-em)]](https://www.rsc.org/images/entities/char_2009.gif) 40 and PMMA/SAN/clay38 nanocomposites. Here, CRGO may act as a nucleating agent to reduce the nucleation activation energy for the blend matrix with off-critical composition during the NG phase separation, resulting in the decline of their Tc.32 On the other hand, the absorption and mechanical barrier effect of CRGO on the macromolecular segment in the blend matrix with near-critical composition may retard the concentration fluctuation at the early stage of SD phase separation to cause the increment of their Tc. Therefore, different roles of CRGO in affecting NG and SD phase separation process may result in different variation trends of their Tcs for the blend matrix with different compositions.
40 and PMMA/SAN/clay38 nanocomposites. Here, CRGO may act as a nucleating agent to reduce the nucleation activation energy for the blend matrix with off-critical composition during the NG phase separation, resulting in the decline of their Tc.32 On the other hand, the absorption and mechanical barrier effect of CRGO on the macromolecular segment in the blend matrix with near-critical composition may retard the concentration fluctuation at the early stage of SD phase separation to cause the increment of their Tc. Therefore, different roles of CRGO in affecting NG and SD phase separation process may result in different variation trends of their Tcs for the blend matrix with different compositions.


![[thin space (1/6-em)]](https://www.rsc.org/images/entities/char_2009.gif) ln
ln![[thin space (1/6-em)]](https://www.rsc.org/images/entities/char_2009.gif) k + T0 for the unfilled and filled systems, in which the parameter A is reflecting the heating rate dependence. On the other hand, for the isothermal phase separation process, the TTS principle and WLF function are applicable to describe the nonlinear temperature dependence of delay time tD and apparent diffusion coefficient Dapp(T) at the early stage of SD, as well as the phase coarsening behavior at the late stage of SD for the unfilled and CRGO-filled PMMA/SAN systems. Such results may indicate that the introduction of CRGO hardly changes the viscous diffusion essence of macromolecular chains during phase separation, but the mechanical barrier effect of CRGO on the macromolecular viscous diffusion may just result in the decrease of Dapp(T) and the postpone of tD and τ(Im). Furthermore, the effect of CRGO on the isothermal and non-isothermal phase-separation behavior of blend matrix is found to be dependent on the composition of the blend matrix. For the blend matrix with off-critical composition, CRGO may act as a nucleating agent to result in the earlier occurrence of NG phase separation, while for the matrix with near-critical composition, the absorption and mechanical barrier effect of CRGO on the macromolecular segment may retard the concentration fluctuation at the early stage of SD phase separation to cause the delay of SD process. Besides, when SAN is the minority of blend matrix (PMMA/SAN 57/43), the selective location of CRGO may result in the more obvious viscosity increment and then the more remarkable hindering effect on the SD phase separation behavior of blend matrix.
k + T0 for the unfilled and filled systems, in which the parameter A is reflecting the heating rate dependence. On the other hand, for the isothermal phase separation process, the TTS principle and WLF function are applicable to describe the nonlinear temperature dependence of delay time tD and apparent diffusion coefficient Dapp(T) at the early stage of SD, as well as the phase coarsening behavior at the late stage of SD for the unfilled and CRGO-filled PMMA/SAN systems. Such results may indicate that the introduction of CRGO hardly changes the viscous diffusion essence of macromolecular chains during phase separation, but the mechanical barrier effect of CRGO on the macromolecular viscous diffusion may just result in the decrease of Dapp(T) and the postpone of tD and τ(Im). Furthermore, the effect of CRGO on the isothermal and non-isothermal phase-separation behavior of blend matrix is found to be dependent on the composition of the blend matrix. For the blend matrix with off-critical composition, CRGO may act as a nucleating agent to result in the earlier occurrence of NG phase separation, while for the matrix with near-critical composition, the absorption and mechanical barrier effect of CRGO on the macromolecular segment may retard the concentration fluctuation at the early stage of SD phase separation to cause the delay of SD process. Besides, when SAN is the minority of blend matrix (PMMA/SAN 57/43), the selective location of CRGO may result in the more obvious viscosity increment and then the more remarkable hindering effect on the SD phase separation behavior of blend matrix.


