Nanostructured polyaniline incorporated ultrafiltration membrane for desalination of brackish water†
Raka
Mukherjee
a,
Rahul
Sharma
b,
Parveen
Saini
b and
Sirshendu
De
*a
aDepartment of Chemical Engineering, Indian Institute of Technology, Kharagpur, India. E-mail: sde@che.iitkgp.ernet.in; Fax: +91 3222 255303; Tel: +91 3222 283926
bPolymeric and Soft Materials Section, CSIR-National Physical Laboratory, New Delhi-110012, India
First published on 24th August 2015
Abstract
A novel salt rejecting ultrafiltration (UF) membrane was prepared by a facile, scalable route involving in situ incorporation of negatively charged polyaniline (PANI) nanoparticles within polysulfone (PSF). The incorporated PANI acts as a porogen and charge inducing agent, improving the porosity, permeability, hydrophilicity as well as the surface charge, leading to an enhancement of the permeate flux and improvement of the salt rejection capability. Specifically, 2 wt% PANI loading leads to a 25 times increase in the molecular weight cut-off (from 0.2 to 4.8 kDa). Also, there is improvement in porosity (from 20% to 64%), and a 2-fold increase in permeability (from 8 × 10⁻¹² to 16 × 10−12 m3 m−2 Pa−1 s−1). Surface hydrophilicity (reduction of the contact angle from 82° to 69°) was enhanced as well. All of these effects ultimately lead to a 2.5 times enhancement in the permeate flux (from 21 l m−2 h−1 to 38 l m−2 h−1 at 690 kPa transmembrane pressure, TMP and 20 l h−1 cross flow rate, CFR). This reflects the change in membrane behavior from nanofiltration (NF) to UF. An increase in zeta potential (from −4 mV to −28 mV at pH 7) results in salt rejection between 40–53%, equivalent to the NF performance. Developed UF membranes match the desalination performance of NF membranes showing a higher flux and lower energy requirement. Advantageously, these membranes are also found to be fouling resistant during salt solution filtration, requiring no extensive regeneration. Desalination performance of these membranes is also demonstrated using artificially synthesized seawater. These UF membranes may be exploited as a pretreatment for inlet load reduction to reverse osmosis or for the production of industrial process water. It is believed these charged membranes lay the foundation for the development of next generation desalination membranes possessing high flux and fouling resistant characteristics.
Water impactDesalination of saline water is a major challenge to researchers. Reverse osmosis is the most accepted technology for this purpose. But, it is an energy intensive process requiring a high transmembrane pressure drop beyond 25 atm. The process is also associated with membrane fouling and corresponding decline in throughput. Generally, nanofiltration (operating transmembrane pressure drop of about 15 atm) is used as a pre-treatment for reverse osmosis to control the membrane fouling. The present work highlights preparation of polyaniline impregnated ultrafiltration membrane that removes salt at a high throughput and lower operating transmembrane pressure drop. Therefore, it is envisaged that this membrane can be an excellent substitute for nanofiltration as a pretreatment to reverse osmosis. Thus, the developed membrane may have a great impact on desalination technology. |
1. Introduction
The crisis of low availability of drinking water is considered a major challenge as less than 3% of the surface water on the earth is potable, the rest being briny seawater and hence non-drinkable.1–4 Desalination of brackish water is, therefore, necessary to meet the increasing global requirement for drinking water and industrial processes. In the past, several techniques like distillation, freezing, and solar and geothermal desalination, have been employed for water desalination.5–9 However, they offer poor scalability and limited commercial viability. Recently, a number of membrane based filtration techniques like nanofiltration (NF) and reverse osmosis (RO) have emerged as powerful desalination alternatives for the purification of water.10 RO is the most widely employed desalination technique.11 In RO, pressure that is sufficient to overcome the osmotic pressure is applied in the direction of a chemical potential gradient. It is worth mentioning that RO requires more than 25 atm of transmembrane pressure (TMP) making it an extremely energy intensive process. In contrast, NF is more useful for bacteriological disinfection, the removal of larger size polyvalent ions and monovalent salts with a removal efficiency of ~30–70% and a slightly lower TMP (10–20 atm) requirement.12,13 NF can be used as a pre-treatment to RO, reducing the load of total dissolved solid14 or for desalination application following Donnan exclusion.15 It is quite apparent that due to the small pore size limitation, NF possesses inherent disadvantages such as low throughput, and high TMP requirement, making the filtration system energy intensive and relatively expensive. In this context, though ultrafiltration (UF) membranes can overcome high TMP and low throughput issues, the desalination efficiency becomes compromised. The typical molecular weight cut-off (MWCO) of UF membranes is above 1 kDa, making it extremely challenging to remove monovalent salts. Consequently, common salts, abundantly found in sea water (e.g., NaCl which is the main constituent of brine) are not generally rejected by these membranes. Some previously reported desalination studies using various membrane filtration processes are presented in Table 1.16–27| Reference | Composition | Nature of the membrane | Salt rejection | Permeate flux (l m−2 h−1 MPa−1) | Operating pressure | Optimum pH |
|---|---|---|---|---|---|---|
| 16 | PVA TFC/PSF | NF | MgSO4 (5 mmol l−1) ~ 84% | 2–6 | 1 MPa | NA |
| NaCl (5 mml l−) ~ 23% | ||||||
| 17 | TFC/PSF | NF | Na2SO4 ~ 90–100% | Na2SO4 ~ 1.7–5 | 0.6 MPa | 3 |
| MgCl2 ~ 23–44% | NaCl ~ 13.3–18.3 | |||||
| MgSO4 ~ 50–60% | ||||||
| NaCl ~ 83–77% | ||||||
| 18 | PA–SiO2/PSF | NF | MgSO4 (1000 mg l−1) ~ 91% | 15–25 | 0.6 MPa | NA |
| NaCl (1000 mg l−1) ~ 50% | ||||||
| 19 | TiO2/PES/Al2O3 | NF | NaCl (0.05 wt%) ~ 54% | 16 | 0.3–0.7 MPa | NA |
| 20 | PTFE/γ-Al2O3/TiO2/α-Al2O3 | NF | NaCl, 0.05 mol l−1 ~20–80% | 11 (pure water flux) | 0.2–1 MPa | 4–6 |
| 21 | PSF/PVA/TEA/SDS | NF & RO | NaCl: 45–70% | 10–22 | 0.5–0.7 MPa | 5 |
| 22 | PES/CNT | NF | Na2SO4 (200 mg l−1) ~ 20–85% | 2.5–25 | 0.4 MPa | 7 |
| NaCl (200 mg l−1) ~ 15–80% | ||||||
| 23 | Piperazine-amide (PA)/PES/ammonium salts | NF | NaCl ~ 28–46% | 57–66 | 0.35 MPa | NA |
| 24 | Carboxylated polysulfone (CPS)/poly (1,4-phenylene ether ethersulfone) (PPEES) | NF & RO | NaCl ~ 50–70% | 6–25 | 0.2–1.6 MPa | NA |
| CaCl2 ~ 45–60% | ||||||
| 15 | PSF/PEG/ZnCl2 | NF | NaCl: 40–43% and Na2SO4: 52–54% | 14.5–29 | 0.2–0.7 MPa | 11 |
| 25 | Commercial millipore PSAL | UF | Negligible rejection of monovalent salt | Around 107.6 | 0.276 MPa | 8.5–9 |
| 26 | Sulfonated polysulfone | UF | NaCl salt rejection of around 1000 mM salt solution ~ 25% | 11 | 0.3–0.8 MPa | NA |
| 27 | Preadsorption of poly(sodium 4-styrenesulfonate) (PSS) on PSF | UF | 28–56% for Na2SO4, 11–19% for NaCl and <5% for CaCl2 | 175–510 pure water flux | 0.2 MPa | NA |
| This work | PSF/PEG/ZnCl2/PANI | UF | ~40% | 26–50 | 0.2–0.7 MPa | 7 |
It can be seen that most works on monovalent salt separation deal with the membranes in RO or NF range. Further, although good multivalent salt rejection capabilities are demonstrated using conventional UF membranes, rejection percentages of monovalent salts are not appreciable. This can be ascribed to the smaller size (compared to the pore size of UF membranes) of the involved ions, their lower charge density and the absence of a membrane surface charge. A survey of Table 1 reveals two important findings: (i) a high rejection associated with a low permeate flux or a low rejection at the expense of a higher permeate flux could be achieved; (ii) the optimum pH value for the majority of studies was outside the permissible limit for drinking water (6.5–8.5).28 Therefore, it is quite apparent that achieving a desalination performance like RO, and maintaining high throughput and low TMP requirements like conventional UF, still remain an open challenge for membrane researchers, especially in context of the retention of monovalent salts and the reduction of fouling tendency, at neutral pH (~7) conditions. As salts become ionized in aqueous solution, it is speculated that to achieve a considerable rejection of salt molecules from aqueous solution, a charged membrane is necessary for augmentation of electrostatic interactions with the counter ions. However, the introduction of charge inducing additives (e.g., inorganic compounds) often blocks membrane pores and the additives tend to leach out or corrode, reducing the membrane throughput and causing contamination and performance deterioration. It is anticipated that the use of some pore-forming and charge inducing additives can be one possible route to overcome these problems.
In this regard, doped conjugated polymers29 with a charged backbone, tunable electrical properties and compatibility with host polymeric matrices, are expected to serve as an excellent choice for charge inducing agents. Among various conjugated polymers, polyaniline (PANI)-based compositions have received special attention due to their scalable synthesis via a chemical polymerization route, an interesting redox chemistry, acid/base mediated reversible doping/dedoping, tuneable conductivity, low density, non-corrosiveness, a nominal cost, good thermal/environmental stability, and a facile processing via a solution or melt route, resulting in a wide spectrum of potential applications.29–34 Interestingly, PANI possesses a surface charge in aqueous medium35 aiding in charge based separation.36 Use of PANI has already been demonstrated in the enhancement of porosity. Although the preparation of a composite membrane using a charged conjugate polymer like PANI, polypyrrole etc., has been reported in the literature, none of these membranes were used for desalination purposes.37–41 A summary of such works is presented in Table 2. It can be observed from this table that these membranes were used for the rejection of bovine serum albumin (BSA) indicating they are higher cut-off membranes and hence are not suitable for the rejection of salt. However, to the best of the authors' knowledge, there is no report on the application of a PANI incorporated polymeric membrane for salt removal from water by an ultrafiltration membrane exploiting the charged characteristics of the conjugate polymer.
| Sl. no. | Base polymer | Additive | Application | Desalination performance | Reference |
|---|---|---|---|---|---|
| 1 | Polymer: none. Material: carbon nanotube–polyaniline nanofibre | None | Rejection of bovine serum albumin (BSA) (1.4–18.5%) and SiO2 nanoparticle (>90%) | Not performed | 37 |
| 2 | Polysulfone (PSF) | Polypyrrole | Rejection of BSA (82–94%) | Not performed | 38 |
| 3 | PSF | Carbon nanotube–PANI | Rejection of BSA (40–86%) | Not performed | 39 |
| 4 | PSF | PANI | Rejection of BSA (0.2–47%) and silicon di-oxide (92–99%) | Not performed | 40 |
| 5 | PSF | Polypyrrole nanoparticle | Rejection of BSA (92–96.3%) | Not performed | 41 |
| 6 | PSF–ZnCl2–PEG | PANI | Rejection of salts | NaCl, MgSO4, Na2SO4 | This work |
Herein, a novel route to enhance salt rejection while maintaining high throughput by incorporation of PANI nanoparticles within PSF based UF membranes has been explored. It leads to an increase in pore size as well as magnitude of the negative surface charge. Larger pores increase the permeate flux whereas the introduction of surface charge enhances the salt rejection via charge–charge repulsion and Donnan exclusion. The membranes, with different PANI concentrations, are characterized in terms of surface morphology, viscosity of the casting solution, contact angle, porosity, pore size distribution and surface zeta potential. Effects of operating conditions, like TMP, cross-flow rate (CFR), and solution pH, on the salt rejection performance of the membranes are also investigated for individual salts as well as for artificially synthesized seawater. The aim of this work was to arrive at an UF membrane that behaves like a NF membrane utilizing the charged characteristics of PANI, so that throughput is high. A simpler method (without surface reaction) for fabrication of NF membranes has already been reported by Panda and De.15 In that work, ZnCl2 and PEG-200 were mixed with PSF in order to achieve a NF membrane. With the optimum ratio of PSF, PEG and ZnCl2 concentration, PANI was mixed into that solution, in varying amount to obtain a charged UF membrane, capable of rejecting salt partially like a NF membrane.25–30 Here, ZnCl2 and PEG-200 act as pore restricting and pore constricting agents, respectively. PANI imparts surface charge to this membrane. These membranes match the desalination performance of NF membranes, showing a comparatively high flux and low energy requirement like UF. Filtered stream, obtained from this membrane with a reduced salt load, can act as an excellent pre-treated feed stream for RO, resulting in an enhancement of the rejection capacity of the RO system and an improvement of its service life.
2. Materials and methods
2.1 Materials
PSF (MW: 22![[thin space (1/6-em)]](https://www.rsc.org/images/entities/char_2009.gif) 400) was purchased from Solvay Chemicals, Mumbai, India. The solvent N,N-dimethylformamide (DMF) was supplied by Merck (India) Ltd., Polyethylene glycol (PEG) with average molecular weights of 200 Da, 400 Da, 600 Da, 4 kDa, 20 kDa and 35 kDa were procured from S. R. Ltd., Mumbai, India. Zinc chloride (ZnCl2), sodium chloride (NaCl), sodium sulfate (Na2SO4), and magnesium sulfate (MgSO4) were purchased from Merck (India) Ltd. PANI was prepared in the CSIR-National Physical Laboratory (NPL), New Delhi, India by an indirect doping route,42 using the anionic surfactant dopant,43,44 dodecyl benzene sulfonic acid (DBSA), for redoping of the emeraldine base (EB) synthesized by oxidative polymerization of an aniline monomer via a procedure described elsewhere.34
400) was purchased from Solvay Chemicals, Mumbai, India. The solvent N,N-dimethylformamide (DMF) was supplied by Merck (India) Ltd., Polyethylene glycol (PEG) with average molecular weights of 200 Da, 400 Da, 600 Da, 4 kDa, 20 kDa and 35 kDa were procured from S. R. Ltd., Mumbai, India. Zinc chloride (ZnCl2), sodium chloride (NaCl), sodium sulfate (Na2SO4), and magnesium sulfate (MgSO4) were purchased from Merck (India) Ltd. PANI was prepared in the CSIR-National Physical Laboratory (NPL), New Delhi, India by an indirect doping route,42 using the anionic surfactant dopant,43,44 dodecyl benzene sulfonic acid (DBSA), for redoping of the emeraldine base (EB) synthesized by oxidative polymerization of an aniline monomer via a procedure described elsewhere.34
2.2 Membrane preparation
The membrane preparation method (shown schematically in Fig. 1) involves the preparation of casting solutions containing 18 wt% PSF, 2 wt% PEG-200 and 2 wt% zinc chloride (ZnCl2) and having different PANI concentrations (0.5, 1.0, 2.0 and 3 wt%). Sonication was done by a probe-type sonicator (made by Optic Invymen System, Spain, model CY-500), in order to achieve a uniform dispersion of polyaniline, for thirty minutes. The operating conditions were optimized for a uniform dispersion of PANI.45 It may be noted that nanoparticles retained their shape and size in polymer solution due to the sonication and anti-agglomeration action of PSF.46 Casting solution is then drawn over the non-woven fabric with a uniform thickness of 200 μm and a subsequent phase inversion-process is performed (details provided in ESI† section S.1). The membranes were labeled as PANI0, PANI0.5, PANI1, PANI2 and PANI3, corresponding to the weight percent of PANI in the casting solution of 0%, 0.5%, 1%, 2%, and 3%, respectively.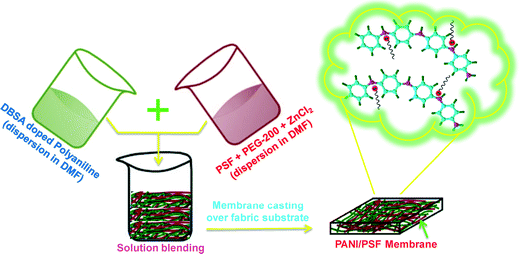 | ||
| Fig. 1 Schematic representation of the preparation of PANI nanoparticles containing a PSF matrix based UF membrane. | ||
2.3 Characterization
A high resolution transmission electron microscope (HR-TEM Techni G2 T30, u-TWIN, operating at 300 kV) was utilized to measure the size of the synthesized PANI-DBSA nanoparticles. Size distribution of PANI in DMF was measured using the dynamic light scattering technique, Zetasizer (model: Zetasizernano ZS 90 Malvern instruments, Worcestershire, U.K). Viscosity and cloud point of the polymer solution were estimated using a rheometer (model: Physica MCR 301, Anton Parr, Austria) and UV-visible spectrophotometer (details in ESI† section S.4). The morphology and surface roughness of the membranes were observed using a scanning electron microscope (SEM, model: ESM – 5800, JEOL, Japan) and an atomic force microscope (AFM) (model: 5500 AFM, Agilent Technologies, USA) in tapping mode. Porosity, permeability and the molecular weight cut-off (MWCO) of the membranes were determined47,48 as described in ESI† (sections S.5, S.6 and S.7). Contact angle, pore size distribution and tensile properties of each membrane were measured using a Goniometer (model number: 200-F4, Rame-Hart instrument Co., New Jersey, USA), a Brunauer–Emmett–Teller (BET) instrument (model AUTOSORB-1, Quantachrome instruments, Florida, USA) and a Universal Testing Machine (UTM) (model no. H50KS, Tinius Olsen Ltd., Redhill, England), respectively. Membrane zeta potential was determined by measuring the streaming potential using a cross flow UF cell under a trans membrane pressure (TMP) of 0 to 2 bar, solution pH of 4 to 10, NaCl concentration of 1.0 mM and a cross flow velocity of 0.12 m s−1. The detailed procedure and the instrumentation are described elsewhere.49,50 Fourier transform infrared (FTIR) spectrometer (model: Spectrum 100 Perkin Elmer) was used to record vibration spectra in order to investigate the chemical changes that occurred during filtration.The cross flow filtration experiments were performed using separate solutions of NaCl, Na2SO4 and MgSO4 salts at a concentration of 1000 mg l−1. The operating TMP was varied in the range of 276 to 690 kPa and the CFR was fixed in the range 20 to 80 l h−1. Conductivity of each salt solution was measured using a conductivity meter (model: PCSTestr 35, Eutech 220 Instruments, Germany). To measure the concentration of each ion, before and after the experimental run with artificial sea-water, ion chromatography (model: 883 Basic IC plus1, supplied by Metrohm India Ltd.) was used.
3 Results and discussion
The TEM image (Fig. 2a) shows that the actual size of PANI particles varies in the range of 10–20 nm, which is in good agreement with the size distribution in the casting solution (12 to 68 nm, with an average value of 18 nm) measured using dynamic light scattering (Fig. 2b). Such small particles possess a high surface area as well as a good charge density, hence they are expected to play a crucial role in the improvement of salt rejection via the Donnan exclusion principle.51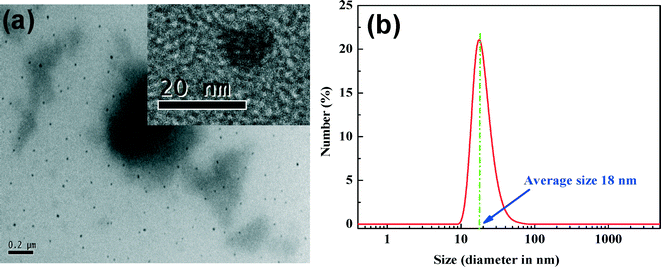 | ||
| Fig. 2 (a) TEM image of PANI particles and the corresponding HRTEM image (inset); (b) size distribution of PANI particles using laser light scattering. | ||
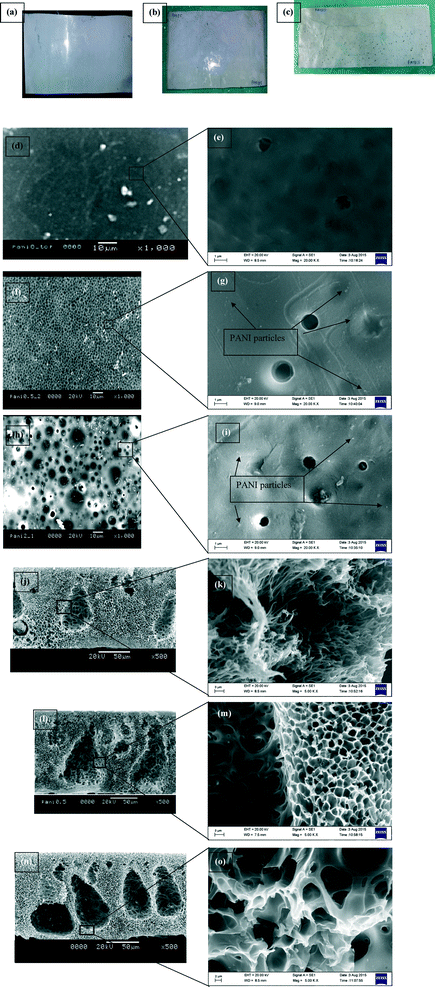
The optical images of the membranes (Fig. 3a–c) show a decrease in the smoothness of the membrane surface with PANI loading. To probe further, SEM images (Fig. 3d–o and S2, section S.8, ESI†) were also recorded. The SEM images indicate a dense morphology (smaller and fewer pores) for membranes without PANI (Fig. 3d and e). However, it was also noticed that incorporation of PANI and increasing its concentration lead to a progressive expansion of pore size and an increase in their number density (Fig. 3f–i) on the top surface, confirming that PANI nanoparticles act as a porogen. At higher magnification (20![[thin space (1/6-em)]](https://www.rsc.org/images/entities/char_2009.gif) 000×) images, (Fig. 3g and i) open pores are visible. Comparing Fig. 3(f) and (h), enhancement of pore density over the membrane surface can be visualized. In Fig. 3(g) and (i), some PANI are visible as bright dots, which are extremely small in size. In addition to bigger pores, some smaller pores also get enhanced in number and size. Analysis of cross-sectional images (Fig. 3j–o) reveals a spongy nature of the membrane structure, which becomes enhanced with increased PANI concentration. PANI0 membrane (Fig. 3j and k) is comparatively denser than PANI-incorporated membranes. Even at the higher magnification of 5000× in cross section images, (Fig. 3m and o), no bright dots can be visualized. This observation confirms that the PANI nanoparticles survived the mixing and sonication and do not get agglomerated. However, the cross section view at higher magnification, 20
000×) images, (Fig. 3g and i) open pores are visible. Comparing Fig. 3(f) and (h), enhancement of pore density over the membrane surface can be visualized. In Fig. 3(g) and (i), some PANI are visible as bright dots, which are extremely small in size. In addition to bigger pores, some smaller pores also get enhanced in number and size. Analysis of cross-sectional images (Fig. 3j–o) reveals a spongy nature of the membrane structure, which becomes enhanced with increased PANI concentration. PANI0 membrane (Fig. 3j and k) is comparatively denser than PANI-incorporated membranes. Even at the higher magnification of 5000× in cross section images, (Fig. 3m and o), no bright dots can be visualized. This observation confirms that the PANI nanoparticles survived the mixing and sonication and do not get agglomerated. However, the cross section view at higher magnification, 20![[thin space (1/6-em)]](https://www.rsc.org/images/entities/char_2009.gif) 000×, results in blurred images without much significance. The addition of pores can be ascribed to the interaction of PANI with ZnCl2 leading to a reduction in the cross-link density and less dense packing of PSF chains, resulting in an increase of porosity and pore size.52 It is important to point out that the insolubility of DBSA doped PANI in water30,45 and its ability of forming strong bond with PSF/ZnCl2
000×, results in blurred images without much significance. The addition of pores can be ascribed to the interaction of PANI with ZnCl2 leading to a reduction in the cross-link density and less dense packing of PSF chains, resulting in an increase of porosity and pore size.52 It is important to point out that the insolubility of DBSA doped PANI in water30,45 and its ability of forming strong bond with PSF/ZnCl2![[thin space (1/6-em)]](https://www.rsc.org/images/entities/char_2009.gif) 53 prevent its leaching from the membrane surface ensuring no recontamination of filtered water.
53 prevent its leaching from the membrane surface ensuring no recontamination of filtered water.
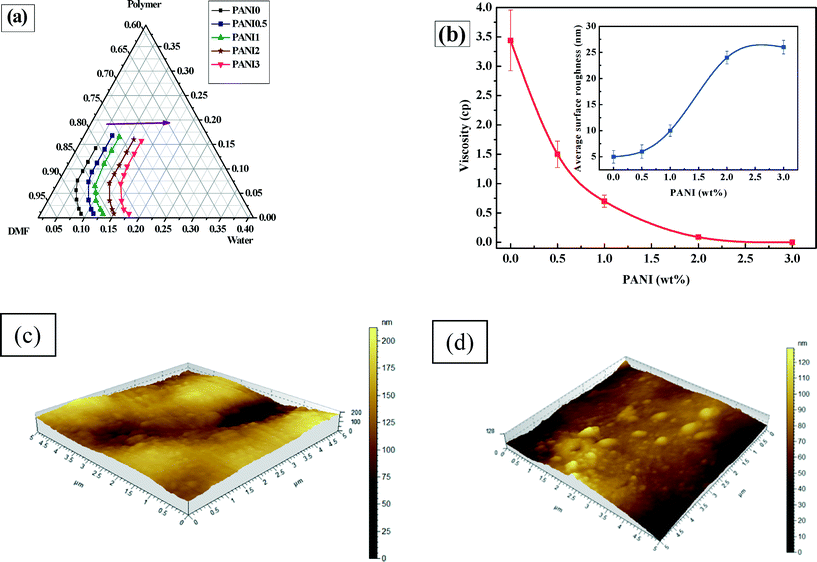
The ternary phase diagram (Fig. 4a) reveals that an increase in concentration of PANI shifts the bimodal curve to the right (i.e., away from the polymer/DMF axis). This observation reflects a higher thermodynamic stability.54 A decrease in the solvent-water demixing gap, leads to a denser morphology.55 This interpretation is in line with the cross sectional SEM image analysis, that some of the bigger pores are constricted in width and the smaller pores are enhanced in their number and size. In addition to thermodynamic consideration, kinetic hindrance, which is dictated by the viscosity of the casting solution, also plays an important role in phase inversion. It is expected that –NH- and ![[double bond, length as m-dash]](https://www.rsc.org/images/entities/char_e001.gif) N-groups of PANI strongly interact with phases, thereby hindering the bonding between ZnCl2 and PSF.53 Strong covalent bonding between ZnCl2 and PSF through the sulfonic group, present in the PSF backbone, restricts the ZnCl2 from leaching out of the membrane matrix, during phase inversion.53 PANI disrupts the strong covalent bonding between PSF and ZnCl2, allowing the polymer chains to grow further apart leading to a reduced viscosity (as evident from Fig. 4b) and hence an enhancement of solvent/non-solvent diffusion.44 This kinetic instability is significant enough to overcome the thermodynamic stability of the membrane, leading to a porous morphology (larger number and size of pores) with increasing PANI concentration. Being hydrophilic in nature, PANI attracts more water inside the membrane matrix, initiating the formation of pores that grow in number and size with increasing PANI concentration. The average skin thickness of the membranes decreases from 31.7 to 25.5 μm with increasing PANI concentration of 0 to 3 wt% and this effect in combination with enhanced porosity makes the membrane more permeable with increasing PANI concentration. The increase in the roughness of the membrane with PANI is verified and quantified via AFM images (Fig. 4c and d and S3 ESI† section S.9), showing an increase in the surface roughness (inset Fig. 4b) from 5 to 26 nm.
N-groups of PANI strongly interact with phases, thereby hindering the bonding between ZnCl2 and PSF.53 Strong covalent bonding between ZnCl2 and PSF through the sulfonic group, present in the PSF backbone, restricts the ZnCl2 from leaching out of the membrane matrix, during phase inversion.53 PANI disrupts the strong covalent bonding between PSF and ZnCl2, allowing the polymer chains to grow further apart leading to a reduced viscosity (as evident from Fig. 4b) and hence an enhancement of solvent/non-solvent diffusion.44 This kinetic instability is significant enough to overcome the thermodynamic stability of the membrane, leading to a porous morphology (larger number and size of pores) with increasing PANI concentration. Being hydrophilic in nature, PANI attracts more water inside the membrane matrix, initiating the formation of pores that grow in number and size with increasing PANI concentration. The average skin thickness of the membranes decreases from 31.7 to 25.5 μm with increasing PANI concentration of 0 to 3 wt% and this effect in combination with enhanced porosity makes the membrane more permeable with increasing PANI concentration. The increase in the roughness of the membrane with PANI is verified and quantified via AFM images (Fig. 4c and d and S3 ESI† section S.9), showing an increase in the surface roughness (inset Fig. 4b) from 5 to 26 nm.
Fig. 5 shows that the membrane porosity increases from 20% to 64% with increasing PANI concentration (see ESI† Fig. S4), which corroborates SEM observations and phase diagram considerations. For PANI0, porosity is only 20% and this increases up to 49% for PANI0.5 (Fig. S4†). Porosity increases with further addition of PANI and becomes 64% for PANI3.
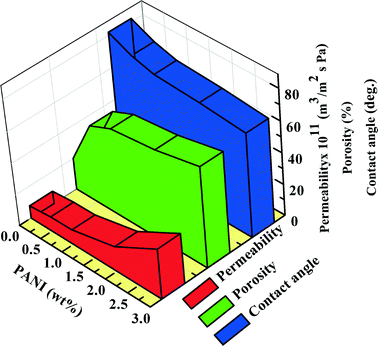 | ||
| Fig. 5 Variation of porosity, contact angle and permeability with differing concentrations of polyaniline. | ||
Furthermore, the static water contact angle decreases steadily (from 82° to 66°) with increasing concentration of PANI, indicating enhanced hydrophilicity (details provided in ESI† section S.10). Besides, the permeability also increases with increasing PANI concentration, i.e., from 8 × 10⁻¹² m3 m−2 Pa−1 s−1 for PANI0 to 2.9 × 10⁻¹¹ m3 m−2 Pa−1 s−1 for PANI3, which is considered a direct consequence of increased porosity and hydrophilicity.
BET analysis was performed to get the finer details of all sizes of pores. The pore size distribution patterns (Fig. 6a) show that the peak of the curves shifts towards the right with increasing PANI concentration, indicating the progressive formation of bigger pores. In PANI0, the pore volume peak is almost in the same position as PANI0.5. However, PANI0.5 has a much larger peak height, indicating a higher number of pores. This phenomenon is confirmed by the increase in the average pore diameter from 8 Å to 113 Å, (see Fig. 6b) with increasing PANI concentration from 0 wt% to 3 wt% (Fig. 6b) and that the MWCO values also increase (from 200 Da to 5.5 kDa) with increasing PANI concentration, confirming the trend of porosity. Therefore, from the MWCO values, it is evident that incorporation of PANI brings the NF membrane to the UF range. As the non-homogeneity due to the pores acts as s stress concentration site, a decrease in mechanical strength (shown in ESI† section S.11) occurs by incorporation of a porogen PANI phase. Indeed, the stress–strain curves (ESI† Fig. S5, section S.11) reveal that breaking both the strength and elongation of the membranes decrease with increasing PANI concentration. However, even after reduction, the mechanical strength of the membranes remains sufficiently high to withstand operational TMP values.
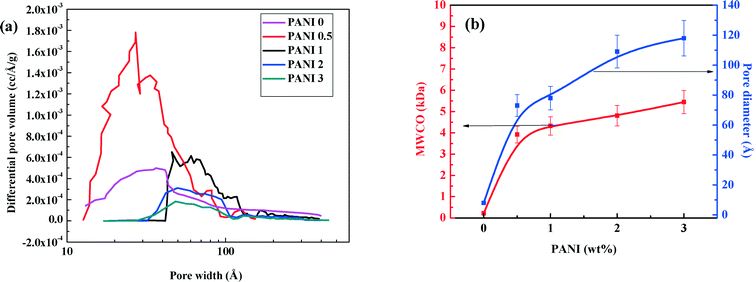 | ||
| Fig. 6 Variation of (a) pore volume distribution, (b) average pore diameter and MWCO with concentration of polyaniline. | ||
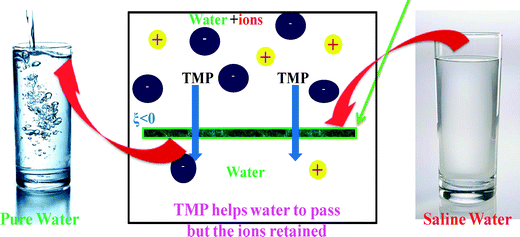
The variation of zeta potential (ξ) of PANI dispersion (Fig. 7a) as a function of pH shows that the |ξ| value increases till pH 8 (|ξ| ~ 67 mV) and decreases thereafter, remaining negative at all pH values. This trend can be linked with the existence of a different redox state of PANI at a different solution pH (see ESI† section S.12 for details). Below pH 8, a degree of protonation increases due to the attachment of protons to the imine groups (ESI† Fig. S6 and S7) and the generation of radical cations, leading to a reduction in the negative zeta potential. Above pH 8, the amine groups of PANI are deprotonated,43,56 reducing the level of oxidation with an associated decrease in negative sites, thereby lowering the magnitude of the negative zeta potential. It is interesting to note that the zeta potential of PANI is at its maximum at pH 8, which lies well within the pH range of drinking water (6.5 to 8.5). As expected, the incorporation of PANI nanoparticles within a PSF matrix leads to a negative charge over the PANI/PSF membrane surface. Consequently, the zeta potential (at neutral pH 7) of PANI-based membranes increases (Fig. 7b) from −4 mV (for PANI0) to −51 mV (for PANI3). It is worth mentioning here that the surface charge of the modified membrane is expected to play a crucial role in the rejection of ions via Donnan exclusion (i.e. charge–charge repulsion)29,57 (Fig. 8). Negative ions present in the solution get repelled by the negatively charged membrane. To maintain charge neutrality, some positive ions remain in the feed side. As a cumulative effect of these two phenomena, the overall retention of salts becomes enhanced. This charge screening effect enables membranes to counter the effect of increased pore size for which water permeability increases.
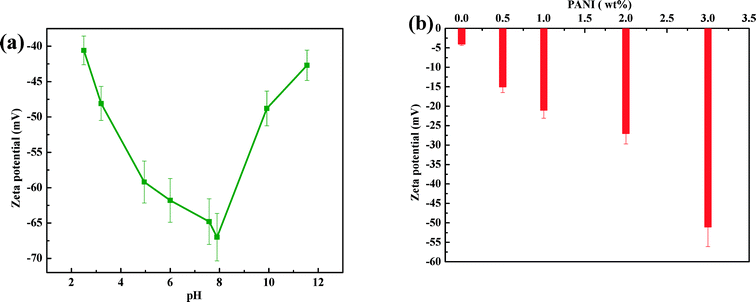 | ||
| Fig. 7 Zeta potential of (a) polyaniline with varying solution pH, and (b) of the membrane with different concentrations of polyaniline, at pH 7. | ||
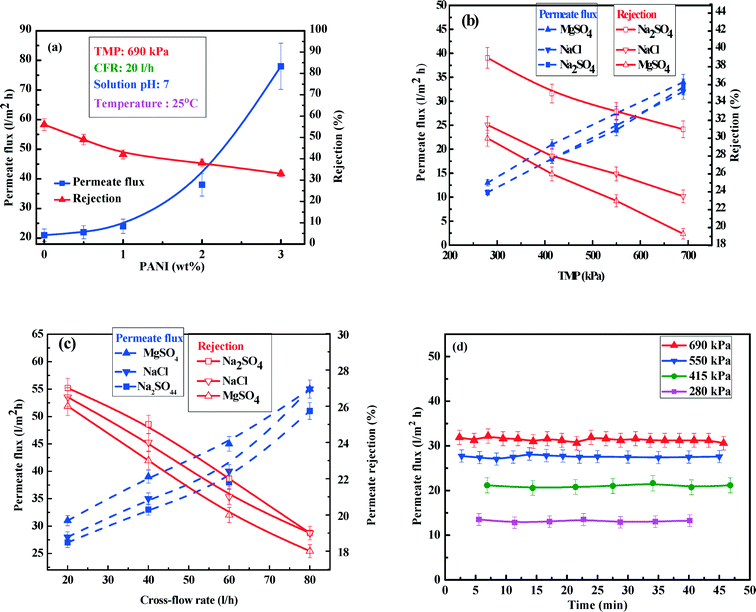
Fig. 9(a) displays the steady state permeate flux and salt rejection characteristics of various membranes for 1000 mg l−1 concentration of Na2SO4 at 690 kPa TMP, 20 l h−1 CFR and neutral pH. It can be observed that permeate flux shows around a 4-fold increase (i.e. from 21 l m−2 h−1 to 78 l m−2 h−1) with PANI concentration increasing from 0 wt% to 3 wt%. This is in good agreement with the observed trends of porosity, hydrophilicity and permeability of the membranes. However, an enhanced permeate flux promotes convection of salt26 leading to a decrease in salt rejection from 52% to 34%. However, the rejection profile of salt is not as sharp as in the case of permeate flux. As pointed out earlier, this can be attributed to two opposing effects, namely enhancement of permeability and zeta potential. Higher surface charge (manifested in a more negative zeta potential) leads to more salt rejection due to charge–charge repulsion and an enhanced permeability results in an augmented convective transport, thereby decreasing the rejection. In the presence of these two competitive mechanisms, salt rejection decreases very slowly with increasing PANI concentration. As the membrane with 2 wt% PANI has a reasonably high permeate flux (~45 l m−2 h−1) and NaCl rejection (~38%), the PANI2 membrane is selected to observe the effects of the operating conditions.
Fig. 9(b) shows that for NaCl, an increase in TMP from 276 to 690 kPa leads to an increase in permeate flux from 13 to 34 l m−2 h−1 (~2.5 times) with a decrease in salt rejection from 38% to 31%, in the case of Na2SO4. This can be attributed to enhanced convection effects49 that dominate over charge repulsion. A similar type of trend can be observed during the salt rejection of NaCl and MgSO4 with rejection values in the order of Na2SO4 > NaCl > MgSO4. This can be explained and understood on the basis of charge–charge repulsion (Fig. S8 ESI†) between negatively charged membranes and ions.15 In the case of the divalent salt Na2SO4, two positively charged Na+ ions (surface charge density +0.946 C m−2) and a negatively charged SO42− group (surface charge density −1.147 C m−2) experience a stronger charge–charge repulsion with the membrane surface. Charge density was calculated by dividing the surface charge (coulomb) of each ion by its surface area.58 Compared to Na2SO4, during filtration of NaCl, negatively charged Cl− ions having a surface charge density of −0.457 C m−2 experience a weaker repulsive force. As a result, membranes show a higher Na2SO4 rejection than for NaCl. In contrast, for MgSO4, Mg2+ ions have a much higher positive surface charge density (3.443 C m−2), leading to the dominance of the attractive forces of Mg+2 (with negatively charged membrane surface) over the repulsion of SO42− ions, ultimately resulting in the lowest rejection values for MgSO4.
Fig. 9(c) shows that permeate flux increases from 28 to 54 l m−2 h−1 as CFR increases from 20 to 80 l h−1 for 1000 mg l−1 NaCl solution. Furthermore, the salt rejection decreases from 28% to 19% over this range of CFR. This phenomenon occurs due to a decrease in the thickness of the mass transfer boundary layer of the solutes over the membrane surface, thereby exposing the solutes to augmented convective transport through the membrane. Based on the above discussions, 690 kPa TMP and 20 l h−1 CFR were selected as operating conditions for this membrane. Finally, it can be observed that developed PANI based UF membrane displays rejection of NaCl like a NF membrane (~34%) with a very high specific flux (permeate flux per unit TMP) (26–50 l m−2 h−1 MPa−1), which is almost twice compared to most of NF membranes.
In conventional membrane filtration systems, small solute particles get trapped inside pores or block the pore-mouth. This leads to fouling of the membrane over time that is reflected by a decrease in flux with time and deterioration of salt rejection. However, PANI/PSF based UF membranes display good fouling resistance, due to the large physical dimensions of the pores and the repulsive salt separation mechanism (via, Donnan's exclusion principle) rather than the physical sieving of ions. Indeed, the flux profiles of the PANI/PSF UF membrane (Fig. 9d) at different operating TMPs (for filtration of NaCl salt solution) reveal that permeate flux remains invariant over time, indicating almost no fouling of the membrane. This observation suggests that no extensive regeneration process (which is considered time/energy consuming and costly to unit operations) is required, being beneficial to real life application. Absence of fouling is also explicitly confirmed using FTIR spectra of pure PSF and PANI/PSF membranes (ESI,† section S.13 Fig. S8) obtained before and after filtration, revealing no adsorption of salts on the membrane surface or inside the pore wall.
In order to study membrane performance in a real life scenario, artificial sea water was prepared with a specific composition mentioned elsewhere.59 This particular solution was filtered through PANI2, with CFR 20 l h−1 and TMP 690 kPa. The membrane shows almost similar flux and rejection profiles as that of a synthetic solution with a single salt. Permeate flux measures around 30 l m−2 h−1. Further, the feed characteristics and rejection capacity are presented in Table 3. The desalination could be achieved to the extent of 30 to 35%, under the specified operating conditions, while maintaining high permeate flux (30 l m−2 h−1).
| S. No. | Parameter | Feed characteristics | Percentage reduction (%) |
|---|---|---|---|
| 1 | Conductivity | 42 S cm−1 | 30 ± 2 |
| 2 | Salinity | 25![[thin space (1/6-em)]](https://www.rsc.org/images/entities/char_2009.gif) 000 mg l−1 000 mg l−1 |
29 ± 3 |
| 3 | Total dissolved solid | 25![[thin space (1/6-em)]](https://www.rsc.org/images/entities/char_2009.gif) 000 mg l−1 000 mg l−1 |
33 ± 4 |
| 4 | Na+ | 10![[thin space (1/6-em)]](https://www.rsc.org/images/entities/char_2009.gif) 110 mg l−1 110 mg l−1 |
35 ± 2 |
| 5 | K+ | 386 mg l−1 | 33 ± 1 |
| 6 | Cl− | 15![[thin space (1/6-em)]](https://www.rsc.org/images/entities/char_2009.gif) 135 mg l−1 135 mg l−1 |
33 ± 4 |
| 7 | SO42− | 2710 mg l−1 | 24 ± 2 |
| 8 | F− | 1.35 mg l−1 | 38 ± 5 |
To analyze fouling characteristics of the membrane for the filtration of high molecular weight solutions, a BSA solution with a concentration of 500 mg l−1 was filtered through the membrane at 690 kPa TMP and 20 l h−1 CFR. Variations of permeate flux and rejection over time are presented in Fig. 10(a) and (b). It can be observed from Fig. 10(a) that the permeate flux declines with time. BSA protein molecules are much larger in size; hence they face greater resistance to flow, compared to salt molecules. Partial or complete pore blocking leads to fouling of the membrane, which leads to flux decline. The membrane offers a good rejection of BSA protein (74–90%). It can be observed from Fig. 10(b), that rejection increases with time. Rejected BSA molecules form a layer over the membrane surface which assists in further rejection of BSA, making a self rejecting layer over the membrane. The flux decline ratio in this case is 41% (32 to 19 l m−2 h−1) indicating 41% of initial flux gets reduced due to fouling.
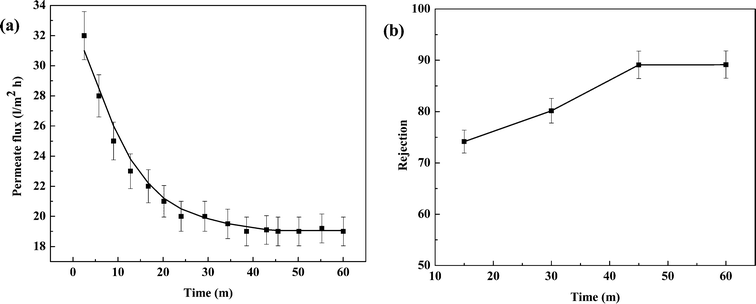 | ||
| Fig. 10 Variation of (a) permeate flux and (b) rejection with time for filtration of BSA protein at 690 kPa TMP and 20 l h−1 CFR. | ||
After the experiment, the membrane was cleaned with tap water and the permeate flux was measured using distilled water as 29.5 l m−2 h−1 at 690 kPa. Therefore, cleaning helps to recover 92% of the initial flux. Only 8% flux is lost due to adsorption of protein molecules by the membrane matrix.
4 Conclusions
The present study elaborates on the preparation, characterization and salt removal capacity of a novel nanostructured PANI incorporated PSF based UF membrane. Kinetic hindrance plays a dominant role compared to thermodynamic stability during phase inversion, resulting in a more porous membrane. Incorporation of PANI in PSF based casting solution imparts porosity and enough negative surface charge to the membrane to display 38% rejection of Na2SO4 while maintaining a high specific permeate flux of 26–50 l m−2 h−1 MPa−1. The same can also be explicitly confirmed from the observations that an increase in surface zeta potential (from −3.8 to −51 mV) and permeability (about >3.5 times i.e. from 8.0 × 10⁻¹² to 2.9 × 10⁻¹¹ m Pa−1 s−1) of the membrane with incorporation of more PANI maintain the rejection of sodium chloride. The rejection mechanism of salt can be identified as strong electrostatic repulsion between the charged surface of the membrane and negative ions. PANI2 membrane can be selected as the desired one having reasonably high rejection of sodium sulfate (about 38%) coupled with a permeate flux of 38 l m−2 h−1 at 690 kPa. The increase in TMP from 276 to 690 kPa results in an enhancement of permeate flux from 13 to 34 l m−2 h−1 with a decrease in rejection of sodium chloride from 38% to 31%. Increase in CFR from 20 to 80 l h−1 at 690 kPa leads to a decrease in rejection from 28% to 19% with flux enhancement from 28 to 54 l m−2 h−1. Desalination performance is also demonstrated using artificially synthesized seawater and it is realized that they may be used for load reduction of RO membranes. These membranes having a flux similar to UF membranes and a salt rejection similar to NF membranes, with distinguished features like absence of fouling, no regeneration requirement, and lower cost (due to low TMP, energy requirements and no regeneration), are actually considered beneficial for real life application with viable operation and direct techno-commercial applicability.Acknowledgements
This work is supported by a grant from the SRIC, IIT Kharagpur under the scheme no. IIT/SRIC/CHE/SMU/2014-15/40, dated 17-04-2014 and funding from INAE Chair Professorship of Prof. Sirshendu De. Any opinions, findings and conclusions expressed in this paper are those of the authors. Authors are also thankful to Director CSIR-NPL, for providing the research facilitates for synthesis and characterization of conducting polymers and their nano-composites.References
- I. C. Karagiannis and P. G. Soldatos, Desalination, 2008, 223, 448–456 CrossRef CAS PubMed.
- in Water in Crisis: A Guide to the World's Freshwater Resources, ed. P. H. Gleick, Oxford University Press, New York, 1st edn, 1993, ch. 2, p. 13 Search PubMed.
- S. N. Kulshreshtha, Water Resour. Manag., 1998, 12, 167–184, DOI:10.1023/A:1007957229865.
- in Handbook of methods for the analysis of the various parameters of the carbon dioxide system in sea water, ed. A. G. Dickson and C. Goyet, DOE, 2nd edn, 1994, ORNL/CDIAC-74 Search PubMed.
- D. M. Warsinger, J. Swaminathan, E. Guillen-Burrieza, H. A. Arafat and J. H. Lienhard, Desalination, 2015, 365, 294–313 CrossRef PubMed.
- Y. Tanaka, Desalination, 2014, 342, 126–138 CrossRef CAS PubMed.
- P. Gao, Z. Guo, D. Zhang, X. Zhou and G. Zhou, Desalination, 2014, 347, 215–223 CrossRef CAS PubMed.
- F. Nematollahi, A. Rahimi and T. T. Gheinani, Desalination, 2013, 317, 23–31 CrossRef CAS.
- F. Manenti, M. Masi, G. Santucci and G. Manenti, Desalination, 2013, 317, 193–205 CrossRef CAS PubMed.
- J. G. Jacangelo, R. R. Trussell and M. Watson, Desalination, 1997, 113, 119–127 CrossRef CAS.
- L. Zhao, P. C.-Y. Chang and W. S. W. Ho, Desalination, 2013, 308, 225–232 CrossRef CAS PubMed.
- L. Y. Ng, A. W. Mohammad, C. Y. Ng, C. P. Leo and R. Rohani, Desalination, 2014, 351, 19–26 CrossRef CAS PubMed.
- N. Hilal, H. Al-Zoubi, N. A. Darwish, A. W. Mohammad and M. A. Arabi, Desalination, 2004, 170, 281–308 CrossRef CAS.
- C. Fritzmann, J. Löwenberg, T. Wintgens and T. Melin, Desalination, 2007, 216, 1–76 CrossRef CAS PubMed.
- S. R. Panda and S. De, Desalination, 2014, 347, 52–65 CrossRef CAS PubMed.
- J. M. Gohil and P. Ray, J. Colloid Interface Sci., 2009, 338, 121–127 CrossRef CAS PubMed.
- B. Tang, Z. Huo and P. Wu, J. Membr. Sci., 2008, 320, 198–205 CrossRef CAS PubMed.
- L. M. Jin, S. L. Yu, W. X. Shi, X. S. Yi, N. Sun, Y. L. Ge and C. Ma, Desalination, Polymer, 2012, 53, 5295–5303 CrossRef CAS PubMed.
- B. Rajaeian, A. Rahimpour, M. O. Tade and S. Liu, Desalination, 2013, 313, 176–188 CrossRef CAS PubMed.
- H. Qi, S. Niu, X. Jiang and N. Xu, Ceram. Int., 2013, 39, 2463–2471 CrossRef CAS PubMed.
- V. T. Do, C. Y. Tang, M. Reinhard and J. O. Lecki, Water Res., 2012, 46, 5217–5223 CrossRef CAS PubMed.
- V. Vatanpour, S. S. Madaeni, R. Moradian, S. Zinadini and B. Astinchap, J. Membr. Sci., 2011, 375, 284–294 CrossRef CAS PubMed.
- J. Xiang, Z. Xie, M. Hoang, D. Ng and K. Zhang, J. Membr. Sci., 2014, 465, 34–40 CrossRef CAS PubMed.
- C. Hegde, A. M. Isloor, M. Padaki, A. F. Ismail and W. J. Lau, Membr. Water Treat., 2012, 3, 25–34 CrossRef.
- D. Bhattacharyya, J. M. McCarthy and R. B. Grieves, AIChE J., 1974, 20, 1206–1212 CrossRef CAS PubMed.
- I. Jitsuhara and S. Kimura, J. Chem. Eng. Jpn., 1983, 16, 394–399 CrossRef CAS.
- A. V. R. Reddy, D. J. Mohan, A. Bhattacharya, V. J. Shah and P. K. Ghosh, J. Membr. Sci., 2003, 214, 211–221 CrossRef CAS.
- Health criteria and other supporting information, Guidelines for drinking-water quality, World Health Organization, Geneva, 20th edn, 1996, vol. 2, www.who.int/water_sanitation_health/dwq/2edvol2p1.pdf, (accessed on 28th August) Search PubMed.
- Fundamentals of Conjugated Polymer Blends, Copolymers and Composites: Synthesis, Properties, and Applications, ed. P. Saini, Scrivener Publishing, Beverly, 1st edn, 2015, LLC, ISBN: 978-1-118-54949-0, pp. 1–800 Search PubMed.
- D. C. Trivedi, in Handbook of Organic Conductive Molecules and Polymers, John Wiley & Sons Ltd., Chichester, UK, 1997, vol. 2 Search PubMed.
- S. Bhadra, D. Khastgir, N. K. Singhaa and J. H. Lee, Prog. Polym. Sci., 2009, 34, 783–810 CrossRef CAS PubMed.
- A. A. Syed and M. K. Dinesan, Talanta, 1991, 38, 815–837 CrossRef CAS.
- Y. Cao, P. Smith and A. J. Heeger, Synth. Met., 1992, 48, 91–97 CrossRef CAS.
- P. Saini, V. Choudhary, B. P. Singh, R. B. Mathur and S. K. Dhawan, Mater. Chem. Phys., 2009, 113, 919 CrossRef CAS PubMed.
- M. Trchová, I. Šeděnková, E. N. Konyushenko, J. Stejskal, P. Holler and G. Ćirić-Marjanović, J. Phys. Chem. B, 2006, 110, 9461–9468 CrossRef PubMed.
- R. B. Kaner, Synth. Met., 2002, 125, 65–71 CrossRef CAS.
- Y. Liao, D.-G. Yu, X. Wang, W. Chain, X.-G. Li, E. M. V. Hoek and R. B. Kaner, Nanoscale, 2013, 5, 3856–3862 RSC.
- Y. Liao, T. P. Farrell, G. R. Guillen, M. Li, J. A. T. Temple, X. G. Li, E. M. V. Hoek and R. B. Kaner, Mater. Horiz., 2014, 1, 58–64 RSC.
- Y. Liao, X.-G. Li, E. M. V. Hoek and R. B. Kaner, J. Mater. Chem. A, 2013, 1, 15390–15396 CAS.
- G. R. Guillen, T. P. Farrell, R. B. Kaner and E. M. V. Hoek, J. Mater. Chem. A, 2010, 20, 4621–4628 RSC.
- Y. Liao, X. Wang, W. Qian, Y. Li, X. Li and D. G. Yu, J. Colloid Interface Sci., 2012, 386, 148–157 CrossRef CAS PubMed.
- P. Saini, R. Jalan and S. K. Dhawan, J. Appl. Polym. Sci., 2008, 108, 1437–1446, DOI:10.1002/app.27827.
- P. Saini, M. Arora, G. Gupta, B. K. Gupta, V. N. Singh and V. Choudhary, Nanoscale, 2013, 5, 4330–4346, 10.1039/C3NR00634D.
- P. Saini and M. Arora, J. Mater. Chem. A, 2013, 1, 8926–8934, 10.1039/C3TA11086A.
- V. Rashmi, P. A. M. Isloor, U. K. Bhat and A. F. Ismail, Desalination, 2014, 351, 220–227 CrossRef PubMed.
- M. Kowalski, S. Haubrich and A. James, 2006, US Pat., 20060159838 A1 Search PubMed.
- B. K. Thakur and S. De, Sep. Purif. Technol., 2012, 93, 67–74 CrossRef CAS PubMed.
- Z. Huang, P.-C. Wang, J. Feng and A. G. MacDiarmid, Synth. Met., 1997, 85, 1375–1376 CrossRef CAS.
- S. De, B. Sarkar and S. DasGupta, in Electric Field Enhanced Membrane Separation System: Principles and Typical Applications, Nova Science Pub Inc., New York, 1st edn, 2009 Search PubMed.
- B. Sarkar, S. DasGupta and S. De, J. Membr. Sci., 2008, 307, 268–276 CrossRef CAS PubMed.
- F. G. Donnan, Z. Elektrochem. Angew. Phys. Chem., 1911, 17(10), 572–581 CAS.
- C. Deslouis, T. E. Moustafid, M. M. Musiani, M. E. Orazem, V. Provost and B. Tribollet, Electrochim. Acta, 1999, 44, 2087–2093 CrossRef CAS.
- N. P. S. Chauhan, R. Ameta, R. Ameta and S. C. Ameta, J. Indian Counc. Chem., 2010, 27, 128–133 CAS.
- M. Sadrzadeh and S. Bhattacharjee, J. Membr. Sci., 2013, 441, 32–44 CrossRef PubMed.
- A. F. Ismail and L. P. Yean, J. Appl. Polym. Sci., 2003, 88, 442–451 CrossRef CAS PubMed.
- C. Su, W. Kosar, Y. Zhang and X. Feng, Desalination, 2013, 309, 156–164 CrossRef PubMed.
- F. G. Donnan, Z. Elektrochem. Angew. Phys. Chem., 1911, 17, 572–581 CAS.
- Specific ion effects, ed. Werner Kunz, World scientific Publishing Co. Pte Ltd, Singapore, 2009 Search PubMed.
- D. R. Kester, I. W. Duedall, D. N. Connors and R. M. Pytkowicz, Limnology and Oceanography, 1967, 12, 176–179 CrossRef CAS.
Footnote |
| † Electronic supplementary information (ESI) available. See DOI: 10.1039/c5ew00163c |
| This journal is © The Royal Society of Chemistry 2015 |

