
Differences in microbial communities and performance between suspended and attached growth anaerobic membrane bioreactors treating synthetic municipal wastewater†
Moustapha
Harb‡
a,
Yanghui
Xiong‡
a,
Jeremy
Guest
b,
Gary
Amy
a and
Pei-Ying
Hong
*a
aWater Desalination and Reuse Center, Environmental Science and Engineering, King Abdullah University of Science and Technology (KAUST), 4700 King Abdullah Boulevard, Thuwal 23955-6900, Saudi Arabia. E-mail: peiying.hong@kaust.edu.sa; Tel: +966 12 8082218
bDepartment of Civil and Environmental Engineering, University of Illinois at Urbana-Champaign, Urbana, Illinois 61801, USA
First published on 14th August 2015
Abstract
Two lab-scale anaerobic membrane bioreactors (AnMBRs), one up-flow attached-growth (UA) and another continuously stirred (CSTR), were operated under mesophilic conditions (35 °C) while treating synthetic municipal wastewater (800 mg L−1 COD). Each reactor was attached to both polyvinylidene fluoride (PVDF) and polyethersulfone (PES) microfiltration (MF) membranes in an external cross-flow configuration. Both reactors were started up and run under the same operating conditions for multiple steady-state experiments. Chemical oxygen demand (COD) removal rates were similar for both reactors (90–96%), but captured methane was found to be 11–18% higher for the CSTR than the UA reactor. Ion Torrent sequencing targeting 16S rRNA genes showed that several operational taxonomic units (OTUs) most closely related to fermentative bacteria (e.g., Microbacter margulisiae) were dominant in the suspended biomass of the CSTR, accounting for 30% of the microbial community. Conversely, methanogenic archaea (e.g., Methanosaeta) and syntrophic bacteria (e.g., Smithella propionica) were found in significantly higher relative abundances in the UA AnMBR as compared to the CSTR due to their affinity for surface attachment. Of the methanogens that were present in the CSTR sludge, hydrogenotrophic methanogens dominated (e.g., Methanobacterium). Measured EPS (both proteins and carbohydrates), which has been broadly linked to fouling, was determined to be consistently lower in the UA AnMBR membrane samples than in CSTR AnMBR membrane samples. Principal component analysis (PCA) based on HPLC profiles of soluble microbial products (SMPs) further demonstrated these differences between reactor types in replicate runs. The results of this study showed that reactor configuration can significantly impact the development of the microbial communities of AnMBRs that are responsible for both membrane and reactor performance.
Water impactAnaerobic membrane bioreactors (AnMBRs) have recently gained consideration as an alternative technology for the treatment of municipal wastewater. Despite that, the effect of reactor configurations on their performance and sustainability remains understudied. This work aims to evaluate two different AnMBR types at low organic-loading conditions. Results show that the microbial consortium developed in each reactor can potentially have a significant impact on both biogas production and the microbial products that affect biofouling. |
1. Introduction
The primary advantage to wastewater treatment using anaerobic membrane bioreactors (AnMBRs) is the bioprocess' inherently low energy use and potential for energy recovery. The use of an AnMBR eliminates the requirement of aeration for treatment while also introducing the potential for methane harvesting generated by the anaerobic degradation of organics.1 Additional advantages of the use of AnMBRs are the potential for low biosolids (waste sludge) production, a small reactor footprint due to higher anaerobic degradation rates, and high-quality effluent by use of membrane separation.2 The slow growth of active anaerobic microbial communities complements their ability to maintain high specific degradation rates and methane conversion efficiencies at mesophilic temperatures. This presents a suitable match for their combination with membrane filtration for biomass separation, especially in warmer climates (i.e., Saudi Arabia) where higher operation temperatures can be easily maintained.3Nonetheless, there are a number of limitations in the operation of AnMBRs. One major issue that is directly related to AnMBR sustainability is that of methane recovery capacity. It is still not known to a high degree of accuracy how much energy can be captured per unit of chemical oxygen demand (COD), mainly due to the widely variable operational conditions reported in existing AnMBR literature.4 At high organic loading rates, methane in biogas can approach the maximum theoretically recoverable.5 Although lower operational temperatures increase methane fractions lost in AnMBR effluent,6 low HRTs and organic loading conditions have been shown to significantly reduce methane captured in produced biogas even at mesophilic temperatures.7 With this in mind, methane recovery efficiency remains one of the primary obstacles when evaluating AnMBRs alongside other treatment technologies for municipal wastewater.8,9 Several anaerobic reactor types have been studied in AnMBRs along with their biogas production rates.10 However, the effect of the microbial community differences between these reactor types on methane production is not well understood.
The most dominant obstacle preventing full-scale implementation of AnMBRs remains the issue of membrane biofouling and its impact on the overall sustainability of the AnMBR.2,4 Biofouling control processes are often energy intensive and, as a result, can effectively negate the advantages of using anaerobic digestion.9 This is especially problematic when applying AnMBR technology to municipal and other low-strength wastewaters. The high degradation rates and low biomass production associated with anaerobic digestion have the effect of requiring a higher organic loading rate (OLR) for process stability than can be achieved with a municipal wastewater at normal hydraulic retention times (HRTs).11 Reducing HRT reduces the fraction of the soluble microbial products (SMPs) that are degraded, which accelerates the effects of membrane biofouling.12 The impact of reactor configuration on overall performance and membrane fouling in AnMBRs has been studied,13–15 showing that attached growth reactors have the potential to reduce the effects of biofouling. Furthermore, it has been established that SMP generation is a significant contributor to biofouling.3,16 Little is known, however, about how microbial community differences between reactor types affect SMP generation and biofouling in AnMBRs.
Despite a number of articles addressing AnMBR operation and membrane fouling,14,17–19 the field still lacks a thorough understanding of how microbial community structure and interactions influence the reactor and membrane performance characteristics related to process sustainability.20–22 Our study evaluated different reactor configurations in AnMBRs from a microbial community perspective to improve this understanding. We hypothesized that each reactor configuration would select for different bacterial populations in the sludge and would result in differences in anaerobic treatment efficiency. It was further hypothesized that the differences in reactor configurations would also lead to differences in the generated SMPs and membrane fouling rates. The focus of this work is on studying the microbial communities in different AnMBR reactor configurations (i.e., CSTR and UA) while relating their dynamics to reactor performance. This work also examines SMPs in the suspended sludge of each reactor type and the extracellular polymeric substance (EPS) content of the fouled membrane biofilms, which are critical components governing the sustainability and net energy consumption of AnMBR systems.
2. Materials and methods
2.1. Reactor operating conditions
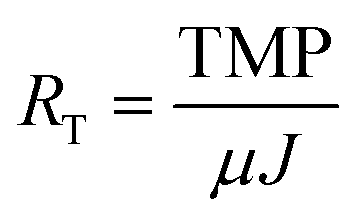
AnMBRs were operated using two reactor configurations, namely CSTR and UA modes (Fig. 1). The CSTR was continuously mixed at 200 rpm by an internal impeller while the UA was filled with cylindrical ceramic packing medium (1.5 cm diameter and length) and operated in up-flow recirculation mode. Both configurations had working volumes of 2 L and were seeded using the same sludge from a parent CSTR AnMBR that had been operating for several months previously. The parent CSTR was originally seeded with a mixture of camel manure and anaerobic sludge from a wastewater treatment plant in Riyadh, Saudi Arabia.5 Both systems were maintained at a temperature of 35 °C (mesophilic conditions); the average annual temperature in Jeddah, Saudi Arabia is over 28 °C. Two external cross-flow flat sheet membrane modules, one polyethersulfone (PES) and one polyvinylidene difluoride (PVDF), were connected to each reactor during each run. Membrane modules were connected in series along the same recirculation line with a recirculation-to-permeate ratio of 600![[thin space (1/6-em)]](https://www.rsc.org/images/entities/char_2009.gif) :1. This resulted in both membrane types being exposed to the same cross-flow conditions and sludge concentrations. Each module had an effective membrane surface area of 50 cm2. For the initial 8 weeks of operation of each run, transmembrane flux was maintained between 5.5 and 8 L m−2 h−1 with an average hydraulic retention time (HRT) of 26 h. At the end of the 8th week, transmembrane flux was increased to above 9 L m−2 h−1 to accelerate membrane fouling. All membranes were harvested after 11 weeks of operation. Biogas was used to scour the membrane surfaces continuously at a biogas to mixed-liquor (suspended sludge) volume ratio of 1:4. No membrane cleaning or backwashing was performed at any time during operation. Transmembrane pressure (TMP) was monitored using external pressure gauges attached to the membrane units. Total membrane resistance (RT) was calculated based on the TMP and transmembrane flux (J) using the following equation:
:1. This resulted in both membrane types being exposed to the same cross-flow conditions and sludge concentrations. Each module had an effective membrane surface area of 50 cm2. For the initial 8 weeks of operation of each run, transmembrane flux was maintained between 5.5 and 8 L m−2 h−1 with an average hydraulic retention time (HRT) of 26 h. At the end of the 8th week, transmembrane flux was increased to above 9 L m−2 h−1 to accelerate membrane fouling. All membranes were harvested after 11 weeks of operation. Biogas was used to scour the membrane surfaces continuously at a biogas to mixed-liquor (suspended sludge) volume ratio of 1:4. No membrane cleaning or backwashing was performed at any time during operation. Transmembrane pressure (TMP) was monitored using external pressure gauges attached to the membrane units. Total membrane resistance (RT) was calculated based on the TMP and transmembrane flux (J) using the following equation:where μ was estimated as the viscosity of water. Sludge was not wasted except as needed for sampling. Sludge retention times (SRTs) for UA and CSTR AnMBRs were 355 and 325 d, respectively. Both reactors were fed with a synthetic wastewater at 800 mg L−1 COD, resulting in an OLR of 0.72 g L−1 d−1. The synthetic wastewater was made up of a mix of organic and inorganic compounds as well as trace metals, as shown in Table S1 of the ESI.†23 Experiments were repeated under the same operating conditions for both AnMBRs. The first experiment is referred to subsequently as run 1 and the replicate experiment as run 2. Both AnMBRs were acclimated to the synthetic wastewater for 3 months prior to the commencement of run 1 and were operated in batch mode for the several weeks between the end of run 1 and the commencement of run 2.
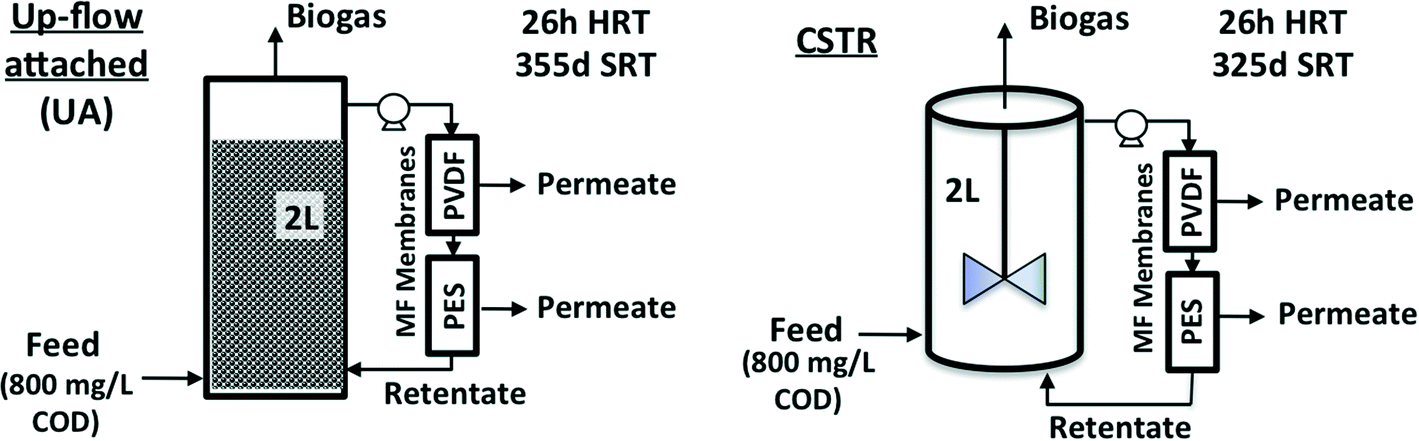 | ||
| Fig. 1 Configurations and operating conditions for up-flow attached-growth (UA) and continuously stirred (CSTR) anaerobic MBRs studied. | ||
2.2. Chemical and physical water quality measurements
Chemical oxygen demand (COD), total organic carbon (TOC) and mixed liquor suspended solids (MLSS) were measured as chemical and physical water quality parameters. The COD of all MBR reactor feeds, retentates, and permeates was determined on a weekly basis using a HACH DR2800 spectrophotometer (Hach, Loveland, CO, USA). Digestion of the samples was carried out in either HACH LCK 314 (15–150 mg L−1) or LCK 514 COD (100–2000 mg L−1) cuvette test vials (Hach-Lange, Manchester, UK) depending on the concentration to be measured. TOC of AnMBR effluents was determined for both UA and CSTR reactors on a bi-weekly basis. Samples were taken from the effluent of the reactor system, filtered with 0.2 μm cellulose acetate syringe filters (VWR Int., Radnor, PA, USA) and diluted accordingly based on expected TOC concentrations. The samples were then measured for dissolved organic carbon (DOC) as non-purgeable organic carbon (NPOC) using high-temperature combustion on a Shimadzu TOC/TN-VCPN analyzer (Shimadzu Corp., Japan). The mixed liquor suspended solids (MLSS) concentration of the CSTR AnMBR sludge was determined monthly in compliance with standard method 2540D.24 Briefly, 50 mL of sludge was filtered through a weighed 8 μm Whatman Nuclepore™ track-etched polycarbonate filter (GE Healthcare Life Sciences, Little Chalfont, UK) and then dried at 105 °C and weighed again. The UA AnMBR was not measured for MLSS as the majority of its biomass was attached to the packing medium of the reactor and its suspended sludge would not be representative.2.3. Biogas measurement
Biogas produced from each reactor was captured continuously in gas bags from the headspace of the reactors, and the volume was measured by removing the biogas with a volumetric syringe. CH4, O2, N2, and H2 were measured on an SGI Model 301C gas chromatograph with a molecular sieve column using argon as a carrier gas followed by a thermal conductivity detector (TCD). CO2 was measured on a separate SGI Model 301C gas chromatograph with a silica column using helium as the carrier gas followed by a TCD. 200 μL aliquots of biogas were injected upstream of each respective gas chromatograph column.Biomass regeneration rates and losses in the effluent were calculated to estimate actual methane yield per unit COD. A microorganism decay rate of 0.03 d−1 and COD conversion coefficient of 1.42 g COD per g microorganism were assumed.25 To determine CO2 and CH4 lost in the effluent, batch tests to manually strip all dissolved gasses were performed after cessation of methane production. The dissolved biogas susceptible to being lost in the effluent was in the liquid phase of both the UA and the CSTR AnMBRs, as it was the only portion of sludge that was in contact with the membranes and subject to filtration. As such, suspended sludge was used for both reactors. Tests were done in triplicate on 10 mL sludge samples in 30 mL vials from both reactors. In order to strip the dissolved gasses completely, the headspace-to-liquid ratio was increased to approximately 30 times that of the reactors and filled with 100% nitrogen to increase the batch tests' mass transfer capacity. Test vials were vortexed for 5 min and then placed on a shaker at 100 rpm for 24 h at 35 °C. The 20 mL headspace was then measured for methane content. Methane yield was calculated based on stoichiometric conversion rates of proteins, lipids, and carbohydrates and their ratios in the synthetic wastewater.25
2.4. Sludge and membrane biomass sampling for microbial analysis
1 mL of sludge from the CSTR AnMBR was sampled every 2 to 3 weeks. Samples were pelleted by adding 0.6 mL of 1× PBS solution and centrifuging for 10 min at 9400g. The UA AnMBR was sampled every 3–4 weeks for both suspended and attached (i.e., bound to ceramic packing media) biomass. For sampling of the UA reactor, 8 mL of suspended sludge was pelleted by adding 5 mL of 1× PBS and centrifuging for 15 min at 9400g. The pellet was subsequently re-suspended in 1 mL of 1× PBS and pelleted at 9400g for 10 min before storing at −20 °C. For the attached growth portion of the UA AnMBR, a single ceramic carrier was removed for each sampling event from the middle section of the reactor and suspended in 5–6 mL of 1× PBS for 30 min and brushed of all attached biomass. The suspension was sonicated for 5 min at 25% frequency, pulsating at 2 s intervals using the QSonica Q500 Sonicator (QSonica LLC, Newton, CT, USA). The suspended solution was then pelleted by centrifuging at 9400g and stored at −20 °C.For analysis of the microbial community in the attached membrane biofilms, the biomass was divided into two portions: (i) loosely bound and (ii) strongly bound. For the loosely bound biofilm portion, three freshly harvested 4 cm2 membrane segments, cut from sections equally spaced along the length of the membrane surface, were each dipped lightly five times in 6 mL of 1× PBS. The suspension was then divided into 2 mL aliquots and pelleted by centrifuging for 30 min at 9400g and stored at −20 °C. For the strongly bound biofilm portion, each of the same three separate segments was aseptically cut into strips and placed into a 2 mL tube with 2 mL of 1× PBS. The tubes were vortexed for 5 min and then sonicated for 5 min at 25% frequency and 2 s pulsating intervals using the QSonica Q500 Sonicator (QSonica LLC). The suspension was then pelleted by centrifuging for 30 min at 9400g and stored at −20 °C.
2.5. DNA extraction and barcoded amplification of 16S rRNA genes
Genomic DNA was extracted using the UltraClean® Soil DNA Isolation Kit (MoBio Laboratories, Carlsbad, USA) with slight modifications to the protocol by adding lysozyme and achromopeptidase to the lysis buffer.26 PCR amplification of the extracted DNA was performed with barcoded forward primer 515F (5′-GTGYCAGCMGCCGCGGTA-3′) and reverse primer 909R (5′-CCCCGYCAATTCMTTTRAGT-3′) based on thermal cycling conditions previously described.27 Amplicons from all DNA samples were of the correct anticipated size of ~450 bp and controls for PCR reactions were found negative for amplification. PCR amplicons were gel-purified with Wizard SV Gel and PCR Clean-up system (Promega, Madison, USA). Concentrations were determined by Qubit® broad range dsDNA assay (Invitrogen, Carlsbad, CA, USA). Equimolar concentrations of the samples were mixed together and submitted to KAUST Genomics Core lab for Ion Torrent sequencing (Life Technologies, Carlsbad, USA) on 318 chips.2.6. Ion Torrent sequencing of 16S rRNA genes and data analysis
Sequences obtained from Ion Torrent platforms were initially sorted by the Bioinformatics Team at KAUST based on a Phred score of >20. The primers, barcodes, and adaptors were then trimmed off the sequences. Remaining sequences of lengths less than 350 nt were removed. The processed 16S rRNA gene sequences were also removed of chimera using UCHIME.28 Chimera-removed sequence files were then analyzed based on their 16S rRNA gene sequences using two different approaches.The first approach assigned sequences to bacterial/archaeal taxonomic hierarchy at a 95% confidence level using the Ribosomal Database Project (RDP) Classifier.29 The relative abundances of the bacterial and archaeal genera were calculated, collated and then square-root transformed. The transformed data set were then computed for their Bray–Curtis similarities and represented graphically for spatial distribution in a bootstrapped metric multidimensional scaling (mMDS) plot using Primer-E version 7.30 One-way analysis of similarity (ANOSIM) was performed as a test statistic using Primer-E version 7 to evaluate differences among clustering patterns of the mMDS plot. One-way ANOSIM generates a denominator constant R, ranging from 0 to 1 with a corresponding P value. The R statistic provides a comparative measure of the degree of separation among clustered patterns with R = 0 representing no differences between compared sample groups and R = 1 representing sample groups with complete dissimilarity.31
In the second approach, sequence files were sorted based on ratio of identical sequences to total sequences and identified as unique operational taxonomic units (OTUs). All chimera-removed sequence files were combined with an in-house written Perl script. The combined sequence file was then sorted for unique OTUs at 97% 16S rRNA gene similarity using CD-Hit.32 OTUs were prioritized based on highest average relative abundance in each reactor and sorted accordingly. OTUs with an average relative abundance in either the UA or the CSTR AnMBR of above 0.3% of total sequences were blasted against the NCBI nucleotide database using the BLASTN algorithm to check for their closest matching bacteria or archaea species. Results of sequence blasting were then recorded for NCBI sequence identity similarity data (closest classified species, identity match, maximum score, and E-value). For the comparison of average relative abundances of sample sets, an independent (unpaired) two-tailed t-test was used with an assumption of unequal variance between sample sets.
All high-throughput sequencing files were deposited in the Short Read Archive (SRA) of the European Nucleotide Archive (ENA) under study accession number PRJEB8654.
2.7. Reactor SMP and membrane biofilm EPS extraction and analysis
For this study, SMP was defined as soluble compounds extracted from the liquid phase of suspended sludge and permeate samples while EPS represented those compounds extracted from attached membrane biofilms. For the analysis of SMPs in the reactor feed, retentate, and permeates, the samples were filtered with 0.2 μm cellulose acetate syringe filters (VWR Int., Radnor, PA, USA). For the analysis of the soluble EPS in the attached membrane biofilms, a freshly harvested membrane surface area of approximately 4 cm2 was aseptically cut into strips and placed into a 2 mL tube with 2 mL of 1× PBS for EPS extraction. The tubes were vortexed for 5 min and then sonicated for 5 min at 25% frequency and 2 s pulsating intervals using the QSonica Q500 Sonicator (QSonica LLC). The suspension was then centrifuged for 30 min at 9400g. The supernatant was retained and filtered with 0.2 μm pore size CA syringe filters. The polysaccharide content was quantified using the phenol–sulfuric acid method with glucose as standard.33 The total protein kit from Sigma-Aldrich was employed for extracted protein content determination with modifications according to the Peterson protocol34 with bovine serum albumin (BSA) as the standard.Analysis of the molecular weight of SMPs and soluble EPS was conducted with a Waters Breeze™ 2 HPLC System (Waters Chromatography, Milford, MA, USA) equipped with a Binary HPLC pump (Waters 1525), Auto sampler (Waters 2707) and UV/Visible Detector (Waters 2489). The SEC method was carried out with a Shodex KW-802.5 column. The injection volume for each sample was 20 μL with 20 min retention time, and the mobile phase consisted of 50 mM phosphate buffer (pH = 7.0) with 300 mM NaCl. The detection was carried out at room temperature with a UV detector at 210 and 280 nm wavelengths, which are commonly used for EPS.35 UV absorbance at both wavelengths has been used extensively for protein determination.36 Based on previous studies that have used UV for excitation, 210 nm wavelengths represent protein-like substances while 280 nm wavelengths more commonly detect humic-like substances.37,38 Molecular weights of compounds detected were calculated based on a calibration curve (y = −0.454x + 8.38) established for proteins of known molecular weights (x) and their corresponding peak retention times (y).
2.8. Membrane categorization for surface morphology, hydrophobicity and surface charge
The membranes used were JX model MF PVDF (GE Osmonics, Minnetonka, MN, USA) and HFK-618 model MF PES (Koch Membranes, Wilmington, MA, USA). Pore sizes were 0.3 and 0.2 μm for the PVDF and PES, respectively, as determined by the manufacturer. The surface morphology of dry membranes was analyzed with an Agilent 5400 SPM Multimode Scanning Probe (Agilent Technologies, Santa Clara, CA, USA) Atomic Force Microscope (AFM). Imaging was carried out in tapping mode using a probe with a nominal cantilever length of 225 μm, a nominal tip radius of 10 nm, and a spring constant of 0.6–3.7 N m−1. The interactions between the tip and the membrane surfaces were recorded to map the three-dimensional topography of the membranes. This map was then used to determine the average surface roughness using the root mean square (RMS) method for areas of 30 μm × 30 μm and 3 μm × 3 μm of each membrane used in AnMBR operation.The hydrophobicity of each membrane was assessed using contact angles, which were determined by the static drop technique with a KSV Cam 200 optical contact angle meter (KSV Instruments Ltd., Finland). Briefly, deionized water was made to come into contact with the membrane surface by a micro-syringe to a droplet size of diameter 0.4–0.5 cm. At least three different contact angle measurements were carried out for each piece of membrane to obtain an average.
The surface charge of each membrane was determined by zeta potential, which was measured using a Surpass Complete electrokinetic analyzer (Anton Paar, GmbH, Graz, Austria). The membranes were equilibrated with the electrolyte (0.5 M NaCl) for at least 30 min before measurement. The electrolyte was titrated stepwise from pH 3 to 10 in increments of 0.5 with triplicate measurements taken at each step. The zeta potential of the membrane was automatically calculated by the analyzer from the streaming potentials using the Helmholtz–Smoluchowski equation with the Fairbrother and Mastin substitution to correct for membrane surface conductance.39
3. Results
3.1. Reactor performance
Both the UA and the CSTR AnMBRs were seeded from the same anaerobic reactor sludge and run under similar operating conditions (HRT, SRT, OLR, etc.) for replicate experiments (run 1 and run 2) as described previously. Both reactors showed COD removal rates of over 90% throughout operation for both runs 1 and 2 (Fig. S1†). In addition to CO2, N2, and CH4, low levels of H2 were also detected in the measured biogas (0.1–0.5% of total volume). The CSTR CH4 content in the captured biogas (80–90%) was consistently higher than that of the UA AnMBR (75–85%). Conversely, the CO2 content in the biogas of the CSTR was significantly lower (1–2%) for both runs 1 and 2 than in the UA reactor (6–10%). Total produced CO2 was calculated to be much higher than what was captured in the biogas; CO2 recovered from batch tests accounted for approximately 100 mL per liter of effluent for both reactors. Average methane captured from the CSTR in both runs was 11–18% higher than from the UA (Table 1). Captured methane was 5% higher in the CSTR for run 1 (269 ± 51 mL g−1 COD) than run 2 (256 ± 53 mL g−1 COD). Average methane captured for the UA was 236 ± 35 mL g−1 COD and 234 ± 41 mL g−1 COD for runs 1 and 2, respectively. Differences in average UA and CSTR daily methane production rates were determined to be significant for both run 1 (unpaired t-test, P = 0.048) and run 2 (unpaired t-test, P = 0.014). Actual methane yield was calculated based on the measured biogas content trapped in solution that was likely lost in the effluent. Methane in the effluent accounted for approximately 62 mL g−1 COD and 57 mL g−1 COD (i.e., 21% and 18% of total methane) in the UA and CSTR reactor, respectively. Methane yield was calculated based on the available COD after considering COD removal efficiency and conversion to biomass as described in section 2.4 and the ESI.†| UA AnMBR | CSTR AnMBR | Max. th. | |||
|---|---|---|---|---|---|
| Run 1 (n = 15) | Run 2 (n = 21) | Run 1 (n = 19) | Run 2 (n = 27) | ||
| a Total CH4 = CH4 captured + CH4 measured in effluent. b Based on available COD not converted to biomass. c Based on 33% electrical conversion efficiency. | |||||
| Captured CH4 (mL d−1) | 225 ± 34 | 223 ± 40 | 263 ± 50 | 250 ± 52 | 342 |
| Captured CH4 (mL g−1 COD) | 236 ± 35 | 234 ± 41 | 269 ± 51 | 256 ± 53 | 350 |
| Total CH4a (mL g−1 COD) | 298 ± 38 | 296 ± 45 | 326 ± 55 | 313 ± 57 | 350 |
| Captured potential energyb (kW h m−3 WW) | 1.25 ± 0.21 | 1.26 ± 0.25 | 1.43 ± 0.30 | 1.37 ± 0.31 | 1.90 |
| Usable potential energyc (kW h m−3 WW) | 0.42 ± 0.07 | 0.42 ± 0.08 | 0.48 ± 0.10 | 0.46 ± 0.10 | 0.63 |
3.2. Membrane operation
Membrane fouling was evaluated as total resistance (Fig. 2) as described previously. Total resistance profiles correlated well with membrane TMP profiles (ESI,† Fig. S2). PVDF and PES MF membranes in both AnMBRs were operated at fluxes of below 8 L m−2 h−1 for the initial 8 weeks in each run. After the 8th week, flux was increased for a period of 2–3 weeks, during which total resistance showed general increases for all membranes. PVDF membranes showed minimal premature fouling (weeks 1–8) in both runs for both AnMBRs. Conversely, PES membranes experienced premature fouling in the UA during run 2 and CSTR during run 1 (Fig. 2B and C). | ||
| Fig. 2 Total resistance profiles for polyvinylidene fluoride (PVDF) and polyethersulfone (PES) membranes used in (a) UA AnMBR for run 1, (b) UA AnMBR for run 2, (c) CSTR AnMBR for run 1, and (d) CSTR AnMBR for run 2. | ||
3.3. Microbial similarity analysis in AnMBR sludge and membrane biofilms
Similarities among microbial communities from the seed sludge, CSTR sludge, CSTR membrane biofilms, UA-attached sludge, UA-suspended sludge, and UA membrane biofilms are represented graphically in a metric multidimensional scaling (mMDS) plot (Fig. 3). This plot displays each sample as a point in a two-dimensional space based on a distance matrix applied to all samples. Samples with higher similarity to one another are clustered closer on the mMDS plot and vice versa. Clustering of samples was based on three factors: (i) temporal changes, (ii) sample type (i.e., attached biomass versus suspended biomass), and (iii) reactor configuration. To illustrate, the suspended UA biomass from run 1 showed similarity with CSTR sludge samples (also suspended) from run 1 (ANOSIM R = 0.339, P = 0.079). Suspended UA biomass samples from run 2, however, showed increased separation from CSTR sludge samples (ANOSIM R = 0.838, P < 0.01) due to the effect of temporal changes. Furthermore, UA attached biomass samples were completely separated (ANOSIM R = 1, P < 0.05) from both UA suspended sludge and CSTR sludge samples from the same run (both runs 1 and 2), illustrating the differences between attached and suspended sludge. UA PVDF membrane communities exhibited high similarity with UA PES communities during run 1 (ANOSIM R = 0.135, P = 0.17) and run 2 (ANOSIM R = 0.260, P = 0.14), while CSTR PVDF membrane communities exhibited significant differences with CSTR PES communities in run 1 (ANOSIM R = 0.771, P = 0.029) and run 2 (ANOSIM R = 0.656, P = 0.029). Despite the initial similarity between sludge samples from the CSTR and the UA reactors, membrane communities across reactor types showed complete separation (ANOSIM R = 1, P < 0.05) in all instances.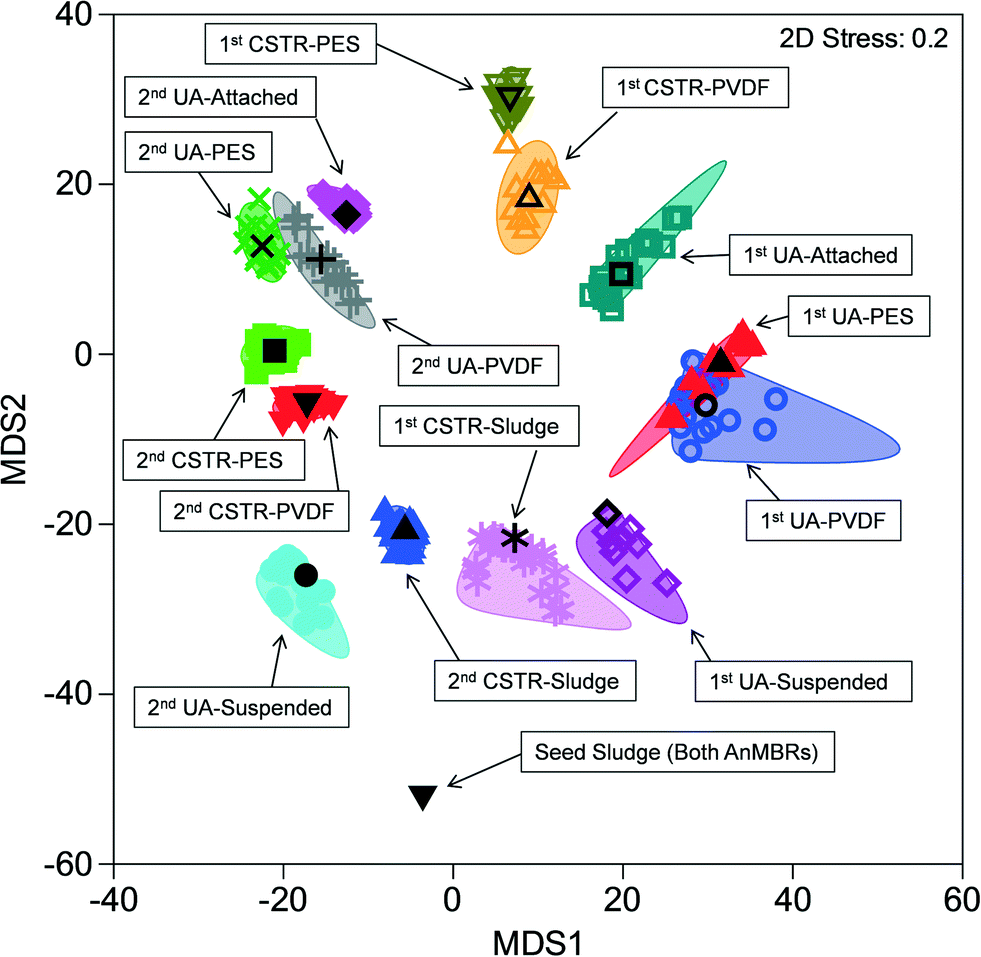 | ||
| Fig. 3 Metric multi-dimensional scaling (mMDS) plot of microbial community similarities for all samples from up-flow attached-growth (UA) and continuously stirred (CSTR) AnMBRs for runs 1 and 2. | ||
3.4. Reactor-based microbial comparison
Given that clustering of samples was based, in part, on reactor configuration, an OTU-based analysis was further performed to determine differences in microbial populations between the CSTR and UA reactors (Table 2A). OTUs with high similarity to syntrophic Smithella propionica were identified in both runs 1 and 2 of the UA AnMBR. These OTUs accounted for average relative abundances (RAs) of 1.39% and 2.83% in runs 1 and 2, respectively, and had significantly higher relative abundances in the UA AnMBR versus the CSTR (unpaired t-test, P < 0.0001 and P < 0.001, respectively). Additionally, Aminivibrio pyruvatiphilus, a bacterium known to grow in co-culture with hydrogen-utilizing methanogens, was detected at a UA/CSTR average RA ratio of 2.27 (unpaired t-test, P = 0.004) in run 1. OTUs with high identity similarity to Levilinea saccharolytica, a filamentous fermentative bacterium, were found to be present at higher relative abundance in the UA reactor for both runs 1 and 2 than in the CSTR (UA/CSTR RA = 24.3 and 15.5, respectively) with high significance (unpaired t-test, P = 0.006 and P < 0.0001, respectively). Furthermore, several methanogens identified were more abundant in the UA than the CSTR AnMBR. An OTU associated with Methanospirillum stamsii was identified in run 2 as having high relative abundance (0.863%) in the UA as compared to the CSTR (0.005%) with high significance (unpaired t-test, P = 0.007). In addition, an OTU associated with Methanosaeta concilii also had high UA/CSTR RA ratios during run 2 (7.45) with high significance (unpaired t-test, P = 0.005).| (A) Closest species match | UA avg. (%) | CSTR avg. (%) | UA/CSTR ratio | P-value | Identity match (%) |
|---|---|---|---|---|---|
| Run 1 | |||||
| Smithella propionica | 1.39 | 0.163 | 8.51 | <0.0001 | 98 |
| Levilinea saccharolytica | 0.573 | 0.023 | 24.3 | 0.006 | 98 |
| Methanobacterium formicicum | 0.137 | 1.74 | 0.079 | 0.009 | 98 |
| Aminivibrio pyruvatiphilus | 0.507 | 0.223 | 2.27 | 0.004 | 98 |
| Geobacter lovleyi | 2.31 | 0.179 | 12.9 | 0.036 | 98 |
| Run 2 | |||||
| Smithella propionica | 2.83 | 0.087 | 32.6 | <0.001 | 95 |
| Levilinea saccharolytica | 0.513 | 0.033 | 15.5 | <0.0001 | 98 |
| Methanobacterium formicicum | 0.110 | 0.416 | 0.24 | 0.013 | 96 |
| Methanospirillum stamsii | 0.863 | 0.005 | 185 | 0.007 | 97 |
| Methanosaeta concilii | 1.11 | 0.149 | 7.45 | 0.005 | 99 |
| (B) Closest species match | UA sludge avg. (%) | CSTR sludge avg. (%) | UA/CSTR sludge ratio | P-value | Identity match (%) |
|---|---|---|---|---|---|
| Run 1 | |||||
| Microbacter margulisiae | 0.016 | 20.4 | 7.6 × 10⁻⁴ | 0.002 | 85 |
| Lutispora thermophila | 2.90 | 10.1 | 0.286 | <0.001 | 88 |
| Run 2 | |||||
| Prolixibacter bellariivorans | 0.0007 | 23.8 | 2.95 × 10⁻⁵ | <0.001 | 86 |
In contrast, one methanogenic species was determined to be more prevalent in the CSTR AnMBR. Methanobacterium formicicum was present in the CSTR at a higher relative abundance than in the UA for both runs 1 and 2 with UA/CSTR RA ratios of 0.079 and 0.24, respectively (unpaired t-test, P = 0.009 and 0.013). Additionally, several OTUs were identified that made up a significant overall percentage of the CSTR sludge (20–30%) throughout both runs 1 and 2 (Table 2B). OTUs closest related to Microbacter margulisiae and Lutispora thermophila made up an average relative abundance of 20.4% and 10.1%, respectively, in the CSTR sludge during run 1. In run 2, two OTUs most closely related to Prolixibacter bellariivorans made up an average relative abundance of 23.8% of the CSTR sludge. All three of these OTUs had significantly lower representation in the UA reactor sludge with UA/CSTR sludge RAs of 7.61 × 10⁻⁴, 0.286, and 2.95 × 10⁻⁴, respectively (unpaired t-test, P = 0.002, P < 0.001 and P < 0.001).
3.5. Microbial differences between attached and suspended biomass
Analysis of RDP classifier results showed a major difference in the relative abundance ratio of archaea to bacteria between attached biomass (UA carriers and all membranes) and suspended biomass samples (CSTR and UA suspended sludge). In general, attached biomass samples had a significantly higher (unpaired t-test, P < 0.0001) average relative abundance of nucleotide sequences classified as archaea (7.96% average) than did suspended biomass samples (0.84% average). The relative abundance ratio between archaea in attached biomass samples to archaea in suspended biomass samples was 7.90 in run 1 (unpaired t-test, P < 0.001) and 11.1 in run 2 (unpaired t-test, P < 0.0001).Similarly, genus-based analysis revealed that key bacterial and archaeal genera were present in the attached biomass of the UA at significantly higher relative abundances than in the suspended biomass of both the UA and the CSTR. To illustrate, Syntrophobacter was present in the UA at an attached to suspended sludge ratio of 6.32 in run 1 (unpaired t-test, P = 0.031) and 10.4 in run 2 (unpaired t-test, P = 0.0023). The UA-attached sludge to CSTR sludge (suspended) ratio for Syntrophobacter was also higher in both runs 1 and 2 at 4.07 and 1.48, respectively (unpaired t-test, P = 0.096 and P = 0.042). Several other genera identified as syntrophic bacteria were found to have UA-attached to UA-suspended sludge ratios and UA-attached to CSTR sludge ratios of greater than 1 (ranging from 2.45 to 127) with high significance (Table 3) in runs 1 and 2. Among these genera were Smithella, Syntrophomonas, and unclassified Syntrophobacteraceae. Other bacteria that favored attached sludge as compared to suspended were Geobacter and Desulfovibrio, with UA-attached to UA-suspended sludge ratios ranging from 6.43 to 8.32 (unpaired t-test, P < 0.05) and UA-attached to CSTR sludge ratios ranging from 2.43 to 32.2 (unpaired t-test, P < 0.07).
| UA att./UA SS ratio | P-value | UA att./CSTR SS ratio | P-value | |
|---|---|---|---|---|
| a Normalized based on total relative abundance of archaea. | ||||
| Run 1 | ||||
| Syntrophomonas | 15.6 | 0.0013 | 3.89 | 0.061 |
| Smithella | 2.85 | 0.018 | 6.69 | 0.058 |
| Syntrophobacter | 6.32 | 0.031 | 4.07 | 0.096 |
| Unclassified Syntrophobacteraceae | 11.8 | 0.0066 | 39.7 | 0.060 |
| Desulfovibrio | 6.43 | 0.049 | 32.7 | 0.034 |
| Methanobacterium | 1.05 | 0.23 | 0.778 | 0.034 |
| Methanosaeta | 2.74 | 0.058 | 1.64 | 0.15 |
| Run 2 | ||||
| Smithella | 2.45 | 0.037 | 3.33 | 0.026 |
| Syntrophobacter | 10.4 | 0.0023 | 1.48 | 0.042 |
| Geobacter | 8.32 | 0.018 | 4.44 | 0.026 |
| Desulfovibrio | 6.47 | 0.031 | 2.43 | 0.065 |
| Unclassified Syntrophobacteraceae | 41.2 | 0.0030 | 127 | 0.0031 |
| Methanobacterium | 0.299 | 0.0070 | 0.523 | <0.0001 |
| Methanospirillum | 3.26 | 0.0098 | 44.1 | 0.0058 |
| Methanosaeta | 4.51 | 0.0022 | 3.89 | 0.0024 |
Relative abundances of individual methanogens were compared on a percent of total archaeal sequences basis. These results showed that for run 1, Methanobacterium had the highest relative abundance among methanogens in the UA-attached, UA-suspended, and CSTR sludge biomass at 42.3 ± 13.9%, 40.3 ± 9.2%, and 54.4 ± 8.9%, respectively. For run 2, however, the UA-attached archaeal community was dominated by Methanosaeta with an average relative abundance of 43.8 ± 9.1% while UA-suspended and CSTR sludge biomass during run 2 remained dominated by Methanobacterium at 65.0 ± 13.9% and 37.1 ± 6.6%, respectively. UA-attached to UA-suspended ratios of Methanobacterium were 1.05 and 0.299 (unpaired t-test, P = 0.23 and P = 0.0070) while UA-attached to CSTR sludge ratios were 0.778 and 0.523 (unpaired t-test, P = 0.034 and P < 0.0001) for runs 1 and 2, respectively. For Methanosaeta, UA-attached to UA-suspended ratios were significantly higher at 2.74 and 4.51 (unpaired t-test, P = 0.058 and P = 0.0022) for runs 1 and 2, respectively. Similarly, UA-attached to CSTR sludge ratios for Methanosaeta were 1.64 and 3.89 (unpaired t-test, P = 0.15 and P = 0.0024).
3.6. Membrane biofilm EPS content
Total protein and total carbohydrate contents were quantified for the soluble EPS obtained from both PVDF and PES membrane biofilms from each AnMBR for both runs 1 and 2. Results were averaged for 3 equal size sections from each membrane and normalized against the total extracted DNA concentration obtained from those same membrane sections (Fig. 4). Total protein as well as total carbohydrates were determined to be consistently lower in the soluble EPS of UA AnMBR membrane samples (0.2–0.7 μg ng−1 DNA) than in that of CSTR AnMBR membrane samples (0.4–2.7 μg ng−1 DNA). Protein and carbohydrate contents quantified for the CSTR PES membrane biofilm were higher than its corresponding PVDF membrane in runs 1 and 2.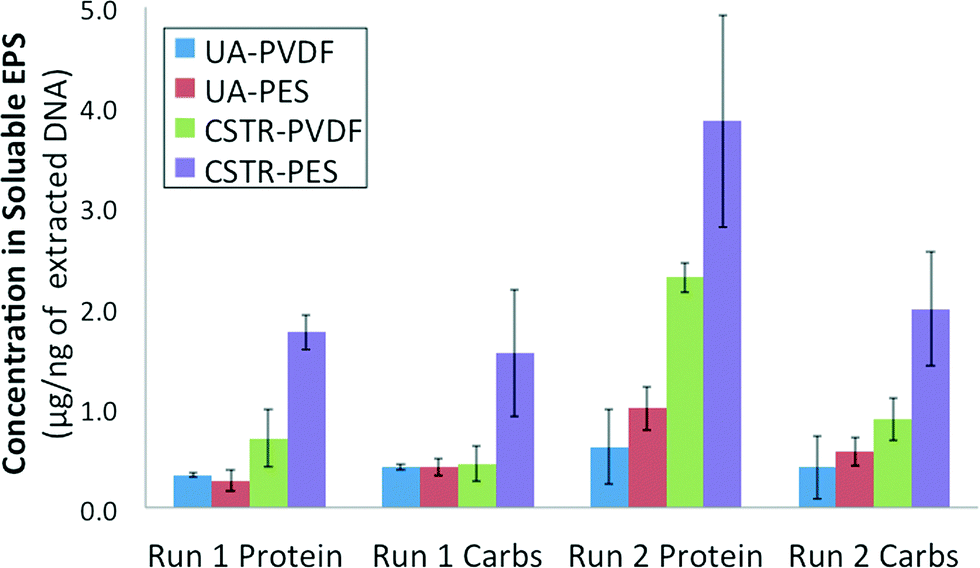 | ||
| Fig. 4 Extracellular polymeric substance (EPS) protein and carbohydrate contents of membrane biofilm biomass normalized against total extracted DNA concentrations from all membranes of both AnMBRs for runs 1 and 2. | ||
3.7. AnMBR retentate SMP profile dynamics
In total, 31 samples from both reactors over runs 1 and 2 (n = 9 for CSTR run 1, n = 8 for CSTR run 2, n = 6 for UA run 1, and n = 8 for UA run 2) were analyzed for SMP content. A principal component analysis (PCA) was performed for 210 nm UV absorbance profiles for all retentate samples from both reactors for runs 1 and 2. UA samples were separated from CSTR samples along PC1, representing reactor-based differences in SMPs, while run 1 samples were separated from run 2 samples along PC2, illustrating temporal changes in both reactors (Fig. 5). CSTR samples within each run were also more broadly distributed along PC1 than UA samples. In general, the PCA plot shows that there was higher variation in the CSTR retentate samples (in terms of SMP protein profiles at 210 nm absorbance) both between runs 1 and 2 and within each run than in corresponding UA retentate samples. | ||
| Fig. 5 Principal component analysis (PCA) plot comparing high-performance liquid chromatography (HPLC) profiles of protein-like substances detected at 210 nm UV absorbance for retentate soluble microbial products (SMP) samples of up-flow attached-growth (UA) and continuously stirred (CSTR) AnMBRs for runs 1 and 2. | ||
3.8. SMP and EPS fractions – potential relation to PES membrane fouling
A more in-depth analysis of protein-like SMPs using HPLC profiles at 210 nm UV absorbance revealed that a peak representing a ~600 kDa molecular weight (MW) compound was present in all SMP retentate samples from both reactors and both runs 1 and 2 (Fig. 6B). This peak, however, was not seen in any of the corresponding permeate profiles as it represents the largest molecular weight compound detected by HPLC at 210 nm UV wavelength (shortest retention time). There was no observable variation in the 600 kDa peak size temporally or between reactor types. Additionally, a peak representing a ~100 kDa MW compound was observed intermittently in samples from the CSTR retentate in run 1 (Fig. 6A). This peak was not observed in any SMP retentate samples from the CSTR in run 2 or from the UA in either run (Fig. 6B). Unlike the 600 kDa peak, this peak was also seen in the corresponding permeate samples when present in the retentate. This peak was only observed in CSTR samples for run 1 on days 11, 36, and 65, all of which coincided with increases in the CSTR PES membrane's total resistance. Neither the 600 kDa peak nor the 100 kDa peak was present in any reactor influent HPLC profiles.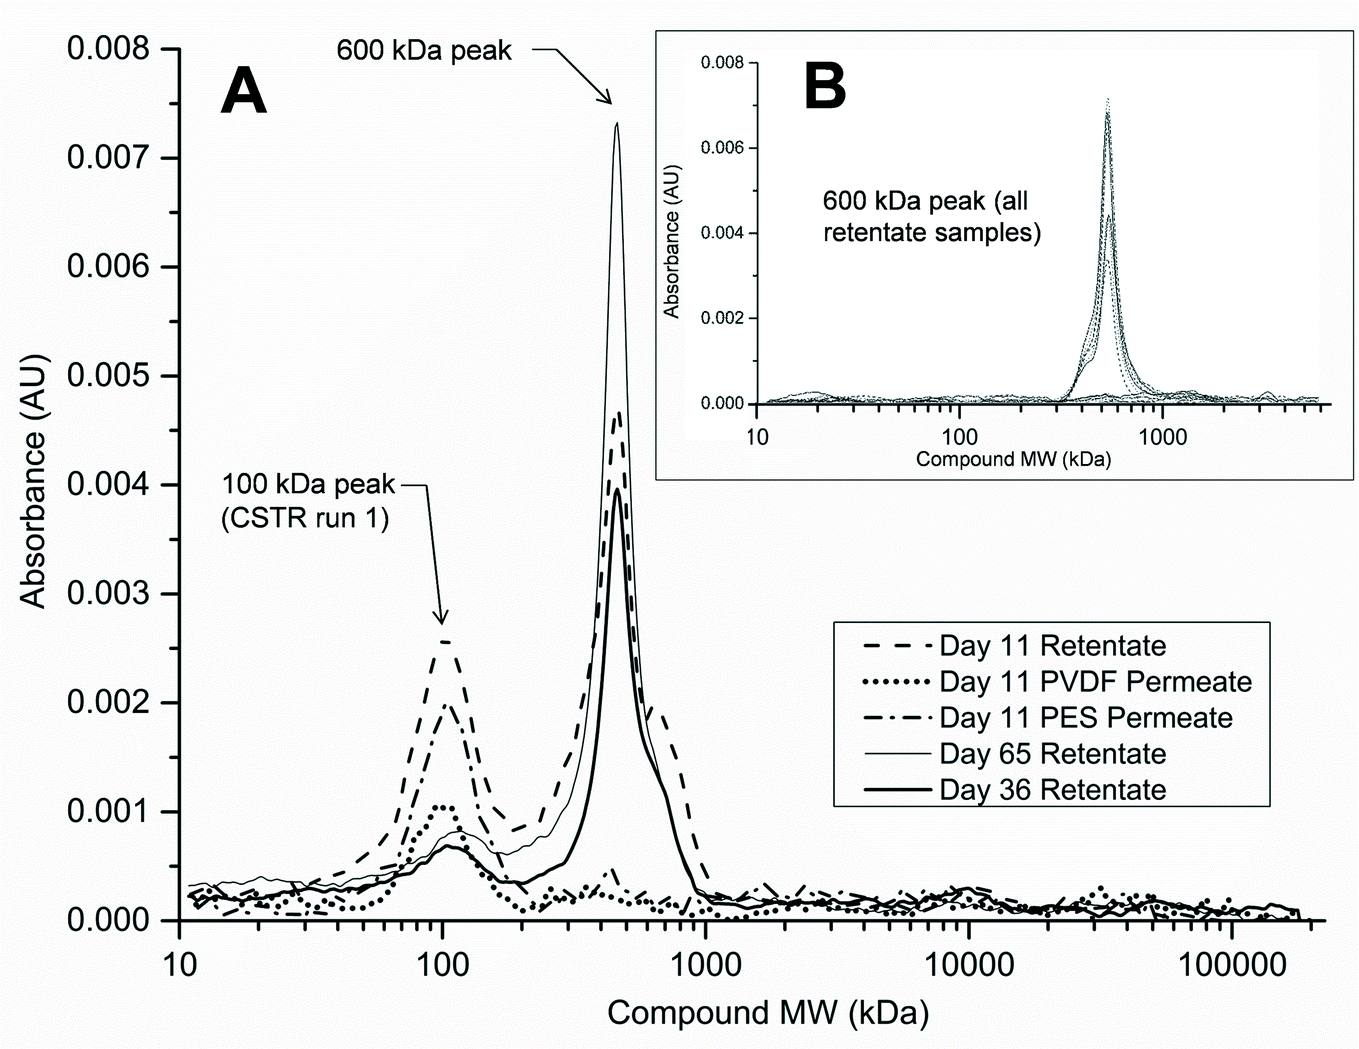 | ||
| Fig. 6 High-performance liquid chromatography (HPLC) absorbance profiles for (a) SMP samples containing peaks representing 100 kDa protein-like compound (CSTR run 1) and (b) all other retentate SMP samples (both reactors, runs 1 and 2). | ||
Analysis of HPLC results for membrane biofilm EPS contents showed that protein profiles detected at 210 nm consistently contained the 600 kDa MW compound. The peak size of this compound increased for membranes that experienced premature increases in total membrane resistance (Fig. 7). Absorbance profiles at 210 nm for soluble membrane biofilm EPS showed a 3-fold or greater increase in peak height at this retention time between the CSTR PES membrane and the CSTR PVDF membrane during run 1 (Fig. 6C). Likewise, peak height of the 210 nm protein fragment was greater in the UA PES membrane as compared to the UA PVDF membrane in run 2 (Fig. 6B). This peak was also seen in absorbance profiles detected at 280 nm and followed a similar trend, although peak heights were consistently lower than those detected at 210 nm.
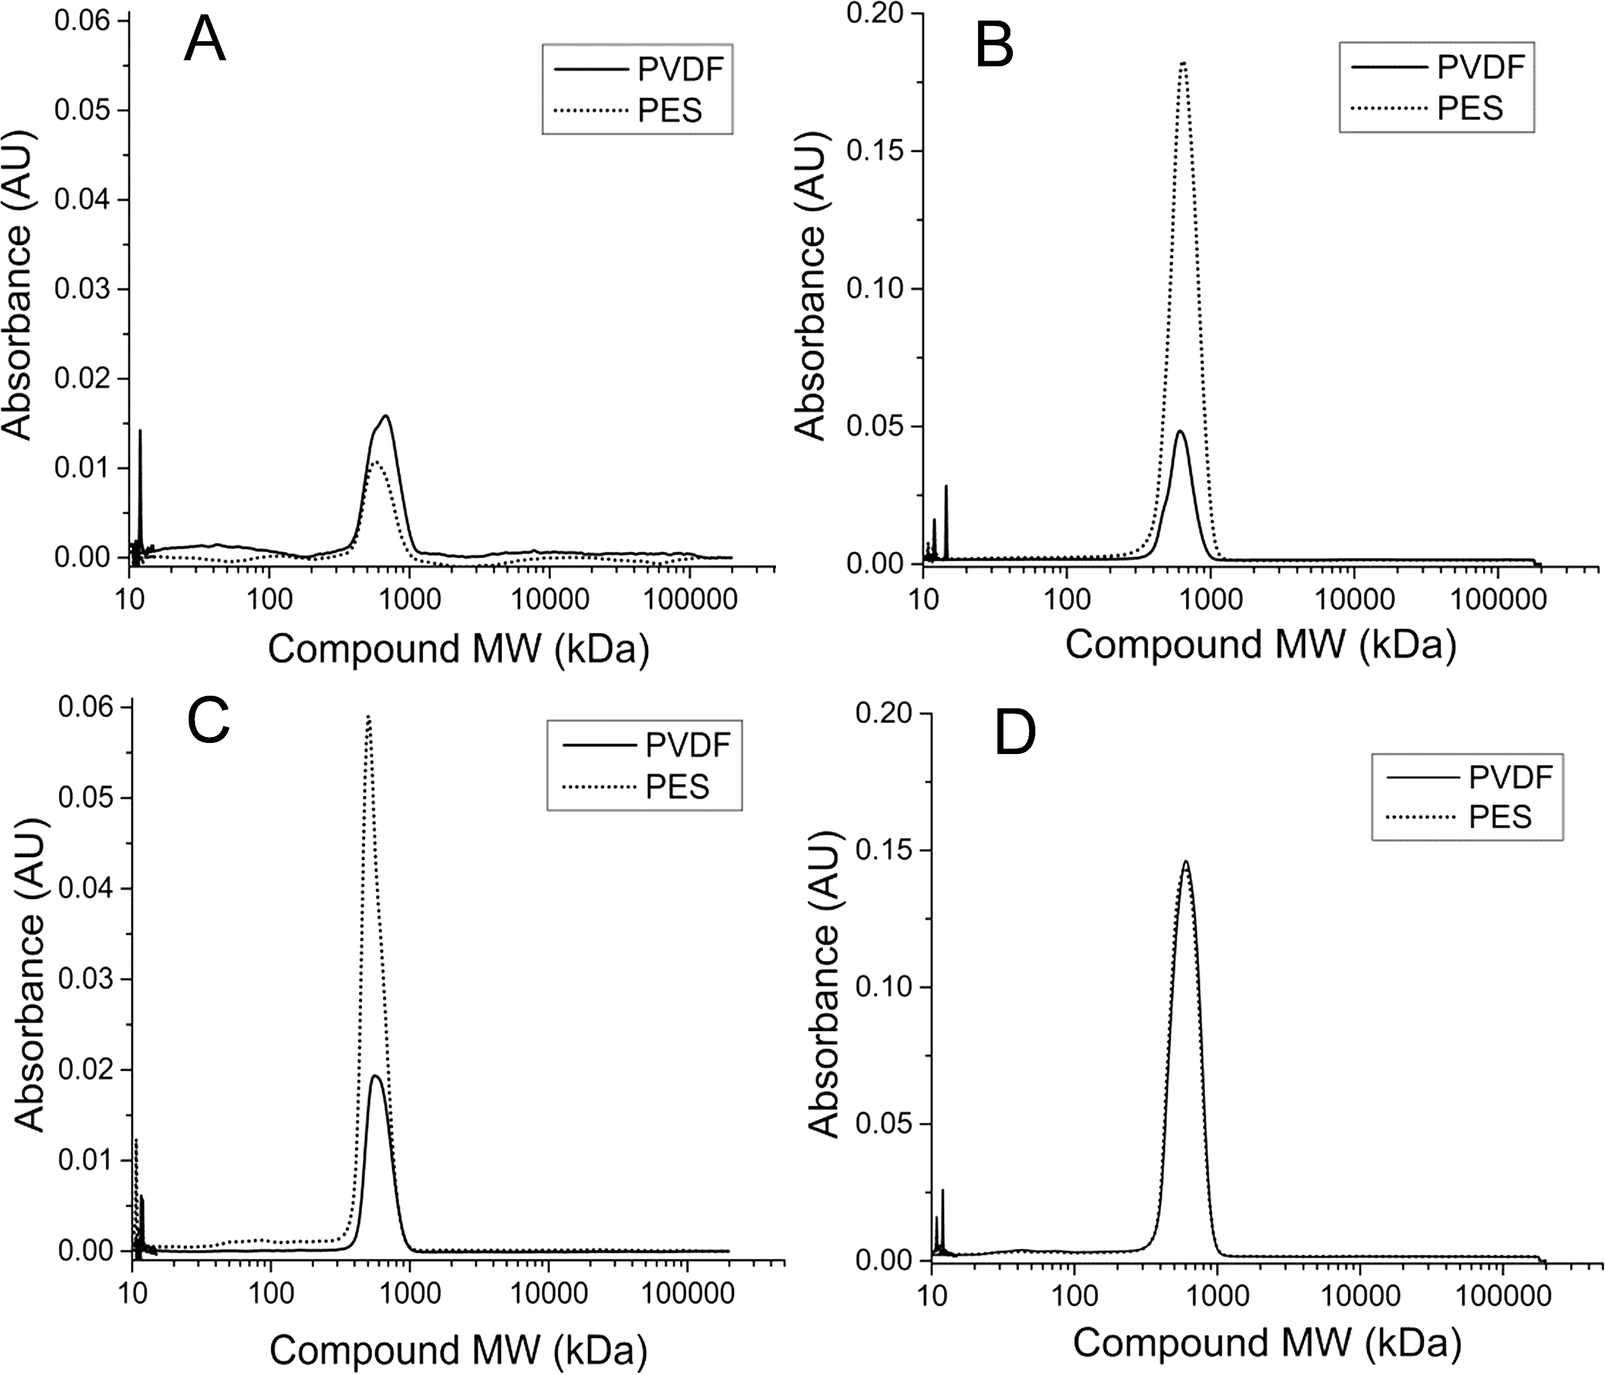 | ||
| Fig. 7 Extracellular polymeric substance (EPS) high-performance liquid chromatography (HPLC) profiles detected at 210 nm UV absorbance for soluble EPS of both PES and PVDF membranes from (a) UA AnMBR for run 1, (b) UA AnMBR for run 2, (c) CSTR AnMBR for run 1, and (d) CSTR AnMBR for run 2. | ||
3.9. Membrane characterization
Both the PVDF MF and the PES MF membranes were characterized based on a range of parameters including hydrophobicity, surface charge, and surface roughness (ESI,† Table S2). The PVDF membrane had higher root mean square (rms) surface roughness values as determined by AFM membrane images for both 3 μm × 3 μm and 30 μm × 30 μm surface areas. Hydrophobicity was higher for the PVDF membrane as determined by surface drop tests that achieved average contact angles of 77° and 32° for the PVDF and PES membranes, respectively. Finally, the surface charge of the PVDF membrane was determined to be slightly negative (−18 mV) while the surface charge of the PES membrane was determined to be slightly positive (+19 mV) at pH 7 based on streaming zeta potential tests.4. Discussion
Despite differences in specific microbial populations related to fermentative bacteria, syntrophs and methanogens (Table 2), both the attached growth (UA) AnMBR and suspended growth (CSTR) AnMBR achieved a similar range of 90–96% COD removal. This reiterates the findings of a recent study that also observed similar effluent quality between granular and suspended growth AnMBRs.15 Captured methane volumes were 23–33% lower than the maximum theoretically achievable (Table 1), but were in a similar range (234–269 mL g−1 COD) to other studies that evaluated the potential for methane production under similar organic loading rates.5,40,41 The saturation solubility of methane in water is 16 mL L−1 at 35 °C and 1 atm.42 Measurement of methane content trapped in the liquid phase revealed that it contained levels exceeding those of its maximum solubility in water (i.e. super-saturation) by nearly double, implying that a large fraction (18–21%) of the total recoverable methane was lost in the effluent. A previous study aimed at quantifying methane recovery efficiency in an AnMBR showed that super-saturation of methane in the effluent caused by mass transfer limitations was, indeed, responsible for losses of up to 25% under similar operating conditions.7The CSTR consistently achieved higher methane content in the total biogas and produced a significantly higher daily methane yield compared to the UA AnMBR. The mass transfer limitations that were responsible for considerable methane losses in the AnMBR effluents were likely also affected by differences in the operational conditions of the CSTR as compared to the UA reactor. Given that the CSTR was operated under constant internal mixing conditions while the UA was not, it seems reasonable that slightly better transfer rates of methane from the CSTR sludge to the biogas could have accounted for the higher biogas and methane yields seen in the CSTR. Furthermore, in most cases studied for anaerobic digestion, hydrolysis and fermentation were determined to be rate-limiting steps.43 The dominance of up to 30.5% of the total microbial community within the CSTR sludge by three OTUs most closely related to the fermentative bacteria Microbacter margulisiae (run 1), Lutispora thermophila (run 1), and Prolixibacter bellariivorans (run 2) (Table 2B) suggests that the CSTR AnMBR in this study was likely able to overcome the hydrolysis and/or fermentation digestion steps more efficiently than the UA AnMBR system, possibly leading to higher overall methane yields. Although the specific fermentative bacterial species changed between runs 1 and 2, their prominence in the CSTR sludge and overall role in the anaerobic digestion process as fermenters remained consistent. During the time period between the end of run 1 and the commencement of run 2, both reactors were operated in batch mode, which could have led to these changes.
Another possible explanation for the lower methane production by the UA could be related to hydrogen- and/or acetate-utilizing bacteria competing with methanogens in the UA biomass. For example, an OTU closest related to Geobacter lovleyi was present at a higher relative abundance in the UA in both runs 1 and 2 (UA/CSTR ratio = 12.9, unpaired t-test, P = 0.036). Geobacter lovleyi is able to utilize both hydrogen and acetate under anaerobic conditions and could decrease the amount of both substrates that are taken up by the hydrogenotrophic and acetoclastic methanogens.44 This, in turn, would result in lower methane and higher carbon dioxide content within the biogas.
Other significant differences in the microbial populations of the UA and CSTR AnMBRs were also observed, specifically those associated with the attached and suspended biomass. Our findings have shown that methanogens and archaea in general have a more dominant presence in the attached biomass as compared to suspended sludge (average RA ratio = 8.44, unpaired t-test, P < 0.001), along with syntrophs and sulfate-reducing bacteria. The inherently longer sludge age of the attached biomass likely favors these microbial groups as compared to other bacteria due to their relatively slower growth rates.25
Different environmental conditions are likely to persist in attached biofilms due to the vertical gradient of substrates that may also drive niche differentiation of archaea or syntrophs over others, in turn providing these bacterial populations with a competitive edge than in the suspended form under lower substrate concentrations. To illustrate, an OTU identified as propionate-degrading bacterium Smithella propionica had a significantly higher RA in the UA AnMBR as compared to the CSTR AnMBR (Table 2A).46Methanospirillum stamsii is a methanogen known to grow in a syntrophic propionate-oxidizing anaerobic consortium.47 The relative abundance of this species showed significant correlation with the relative abundance of S. propionica (Spearman's rank correlation ρ = 0.53, P = 0.034). Although S. propionica produces acetate that could be utilized by acetoclastic methanogens, the relative abundance of S. propionica did not exhibit a significant correlation with Methanosaeta concilii (Spearman's rank correlation ρ = 0.35, P = 0.19), suggesting that the transfer of hydrogen was the more mutualistic interaction when compared to the transfer of acetate to acetoclastic methanogens. Hence, attachment or aggregation facilitates the interspecies transfer of electrons, hydrogen and/or formate, which is a key requirement in obligate syntrophic interactions,45 and is potentially responsible for the higher abundances of methanogens and syntrophs in the attached biomass.
The transfer of hydrogen to methanogens can, however, be limited by diffusion when sulfate-reducing bacteria are present in the attached biomass. It has been previously shown that the transfer of electron carriers between cells is only limited by diffusion rates when cells are within 2–3 μm of each other (i.e. aggregated biomass), while H2-producing and/or utilizing microbes do not affect inter-cell transfer rates when at distances >10 μm (i.e. suspended biomass) except in their contribution to the bulk solution.48 With this in mind, the presence of Desulfovibrio at significantly higher relative abundances in the attached biomass (Table 3) likely created less favorable conditions for hydrogenotrophic methanogens in the attached biomass than in the suspension.
The majority of archaea in the CSTR AnMBR were composed of hydrogenotrophic methanogens, specifically Methanobacterium formicicum, reaching up to 80% of the total archaeal community. Hydrogenotrophic methanogenesis has been previously identified as the dominant methane-producing pathway in anaerobic digesters.49 As such, the higher abundance of hydrogenotrophic methanogens as compared to their acetoclastic counterparts may have contributed to higher carbon dioxide utilization and ultimately higher methane production by the CSTR AnMBR. It was observed in a previous study that increases in shear rates within an AnMBR coincided with increases in the hydrogenotrophic methanogenic population of the reactor.41 This is consistent with our findings of hydrogenotrophic methanogen dominance in the CSTR, as shear rates in the CSTR were likely inherently higher compared to the UA reactor given that recirculation rates in the two reactors were the same, but the CSTR was also rigorously internally mixed by an impeller.
Existing research has shown that high molecular weight compounds can dominate proteinaceous EPS and SMPs in MBRs.14,50 Furthermore, a previous study comparing reactor configurations of AnMBRs found that there were significant differences in SMP molecular weight fractionation between suspended growth and granular AnMBRs.15 Our findings suggest that differences in the bacterial populations between reactor configurations have also likely accounted for differences in the SMP constituents of CSTR and UA retentates (Fig. 5). Major differences in total membrane resistance were observed between run 1 and run 2 for the PES membrane in the CSTR. This was likely due to differences in the proteinaceous SMP characteristics, as they varied more in the CSTR as compared to the UA reactor. To illustrate, a peak representing a 100 kDa protein-like compound was only present in select samples of retentate and permeate from the CSTR in run 1 (Fig. 6). The timing of this peak's presence coincided with increases in total resistance in the CSTR PES membrane at days 15 and 36 of run 1. This compound may have played a role in membrane fouling by pore adsorption and accumulation given its relatively small molecular weight compared to the membrane pore size. Conversely, this peak was not detected in CSTR SMP samples from run 2 or in any UA SMP samples, even though the UA PES membrane in run 2 also experienced premature increases in total resistance.
Previous research suggests that membrane performance in MBRs is negatively affected by the concentration of colloidal matter in reactor suspension and, as a result, favors attached growth type AnMBR systems.13,15 Our results showed that despite differences in the SMP constituents, membrane fouling was minimal for both reactors when the transmembrane fluxes were maintained below 8 L m−2 h−1, with the exception of the CSTR PES membrane in run 1 and, to a lesser degree, the UA PES membrane in run 2. Proteins and carbohydrates, which have been previously found to influence fouling and adversely impact membrane performance,21,51,52 were higher in CSTR PES membrane biofilms than in corresponding PVDF biofilms. Most of the characterized membrane properties showed no significant difference between virgin PES and PVDF membranes (Table S1†). However, the PES membrane used in this study exhibited a slightly positive zeta potential, which may have resulted in an enhanced affinity for the negatively charged microbial cells. In a study by Gao et al., different membrane types (i.e., polyether block amide-coated PVDF and uncoated polyetherimide) were tested and their findings revealed that uncoated polyetherimide had a greater surface affinity for Bacteroidetes.21 This, in turn, led to a predominantly proteinaceous EPS layer and a faster fouling rate than the coated PVDF membranes. This observation coincided with our findings that both the fouled PES membrane of the CSTR for run 1 and the fouled PES membrane of the UA for run 2 had 3-fold or greater increases in peak height for a 600 kDa protein fragment detected on HPLC as compared to PVDF membranes in those same runs (Fig. 7).
Normalized total average protein and carbohydrate contents were higher for CSTR PES membranes in both runs 1 and 2 (Fig. 4) even though the PES membrane in the CSTR during run 2 did not exhibit the same fouling rates as in run 1. Additionally, the lower average protein and carbohydrate content seen in PES biofilms in the UA AnMBR suggests that reactor configuration might also play a role in EPS affinity for a specific membrane type. In future studies, it would be useful to isolate and identify the observed peaks representing the 600 kDa (EPS and SMPs) and 100 kDa (SMPs) compounds in the HPLC profiles in order to determine if a link can be established between those compounds and the bacteria present in the reactor sludge and membrane biofilms.
Considering that the treatment efficiencies of both reactors were consistently similar in terms of COD removal rates, the main performance characteristics potentially affected by reactor type are methane production capacity and biofouling rates. Both of these parameters directly impact process efficiency and sustainability, which are the primary obstacles limiting the application of AnMBRs for municipal wastewater treatment. Through the use of molecular tools, the links between fundamental microbiology and the performance of these systems were examined, providing insights useful for future design and operation considerations.
5. Conclusion
Several different types of conventional anaerobic digesters have been studied for their microbial communities and performance, but these studies offer limited insight to answer critical questions in the context of emerging membrane-based mainline anaerobic treatment systems. In particular, the impact of AnMBR reactor type on the microbial community as well as broader links to methane production, SMPs, and membrane fouling is a critical area of research to advance goals for energy positive wastewater management. This study evaluated two AnMBR types that are inherently different in their biological growth conditions, demonstrating reproducible differences among their microbial community structure while relating these differences to reactor performance.Microbial community analysis shows that methanogens, syntrophs, and fermentative and sulfate-reducing bacteria are all significantly affected by differences in AnMBR configuration. Results suggest that these differences can lead to variations in biogas production and microbe-produced foulant compositions, both of which are integral to the sustainability of AnMBR application to municipal wastewater. Furthermore, although membrane characteristics appear to have an impact on biofilm formation, reactor stability and microbial foulant composition may contribute more directly to membrane fouling. These findings illustrate the importance of understanding microbial community interactions when evaluating AnMBRs in future research for wastewater treatment applications.
Acknowledgements
The authors would like to thank Dr. Chun-Hai Wei for providing the seed sludge for both AnMBR reactors and Dr. Yuejian Mao for providing the Perl script used for OTU sequence analysis. This study was partially funded by the KAUST Academic Partnership Program grant (PID 7000000105) and by the KAUST Center Competitive Funding Program grant (FCC/1/1971-06-01) awarded to P.-Y. Hong.References
- A. Haandel, M. T. Kato, P. F. F. Cavalcanti and L. Florencio, Rev. Environ. Sci. Bio/Technol., 2006, 5, 21–38 CrossRef.
- A. L. Smith, L. B. Stadler, N. G. Love, S. J. Skerlos and L. Raskin, Bioresour. Technol., 2012, 122, 149–159 CrossRef CAS PubMed.
- D. C. Stuckey, Bioresour. Technol., 2012, 122, 137–148 CrossRef CAS PubMed.
- H. Lin, W. Peng, M. Zhang, J. Chen, H. Hong and Y. Zhang, Desalination, 2013, 314, 169–188 CrossRef CAS PubMed.
- C.-H. Wei, M. Harb, G. Amy, P.-Y. Hong and T. Leiknes, Bioresour. Technol., 2014, 166, 326–334 CrossRef CAS PubMed.
- A. Smith, S. Skerlos and L. Raskin, Environ. Sci.: Water Res. Technol., 2015, 1, 56–64 CAS.
- J. Giménez, N. Martí, J. Ferrer and A. Seco, Bioresour. Technol., 2012, 118, 67–72 CrossRef PubMed.
- A. L. Smith, L. B. Stadler, L. Cao, N. G. Love, L. Raskin and S. J. Skerlos, Environ. Sci. Technol., 2014, 48, 5972–5981 CrossRef CAS PubMed.
- B. Shoener, I. Bradley, R. Cusick and J. Guest, Environ. Sci.: Processes Impacts, 2014, 16, 1204–1222 CAS.
- H. Ozgun, R. K. Dereli, M. E. Ersahin, C. Kinaci, H. Spanjers and J. B. van Lier, Sep. Purif. Technol., 2013, 118, 89–104 CrossRef CAS PubMed.
- Y. An, F. Yang, B. Bucciali and F. Wong, J. Environ. Eng., 2009, 135, 86–91 CrossRef CAS.
- P. R. Bérubé, E. R. Hall and P. M. Sutton, Water Environ. Res., 2006, 78, 887–896 CrossRef.
- E. van Voorthuizen, A. Zwijnenburg, W. van der Meer and H. Temmink, Water Res., 2008, 42, 4334–4340 CrossRef CAS PubMed.
- I. Martin-Garcia, V. Monsalvo, M. Pidou, P. Le-Clech, S. Judd, E. McAdam and B. Jefferson, J. Membr. Sci., 2011, 382, 41–49 CrossRef CAS PubMed.
- I. Martin-Garcia, M. Mokosch, A. Soares, M. Pidou and B. Jefferson, Water Res., 2013, 47, 4853–4860 CrossRef CAS PubMed.
- J. R. Pan, Y. Su and C. Huang, Desalination, 2010, 250, 778–780 CrossRef CAS PubMed.
- J. Zhang, S. Padmasiri, M. Fitch, B. Norddahl, L. Raskin and E. Morgenroth, Desalination, 2007, 207, 153–166 CrossRef CAS PubMed.
- A. Charfi, N. Ben Amar and J. Harmand, Water Res., 2012, 46, 2637–2650 CrossRef CAS PubMed.
- M. L. Salazar-Peláez, J. M. Morgan-Sagastume and A. Noyola, Desalination, 2011, 277, 164–170 CrossRef PubMed.
- K. Calderón, B. Rodelas, N. Cabirol, J. González-López and A. Noyola, Bioresour. Technol., 2011, 102, 4618–4627 CrossRef PubMed.
- D.-W. Gao, T. Zhang, C.-Y. Y. Tang, W.-M. Wu, C.-Y. Wong, Y. H. Lee, D. H. Yeh and C. S. Criddle, J. Membr. Sci., 2010, 364, 331–338 CrossRef CAS PubMed.
- A. L. Smith, S. J. Skerlos and L. Raskin, Water Res., 2013, 47, 1655–1665 CrossRef CAS PubMed.
- I. Nopens, C. Capalozza and P. A. Vanrolleghem, Department of Applied Mathematics Biometrics and Process Control, University of Gent, Belgium, 2001 Search PubMed.
- APHA, AWWA and WEF, Standard Method for the Examination of Water and Wastewater, American Water Works Association, 2012 Search PubMed.
- B. E. Rittmann and P. L. McCarty, Environmental biotechnology: principles and applications, Tata McGraw-Hill Education, 2012 Search PubMed.
- P.-Y. Hong, E. Wheeler, I. K. Cann and R. I. Mackie, ISME J., 2011, 5, 1461–1470 CrossRef PubMed.
- N. Al-Jassim, M. I. Ansari, M. Harb and P.-Y. Hong, Water Res., 2015, 73, 277–290 CrossRef CAS PubMed.
- R. C. Edgar, B. J. Haas, J. C. Clemente, C. Quince and R. Knight, Bioinformatics, 2011, 27, 2194–2200 CrossRef CAS PubMed.
- Q. Wang, G. M. Garrity, J. M. Tiedje and J. R. Cole, Appl. Environ. Microbiol., 2007, 73, 5261–5267 CrossRef CAS PubMed.
- K. Clarke and R. Gorley, PRIMER-E, Plymouth, UK, 2006, p. 192 Search PubMed.
- K. R. Clarke, Aust. J. Ecol., 1993, 18, 117–143 CrossRef PubMed.
- W. Li and A. Godzik, Bioinformatics, 2006, 22, 1658–1659 CrossRef CAS PubMed.
- M. Dubios, K. A. Gilles, J. K. Hamilton, P. A. Rebers and F. Smith, Anal. Chem., 1956, 28, 350–356 CrossRef.
- O. H. Lowry, N. J. Rosebrough and R. J. Randall, J. Biol. Chem., 1951, 193, 265–275 CAS.
- S. Simon, B. Païro, M. Villain, P. D'Abzac, E. V. Hullebusch, P. Lens and G. Guibaud, Bioresour. Technol., 2009, 100, 6258–6268 CrossRef CAS PubMed.
- A. Aitken and M. Learmonth, in The protein protocols handbook, Springer, 1996, pp. 3–6 Search PubMed.
- N. Her, G. Amy, J. Sohn and U. V. Gunten, J. Water Supply: Res. Technol.--AQUA, 2008, 57, 35–44 CrossRef CAS.
- W. Chen, P. Westerhoff, J. A. Leenheer and K. Booksh, Environ. Sci. Technol., 2003, 37, 5701–5710 CrossRef CAS.
- A. E. Childress and M. Elimelech, J. Membr. Sci., 1996, 119, 253–268 CrossRef CAS.
- D. Martinez-Sosa, B. Helmreich, T. Netter, S. Paris, F. Bischof and H. Horn, Bioresour. Technol., 2011, 102, 10377–10385 CrossRef CAS PubMed.
- S. I. Padmasiri, J. Zhang, M. Fitch, B. Norddahl, E. Morgenroth and L. Raskin, Water Res., 2007, 41, 134–144 CrossRef CAS PubMed.
- D. W. Green, Perry's chemical engineers' handbook, McGraw-hill New York, 2008 Search PubMed.
- S. Pavlostathis and E. Giraldo-Gomez, Water Sci. Technol., 1991, 24, 35–59 CAS.
- Y. Sung, K. E. Fletcher, K. M. Ritalahti, R. P. Apkarian, N. Ramos-Hernández, R. A. Sanford, N. M. Mesbah and F. E. Löffler, Appl. Environ. Microbiol., 2006, 72, 2775–2782 CrossRef CAS PubMed.
- Z. M. Summers, H. E. Fogarty, C. Leang, A. E. Franks, N. S. Malvankar and D. R. Lovley, Science, 2010, 330, 1413–1415 CrossRef CAS PubMed.
- Y. Liu, D. L. Balkwill, H. C. Aldrich, G. R. Drake and D. R. Boone, Int. J. Syst. Bacteriol., 1999, 49, 545–556 CrossRef CAS.
- S. N. Parshina, A. V. Ermakova, M. Bomberg and E. N. Detkova, Int. J. Syst. Evol. Microbiol., 2014, 64, 180–186 CrossRef CAS PubMed.
- D. R. Boone, R. L. Johnson and Y. Liu, Appl. Environ. Microbiol., 1989, 55, 1735–1741 CAS.
- J. R. Town, M. G. Links, T. A. Fonstad and T. J. Dumonceaux, Bioresour. Technol., 2014, 151, 249–257 CrossRef CAS PubMed.
- S. Malamis and A. Andreadakis, Bioresour. Technol., 2009, 100, 3350–3357 CrossRef CAS PubMed.
- S. Rosenberger, C. Laabs, B. Lesjean, R. Gnirss, G. Amy, M. Jekel and J.-C. Schrotter, Water Res., 2006, 40, 710–720 CrossRef CAS PubMed.
- A. C. Fonseca, R. S. Summers, A. R. Greenberg and M. T. Hernandez, Environ. Sci. Technol., 2007, 41, 2491–2497 CrossRef CAS.
Footnotes |
| † Electronic supplementary information (ESI) available. See DOI: 10.1039/c5ew00162e |
| ‡ Equal contributing authors. |
| This journal is © The Royal Society of Chemistry 2015 |