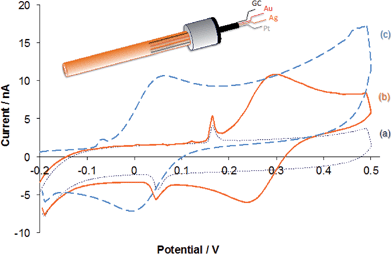
Propofol detection and quantification in human blood: the promise of feedback controlled, closed-loop anesthesia†
Francine
Kivlehan
a,
Edward
Chaum
b and
Ernő
Lindner
*a
aDepartment of Biomedical Engineering, University of Memphis, Memphis, Tennessee 38152, USA. E-mail: elindner@memphis.edu
bDepartments of Ophthalmology and Biomedical Engineering, University of Tennessee Health Science Center, Memphis, Tennessee 38152, USA
First published on 13th October 2014
Abstract
The performance of a membrane-coated voltammetric sensor for propofol (2,6-diisopropylphenol) has been characterized in long term monitoring experiments using an automated flow analytical system (AFAS) and by analyzing human serum and whole blood samples by standard addition. It is shown that the signal of the membrane-coated electrochemical sensor for propofol is not influenced by the components of the pharmaceutical formulation of propofol (propofol injectable emulsion). The current values recorded with the electrochemical propofol sensor in buffer solutions and human serum samples spiked with propofol injectable emulsion showed excellent correlation with the peak heights recorded with an UV-Vis detector during the HPLC analysis of these samples (R2 = 0.997 in PBS and R2 = 0.975 in human serum). However, the determination of propofol using the electrochemical method is simpler, faster and has a better detection limit (0.08 ± 0.05 μM) than the HPLC method (0.4 ± 0.2 μM). As a first step towards feedback controlled closed-loop anesthesia, the membrane-coated electrochemical sensor has been implemented onto surface of an intravenous catheter. The response characteristics of the membrane-coated carbon fiber electrode on the catheter surface were very similar to those seen using a macroelectrode.
1. Introduction
Propofol (2,6-diisopropylphenol) is the most commonly used intravenous drug in surgical and critical care settings worldwide for the purpose of general anesthesia and conscious sedation.1 The Society of Critical Care Medicine has recommend the use of propofol over benzodiazepine derivatives for ICU sedation.2 The popularity of propofol is related to the rapid induction and elapse of anesthesia and its proven safety profile with appropriate use. Indeed, propofol is delivered in a semi-automated fashion outside of North America using the method of target controlled infusion anesthesia (TCIA), which targets the blood concentration in patients using algorithms based on established pharmacokinetic and pharmacodynamics models of the drug. To replace targeted control with actual, measurement-based closed-loop control during anesthesia, the concentration of propofol has to be monitored with adequate precision and accuracy. However, the measurement of propofol levels in real-time and correlating blood or exhaled breath propofol levels3–8 with efficacy data is challenging. Previously, the bispectral (BIS) index, a processed electroencephalogram (EEG) parameter, has been used to quantify sedation during closed-loop administration of propofol as a proxy for the drug concentration.9 Although the measured (cm) and targeted (ct) concentrations in blood are generally closely correlated, significant differences have been reported between cm and ct values due to differences in the pharmacokinetics due to gender and age.10,11More recently there has been increasing interest in the clinical application of propofol detection methods. Determination of propofol in blood using microfluidic biochips with optical detection has been described12 and a colorimetric sensor has also been designed.13–15 These measuring systems utilize a sample preparation stage, which includes the lysis of red blood cells and solid phase extraction (SPE) before analysis. However, the determination of propofol in biological samples is still most commonly performed using HPLC analysis in combination with a variety of detectors,5,16–19e.g., Plummer et al. achieved 2 ng mL−1 (∼11.2 nM) detection limit in blood using HPLC in combination with fluorescence detection.20 Propofol metabolites have also been measured in urine.21
Our group has shown that the voltammetric determination of propofol is possible in complex biological solutions using an organic film (plasticized PVC membrane) coated working electrode. Propofol can be oxidized electrochemically,22 which permitted the development of voltammetric methods for its quantitative assessment.18 However, due to serious electrode fouling and lack of selectivity these methods were inadequate for the measurement of propofol in whole blood. Coating the working electrode surface with an organic film prevented electrode fouling,23,24 minimized the influence of interfering compounds on the propofol signal and improved the detection limit. With the organic film coated sensor 30 nM detection limit was achieved23 both in aqueous standard solutions and serum samples. The excellent selectivity and impressive detection limit of the membrane-coated sensor is due to the high lipophilicity of propofol.25 As the organic film-coated working electrode is immersed into a sample solution, propofol selectively partitions into the highly plasticized PVC membrane coating where it is oxidized. Importantly, we have also shown that the most common clinical interfering compounds that can be also oxidized, such as ascorbic acid (AA) and p-acetamido phenol (p-AAP, Tylenol), are hydrophilic and therefore do not partition into the organic membrane sufficiently to interfere with the detection of propofol.
Based on its in vitro performance characteristic we evaluated the possibility of using the membrane-coated propofol sensor for monitoring and feedback controlled administration of propofol levels during anesthesia. As a first alternative we considered automated sampling and analysis of blood using an automated flow analytical system (AFAS). The AFAS developed for the task could be used both in continuous flow analysis (CFA) and flow injection analysis (FIA) modes24,26 for the real-time detection of propofol in aqueous standard solutions and human serum samples in the concentration range between 1 μM and 60 μM.24 In this paper we evaluated the possibility of using a propofol sensor on the outer surface of an indwelling catheter which could be used to measure the propofol levels in vivo and modulate the delivery of the drug by TCIA systems, thus “closing the loop” to yield fully automated anesthesia delivery platforms or total intravenous anesthesia (TIVA). Since the propofol sensor signal, besides other parameters (the partition and diffusion coefficient of propofol), is a function of the thickness of the organic film (δm) on the working electrode surface, in this paper we report quantitative data on the correlation between the sensor signal and the thickness of the membrane coatings. In addition, we describe results on the quantitative assessment of propofol in human serum and whole blood samples spiked with propofol standards and propofol injectable emulsion, the pharmaceutical formulation of propofol used for patient care. The performance of the electrochemical method has been validated by HPLC, indicating the feasibility of real-time monitoring and in vivo analysis of propofol during surgery and long-term sedation of patients.
2. Experimental
2.1 Reagents
2,6-Diisopropylphenol (propofol, analytical grade) was purchased from Sigma Aldrich (St. Louis, MO) and prepared as a 10 mM stock solution in 0.1 M NaOH. This solution was diluted to a 1 mM secondary stock solution in phosphate buffer saline (PBS) for use in experiments. Ferrocene methanol (FcMeOH), from Sigma Aldrich, was used to characterize the voltammetric working electrodes (e.g., determine the electrochemical surface area) with and without membrane coating. The PBS buffer (pH ∼ 7.2) was prepared as a mixture of 0.1 M KH2PO4, 0.1 M K2HPO4, 0.1 M KCl and 0.035 M NaOH. All other reagents used in this study were purchased commercially from Sigma Aldrich or Fisher Scientific and were of ACS grade, unless stated otherwise. The aqueous solutions were prepared with water purified by a Milli-Q Gradient A10 System (Millipore Corp., Billerica, MA). The propofol injectable emulsion was the commercial product of Baxter Healthcare Corporation. Human serum (HS) and whole blood samples were purchased from Bioreclamation LLC (Westbury, NY). Bovine serum albumin (BSA) was purchased as a lyophilized powder from Sigma Aldrich, and prepared in PBS as a 5% (w/v) solution.PVC membrane solutions were generally prepared in 250 mg quantities, consisting of ∼25 wt% PVC, ∼50 wt% plasticizer, ∼22 wt% organic electrolyte and ∼3 wt% ion-exchange salt. This mixture was dissolved in 2.5 mL tetrahydrofuran (THF). The PVC (high molecular weight), and plasticizer bis(2-ethylhexyl)sebacate (DOS) were selectophore grade. The organic electrolyte, tetradodecylammonium tetrakis(pentafluorophenyl)borate (TDDATPFPhB) was prepared by metathesis reaction between tetradodecylammonium chloride (TDDACl) and high purity potassium tetrakis(pentafluorophenyl)borate (KTPFPhB) (Boulder Scientific Company, Longmont, CO) in dichloromethane. The inorganic contaminants were removed from the organic electrolyte by repeated liquid phase extraction using de-ionized (DI) water. Sodium tetrakis[3,5-bis(trifluoromethyl)phenyl]borate (NaTFPB) (Dojindo Laboratories Gaithersburg, MD, USA) served as the ion-exchange salt in the membrane.
2.2 Instrumentation & analytical methods
For monitoring propofol levels in flowing solutions the electrochemical flow-cell (MW-5052) from Bioanalytical Systems was used (BASi, West Lafayette, IN) in combination with a home-made Automated Flow Analytical System (AFAS). The AFAS managed the sampling, the sample transport, the electrochemical measurement and data acquisition through a LabView-based software developed in our laboratory. Details of the operational setup of the AFAS have been described in a previous publication.24 With the AFAS, cyclic voltammetry (CV) and chronoamperometry (CA) experiments were performed both in continuous flow and stopped flow modes. The flow system consists of a sampling valve, KOT mixing coil (Biotech, Onsala, Sweden), electrochemical flow-cell, and peristaltic pump. For sampling a 6-position distribution (6-PD) valve was used in combination with a modular valve positioner (MVP) (Hamilton, Reno, NV) and a MINIPULS 3 peristaltic pump (Gilson Inc. Middleton, WI). The working, reference and counter electrodes included within the electrochemical flow-cell were connected to a CV-27 BASi potentiostat/PA-1 pre-amplifier system (BASi, West Lafayette, IN). In the BASi flow-cell, a Ag|AgCl|3.0 M NaCl (BASi, West Lafayette, IN) was used as the reference electrode, while the stainless steal housing of the thin layer BASi flow cell served as the counter electrode. In the thin-layer flow-cell a 0.002′′ (5.08 × 10⁻² mm) thick Teflon gasket served as space holder for the gap between the membrane-coated glassy carbon (GC) working electrode and the stainless steel counter electrode unit. The one-directional “cross-flow” pattern across the working electrode surface was defined by the auxiliary electrode design.In batch experiments, CV and CA measurements were performed in a 3-electrode cell, using a CH Instruments model 900 potentiostat (CH Instruments Inc., Austin, TX). For these measurements, Ag|AgCl|3.0 M KCl (CH Instruments) and a platinum wire served as the reference and counter electrodes, respectively.
For HPLC analysis a Varian ProStar liquid chromatograph comprising of a Model 240 solvent delivery system, Model 335 diode array detector, and a Model 410 HPLC autosampler (Agilent Technologies, Santa Clara, CA) was used in conjunction with the Galaxie software. In our experiments a C8 reversed phase column served as the stationary phase. The mobile phase was composed of 80.4% v/v methanol (HPLC grade, FisherBrand) and 19.6% v/v aqueous 0.05% NH4OH (FisherBrand). UV-Vis measurements were recorded at a wavelength of 270 nm, with a retention time of ∼3.5 minutes. A 50 μL injection loop was used for sampling.
2.3 Preparation of membrane-coated electrodes
To perform experiments in the BASi MW-5052 thin layer flow cell the MF-1000 glassy carbon (GC) dual working electrode of the flow cell was spin-coated with a plasticized PVC membrane. Before spin-coating the electrode block was polished (0.3 and 0.05 μm alumina slurry), rinsed and sonicated in DI water, and dried. Next, it was placed onto the vacuum chuck of a spinner and between 200 and 400 μL of PVC membrane solution was deposited onto the surface. Then the electrode block on the spinner was rotated for 20 seconds at spin rates ranging between 944 rpm and 1680 rpm.24 The membrane-coated electrode was finally left in a contained environment for up to 24 hours to allow for complete evaporation of THF.To spin-coat the MF-2012 glassy carbon (GC) working electrodes used in the batch experiments the electrode was first polished (0.3 and 0.05 μm alumina slurry), rinsed and sonicated in DI water, and dried. Next, the electrode was dipped into a PVC membrane solution, clamped into the head of a drill press and rotated for 20 seconds at 1100 rpm. Following its spin-coating, the electrode was left in an up-right position in a contained environment for up to 24 hours to allow for complete evaporation of THF. To determine the thickness and uniformity of the membrane films over the sensor surface as well as the reproducibility of the depositions, a KLA-Tencor, Alfa-Step 500 (San Jose CA, USA) surface profiler was used.
2.4 Implementation of electrochemical sensors onto the surface of an intravenous catheter
A set of custom-made catheters were designed by us and fabricated by Interplex Medical (Interplex Medical, Milford, OH) to test the feasibility of in vivo monitoring of propofol with membrane-coated micro-fiber electrodes attached to the outer surface of these catheters. Four electrical contacts were built into the threaded catheter head, which were wired to the carbon, platinum, gold and silver fiber electrodes secured onto the external surface of the dispensing tube of the catheter. In this study Specialty Materials (Lowell, MA) glassy carbon (GC) fiber (34.5 ± 2.5 μm diameter) and gold (Au) fiber (51 μm diameter) electrodes were used as working electrodes while the 203 μm diameter, PFA coated, silver wire electrode was used as reference electrode, and the 127 μm diameter platinum wire electrode served as counter electrode. The Au, Ag, and Pt wire electrodes were purchased from A-M systems (Carlsborg, WA). To connect the individual electrodes to the potentiostat through the threaded head of the catheter a special screw cap connector was designed with spring loaded spin connectors. For coating the micro-fiber electrodes with the PVC film a 10-fold diluted membrane solution was used and approximately ∼25 μL of this diluted membrane solution was drop-cast over the surface of the catheter in the area of the 4 wire electrodes. The dilution factor and the deposited amount of the membrane solution were determined empirically based on the transient response of the sensors to a step change in the propofol concentration.3. Results & discussion
3.1 Characterization of membrane coating by profilometry
The extraction properties of the membrane coating of the propofol sensor determine its selectivity and detection limit. The thickness of the membrane coating controls the response time and the sensitivity of the sensor. For these studies glass cover slips, similar in size to the MF-1000 dual GC working electrode block in the BASi flow through electrochemical cell, were spin-coated with PVC membranes consisting of plasticizer and PVC in a 2![[thin space (1/6-em)]](https://www.rsc.org/images/entities/char_2009.gif) :
:![[thin space (1/6-em)]](https://www.rsc.org/images/entities/char_2009.gif) 1 ratio (dummy membranes). Next, half of the membrane coatings were peeled off from the glass substrates along a bisecting central lines and profilometric scans were made along parallel lines across the bisecting line using KLA-Tencor surface profiler as is demonstrated in Fig. S1 in the ESI.†
1 ratio (dummy membranes). Next, half of the membrane coatings were peeled off from the glass substrates along a bisecting central lines and profilometric scans were made along parallel lines across the bisecting line using KLA-Tencor surface profiler as is demonstrated in Fig. S1 in the ESI.†
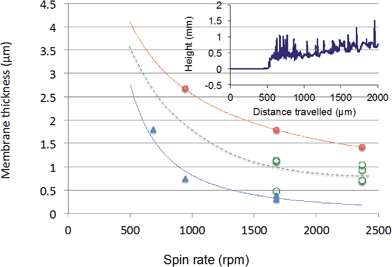
A spin rate of ∼944 rpm resulted in 0.45 ± 0.11 μm (n = 3) film thickness when 200 μL membrane solution was applied over the cover slip. However the coating was not uniform and the presence of pinholes could not be excluded. Inconsistencies in the thicknesses of the membrane coatings are believed to be the main source for the differences in the sensitivity of the propofol sensor in repeated experiments using the same electrode but with a new membrane coating each time. To find spin-coating conditions that provided uniform and reproducible thickness, we studied the influence of the spin-rate and the viscosity of the membrane solution on the thickness of the deposited membranes. At the same time the volume of the membrane solution dispensed over the surface of the cover-slip was increased from 200 μL to 400 μL. By using 400 μL membrane solution, a uniform coating with 100% surface coverage was achieved.
In Fig. 1 we show the influence of the rotation speed and the dilution of the membrane solutions on the film thickness and its reproducibility. As expected, the film thickness decreases asymptotically with the rotation speed. Similarly, more dilute membrane solutions result in thinner films. Since there are significant differences in the material and surface properties of the MF-1000 (BASi) GC working electrode block and the glass cover slips the values measured on the glass cover slips may be different from the film thicknesses deposited over the MF-1000 working electrode block, however the trends should be the same.
In our previous studies24 we showed that the 90% response time (t90) of the propofol sensor was less than 10 s with ∼1 μm thick membrane coating. As is shown in Fig. 1, a spin-rate of ∼2368 rpm provided a 0.81 ± 0.16 μm (n = 4) film thickness by using a membrane solution with 104.2 mg mL−1 concentration. The improvement in the reproducibility of the spin-coated film thickness improved the sensor-to-sensor reproducibility (using the same electrode but a fresh membrane coating in each experiment) of the propofol signal nearly proportionally.
3.2 Performance of membrane-coated sensor during continuous monitoring
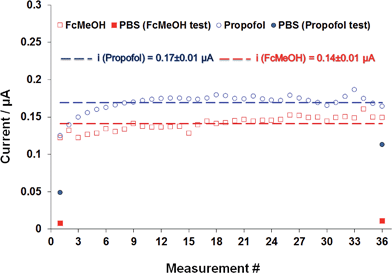
A series of experiments were performed to determine the long-term stability of the membrane-coated propofol sensor. Fig. 2 shows a representative example of these experiments in which the AFAS has been used to compare the response of the membrane-coated sensor to repeated exposure of 10 μM FcMeOH and 10 μM propofol solutions. The AFAS has been designed to perform experiments in measurement cycles. In the experiments shown in Fig. 2 the AFAS performed 36 measurement cycles using FcMeOH or propofol solutions as samples. Each cycle was 5 minutes long. The duration of the experiments was 3 hours (36 × 5 = 180 min). The 5 minute cycles consisted of 3 minutes pumping of PBS buffer and 2 minutes pumping of the analyte through the flow system. The potential was applied to the electrodes for 62 s (0.35 V for FcMeOH and or 1.2 V for propofol) at the end of the 2 minute pumping period of the analyte. The data points in Fig. 2 are average current values recorded in the last 10 seconds of the 62 s long chronoamperometric measurement periods. The flow rate in these experiments was set to 0.534 mL min−1. The working electrode was spin-coated with a new membrane before the FcMeOH as well as the propofol monitoring experiment.As seen from Fig. 2 the response for both FcMeOH and propofol is very stable. The relative standard deviations of the measured values around the mean were 6.4% and 6.8%, respectively. Repeated measurements of propofol in spiked human serum (HS) samples by FIA (injection of 175 μL HS with 6.00 μM nominal propofol concentration) had comparable relative standard deviation (7.4%, n = 36). A representative example of one FIA test is provided in Fig. S2 of the ESI.† These results demonstrate that the membrane-coated sensor has the potential to be used in continuous monitoring of propofol in clinical applications.
In Fig. 2 we also show the current measured in PBS before and after the 3 hours monitoring experiments of FcMeOH and propofol. These measurements in PBS were performed the same way as the sample measurements, i.e., 3 minutes pumping of PBS was followed by a 2 minutes pumping of PBS as analyte. The CA current measured in PBS before and following the 3 hour monitoring experiment of FcMeOH was almost identical. However, the amperometric current measured in PBS following the 3 hours monitoring experiment of propofol was much larger than before the membrane-coated sensor was exposed to propofol. It was between 35% and 66% of the current value measured in the last propofol sample. The reason for the large hysteresis in the sensor response after the continuous exposure to propofol solution with large applied potential (1.2 V) is not obvious. The significant difference in the hydrophobicity of propofol and FcMeOH is certainly one of the contributing factors. Apparently the hydrophilic FcMeOH is easily washed out of the membrane during the 3 minute washing cycles while significant amount of propofol, remained in the membrane. However, as it is shown in Fig. S2,† in FIA experiments the current decay following the injection of a propofol-containing sample was fast enough to analyze samples every five minutes. Consequently, it is assumed that there may be other factors, which influence the response time of the propofol following a decrease in the concentration. For example, it has been noted that at the end of the long duration monitoring experiments, a yellow discoloration was observed in the membrane in areas adjacent to the working electrode. At this time it is not clear whether the discoloration around the working electrode contributes to the large hysteresis in the rate of response of the membrane-coated electrode related to the buildup of propofol (or its oxidation byproduct) around the working electrode. The amount of propofol retained within the membrane is influenced by the sample concentration, the length of the polarization and the washing cycles, flow rate of the sample, and washing solutions, etc.
3.3 Correlation between electrochemical and HPLC determination of propofol in PBS and protein containing solutions
Propofol concentrations in aqueous solutions and biological samples are most commonly determined by HPLC. To demonstrate the advantages of the membrane-coated electrochemical (EC) sensor for the determination of propofol, calibration curves were recorded using HPLC and our membrane-coated sensor using aqueous standard solutions of propofol. Both calibration curves were linear up to ∼100 μM. The performance characteristics of the two methods are summarized in Table 1. The detection limit (DL) values in the table were calculated from data points recorded in the concentration range from 0 μM to 20 μM (therapeutic concentration range). The comparison of the methods was performed beyond the therapeutic concentration range because propofol based anesthesia is often initiated by a bolus injection and following the injection the concentration of propofol can increase to levels, which are two three times of the therapeutic values (∼70 μM).| Method | Detector | Signal units | Linear range | c 1DL (μM) | c 2DL (μM) |
|---|---|---|---|---|---|
| a Calculated from the standard deviation of the background noise (SDbg) and the slope (S) of the calibration curve c1DL = 3 × SDbg/S.23 b Calculated from the residual mean standard deviation (RMSD) of the data points around the calibration curve and the slope of the calibration curve c2DL = 3 × RMSD/S.23 c Membrane-coated BASi GC electrode. d Membrane-coated BASi dual GC electrode for thin layer flow cell. e Previously published Automated Flow Analytical System (AFAS).24 | |||||
| ECbatch | MF-2012c | μA | 0–19.6 | 0.015 ± 0.005 | 2.4 ± 0.3 |
| ECAFASe | MF-1000d | μA | 0.5–10 | 0.08 ± 0.05 | 1.3 ± 0.7 |
| HPLC | UV-Vis | mAU | 0–19.6 | 0.4 ± 0.2 | 3.7 ± 1.5 |
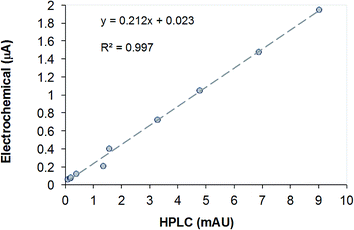
From the data in Table 1 it is clear that the DL of the electrochemical sensor is much lower than for HPLC using a UV-Vis detector. The correlation between the current values measured with the membrane-coated sensors and the peak heights recorded during the HPLC determination is shown in Fig. 3. The detection limit (c1DL) and resolution (c2DL) values were calculated from the standard deviation of the background signal and the residual mean standard deviation of the data points around the calibration curve, respectively as it has been described in our previous paper.7
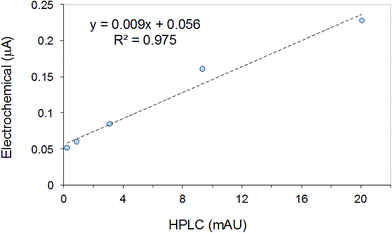
HPLC has also been used for the quantitative assessment of propofol in PBS with 5.0% BSA content and in human serum (HS) samples spiked with propofol. As the first step of this analysis propofol was separated from the biological components by solid phase extraction (SPE) (CleanScreen® DAU columns, United Chemical Technologies, Bristol, PA). Next, propofol was washed off the SPE column using a methanol–water mixture (the same composition as mobile phase used in HPLC separations). The propofol content of this reconstituted solution was then assayed by HPLC. The same samples could be analyzed directly, without any preliminary separation, using our electrochemical membrane-coated sensor. Fig. 4 shows the correlation between the current values measured with the membrane-coated sensor in HS samples and the peak heights recorded during the HPLC determination of propofol in the reconstituted solutions after SPE. The correlation plot representing the analysis of the PBS buffer solutions with 5% BSA using the electrochemical and HPLC methods had similar slope and correlation coefficient (not shown). The significant difference in the slope values in Fig. 3 (PBS) and 4 (HS) can be related to two factors: (i) in blood and human serum only a small fraction of propofol is present as free propofol. Most of propofol is bound to albumin;27,28 (ii) blood/HS is more lipophilic than PBS, i.e., the partition coefficient of propofol between the membrane and the sample is larger for PBS than HS.
In summary, the electrochemical method is simpler, faster and has a better detection limit than the HPLC method. In addition, it allows for continuous monitoring in complex biological samples. Related to propofol detection by HPLC method it should be emphasized that the solid phase extraction step had a low yield and consequently the reconstituted samples had very low propofol concentrations.
3.4 Quantitative measurement of propofol injectable emulsion in PBS and whole blood samples
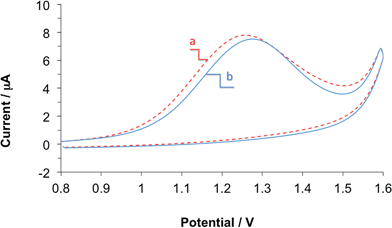
During the development and testing of the propofol sensor, highly purified, analytical grade 2,6-diisopropylphenol (Sigma Aldrich) was used to prepare the standard solutions and the propofol-spiked serum and whole blood samples. However, in clinical settings, the pharmaceutical formulation of propofol known as propofol injectable emulsion is used. The propofol injectable emulsion contains propofol (1%), 10% soybean oil, 1.2% purified egg lecithin, 2.25% glycerol and 0.005% EDTA. The soybean oil, and egg phospholipids are used to solubilize the highly hydrophobic propofol. EDTA is added to inhibit bacterial growth. Glycerol is added to balance the osmotic pressure of the emulsion. To show that the propofol sensor is adequate for monitoring propofol levels in whole blood for clinical use, we tested the influence of the propofol emulsion on the response of our membrane-coated propofol sensor. In preparing the highly diluted standard solutions from the pharmaceutical formulation of propofol the additives have been diluted together with propofol. This dilution (several orders of magnitude) is assumed to be similar to the dilution, which occurs during the infusion of the drug into patients to maintain anesthesia.Fig. 5 shows two CVs recorded with the same electrode in two human blood samples with 111.1 μM propofol concentration. The difference between the two samples was that in one the propofol injectable emulsion was used, while the other used analytical grade 2,6-diisopropylphenol. Between the two CV experiments the membrane-coated sensor was thoroughly washed and rigorously stirred in PBS for 10 minutes. As can be seen the peak current (ip) and peak potential (Ep) values are comparable indicating that the components of propofol injectable emulsion do not interfere with the electrochemical measurement of propofol. The small differences in the ip and Ep are in the range of the reproducibility of these parameters using the membrane coated sensor in repeated measurements in a single solution.
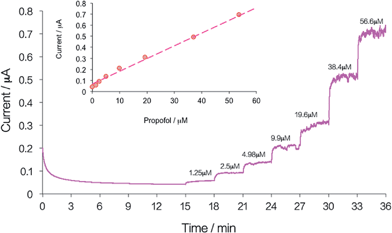
Fig. 6 shows the CA response of the membrane-coated propofol sensor in whole blood following the repeated additions of aliquots of propofol injectable emulsion. The calibration curve constructed from the steady state current values is shown as an inset in Fig. 6. The detection limit of the propofol sensor in these experiments (c1DL = 0.012 ± 0.004 μM, n = 3) was very similar to the detection limit we reported for PBS.8
3.5 Quantitative determination of propofol in whole blood by standard addition
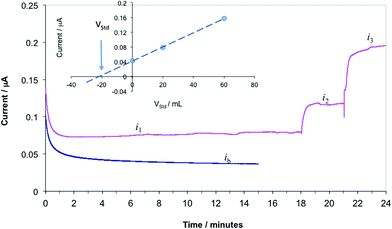
In our previous studies we have recognized that the current values recorded in PBS were significantly different from the current values measured in protein containing solutions (PBS containing 5% BSA, human serum, and human whole blood samples). Due to the differences in the current response of the propofol sensor in different samples, using the calibration curve recorded in PBS for the quantitative assessment of the propofol in solutions other than PBS would introduce systematic error in the measurements. To minimize the errors related to differences in the composition of the standards and the samples, the propofol concentrations in whole blood samples were determined by the standard addition method. The standard addition method assumes that the calibration curve of the sensor has a zero intercept. To fulfill this assumption all measured current values were corrected with the background current (ib) measured in whole blood without propofol. For the sake of this study, a blood sample with 6.0 μM propofol concentration was considered as “unknown”. The “unknown” concentration was set by spiking a blood sample with appropriate amount of propofol injectable emulsion. To determine the propofol concentration in the “unknown” first the CA current is recorded in the sample (i1). Next, aliquots of a standard solution are added to the sample and the CA currents are measured following each addition (i2, i3, etc.). The concentration of propofol in the blood samples is calculated from background corrected current values (i1 − ib = i1corr, i2 − ib = i2corr, etc.) by using the known formula for standard addition (ESI eqn (S1)†), or graphically. In Fig. 7 we show current–time transients recorded during the standard addition experiment and the quantitative assessment of the unknown concentration by a graphical method (Fig. 7 inset). The cross section of the line fitted to the data points with the x axes (volume of the added standard) provides the volume of the standard solution that contains the same amount of analyte as the unknown sample, i.e.:| csVs = −cstVst | (1) |
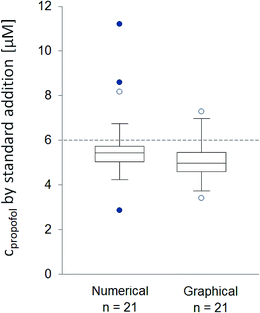
In the course of this study the concentration of propofol was determined in 21 blood samples with 6.0 μM nominal concentration. For the measurements we used 5 individual sensors. A single membrane-coated sensor was used for the analysis of up to 5 samples. The results of the standard addition measurements are summarized in Fig. 8. The average concentration values were determined as 5.8 ± 1.8 μM (numerical method) and 5.1 ± 1.1 μM (graphical method), which are 3.2% and 15.1% less than the nominal concentration. The difference between the two evaluation methods is not statistically significant.
3.6 Initial testing of an electrochemical propofol sensor integrated with a catheter prototype
To evaluate the performance characteristics of the GC fiber and Au wire electrodes on the surface of the intravenous catheter prototype, and to determine the electrochemical surface area of the GC and Au working electrodes, CVs were recorded in ∼100 μM FcMeOH solutions in PBS using either the 203 μm thick silver wire on the surface on the catheter or a commercial Ag/AgCl/3.0 M KCl as reference electrode. As counter electrode, the Pt wire on the surface of the catheter or a Pt coil electrode was used, respectively. An example of the CVs recorded with the GC electrode is shown in Fig. 9. The peak current values on the two curves are identical, but the peak potentials are shifted by ∼0.235 V. This shift is due to the potential difference between the external reference electrode (Ag/AgCl in 3.0 M KCl) and the silver wire electrode on the surface on the catheter. These results demonstrate that the electrochemical cell on the catheter surface, consisting or GC, Ag and Pt wire electrodes, is adequate for monitoring propofol concentrations without external counter and reference electrodes. The shapes of the CVs recorded with the gold wire electrode were very similar, however the current values were significantly larger due to the larger diameter of the gold wires electrode compared the carbon fiber electrode.Next the four electrode wires on the surface of the catheter prototypes were coated with our PVC membrane solution (∼25 μL, 10-fold diluted membrane solution). Evaporation of THF was allowed for up to 24 hours. The detection limit (c1DL = 0.03 μM) and the resolution (c2DL = 4.03 μM) of the membrane-coated carbon fiber electrode secured on the catheter surface were very similar to values reported for the membrane-coated GC macro-electrode (Table 1).7 The CA response of the sensor and the calibration curve constructed from the steady state current values recorded at different concentrations is shown in the ESI (Fig. S3†).
4. Conclusions
In our previous papers we showed that the membrane-coated sensor is adequate for monitoring analytical grade propofol in aqueous samples. In this paper we present a strong correlation between the signals of the electrochemical sensor and that recorded using HPLC analysis of propofol standard solutions and human serum samples spiked with propofol. In addition we show that the components of the pharmaceutical formulation of propofol injectable emulsion do not interfere with the analysis of propofol in aqueous standard solutions, human serum and whole blood samples. However, differences in the composition of the standard solutions used for calibration and the samples to be analyzed, e.g., human serum and whole blood, introduced uncertainty in the measurements. Using the standard addition method for the analysis of propofol spiked whole blood samples these uncertainties were minimized. Finally, we showed that the membrane-coated electrochemical sensor could be implemented onto a catheter surface for potential in vivo monitoring. The response characteristics of the membrane-coated carbon fiber electrode on a catheter surface were very similar to that seen using macroelectrodes. These results open possibilities of detecting and quantifying propofol levels in human blood using a membrane-coated voltammetric sensor implemented on the outer surface of an indwelling catheter. Such a medical device would permit closed-loop anesthesia with propofol, i.e., the management of drug infusion rate based on real time blood values of the drug measured with an in vivo sensor.Acknowledgements
This work was supported by the Telemedicine and Advanced Technology Research Center (TATRC) at the US Army Medical Research and Materiel Command (USAMRMC) under Awards W81XWH-05-2-0064, W81XWH-10-1-0358 and W81XWH-13-C-0099 and by the Tennessee Technology Development Corporation INFUSENSOR grant, and the FedEx Institute of Technology SENSORIUM grant and an unrestricted UTHSC departmental grant from Research to Prevent Blindness (New York, NY), and the Plough Foundation (Memphis, TN). The views, opinions and/or findings contained in this report are those of the author(s) and should not be construed as an official Department of the Army position, policy or decision unless so designated by other documentation.References
- M. D. Krasowski, A. Jenkins, P. Flood, A. Y. Kung, A. J. Hopfinger and N. L. Harrison, J. Pharmacol. Exp. Ther., 2001, 297, 338–351 CAS.
- J. P. Kress and J. B. Hall, J. Am. Med. Assoc., 2012, 308, 2030 CrossRef CAS PubMed.
- M. Grossherr, A. Hengstenberg, T. Meier, L. Dibbelt, K. Gerlach and H. Gehring, Anesthesiology, 2006, 104, 786–790 CrossRef CAS PubMed.
- M. Grossherr, A. Hengstenberg, T. Meier, L. Dibbelt, B. W. Igl, A. Ziegler, P. Schmucker and H. Gehring, Br. J. Anaesth., 2009, 102, 608–613 CrossRef CAS PubMed.
- M. Grossherr, E. Spies, A. Scheel, A. Hengstenberg, H. Gehring and L. Dibbelt, Clin. Lab., 2007, 53, 315–319 CAS.
- M. Grossherr, B. Varadarajan, L. Dibbelt, P. Schmucker, H. Gehring and A. Hengstenberg, Anal. Bioanal. Chem., 2011, 401, 2063–2067 CrossRef CAS PubMed.
- G. R. Harrison, A. D. J. Critchley, C. A. Mayhew and J. M. Thompson, Br. J. Anaesth., 2003, 91, 797–799 CrossRef CAS PubMed.
- W. Miekisch, P. Fuchs, S. Kamysek, C. Neumann and J. K. Schubert, Clin. Chim. Acta, 2008, 395, 32–37 CrossRef CAS PubMed.
- E. Mortier, M. Struys, T. De Smet, L. Versichelen and G. Rolly, Anaesthesia, 1998, 53, 749–754 CrossRef CAS.
- S. C. Hoymork and J. Raeder, Br. J. Anaesth., 2005, 95, 627–633 CrossRef CAS PubMed.
- A. Rigouzzo, L. Girault, N. Louvet, F. Servin, T. De-Smet, V. Piat, R. Seeman, I. Murat and I. Constant, Anesth. Analg., 2008, 106, 1109–1116 CAS.
- C.-C. Hong, P.-H. Chang, C.-C. Lin and C.-L. Hong, Biosens. Bioelectron., 2010, 25, 2058 CrossRef CAS PubMed.
- B. Liu, D. Pettigrew, S. Bates, P. Laitenberger and G. Troughton, J. Clin. Monit. Comput., 2012, 26, 29–36 CrossRef PubMed.
- A. De Vries, P. M. Taylor, G. Troughton, B. Liu, A. L. Fowden and J. W. Sear, J. Vet. Pharmacol. Ther., 2013, 36, 258 CrossRef CAS PubMed.
- L. Li, H. Ding, B. Di, W. Li and J. Chen, Analyst, 2012, 137, 5632 RSC.
- L. Bajpai, M. Varshney, C. N. Seubert and D. M. Dennis, J. Chromatogr. B: Anal. Technol. Biomed. Life Sci., 2004, 810, 291 CrossRef CAS PubMed.
- G. Mazzi and M. Schinella, J. Chromatogr. B, 1990, 528, 537 CrossRef CAS.
- D. E. Pissinis and J. M. Marioli, J. Liq. Chromatogr. Relat. Technol., 2007, 30, 1787 CrossRef CAS.
- J. Trocewicz, Z. Suprynowicz and J. Markowicz, J. Chromatogr. B: Biomed. Sci. Appl., 1996, 685, 129 CrossRef CAS.
- G. F. Plummer, J. Chromatogr. B, 1987, 421, 171 CrossRef CAS.
- J. Salerno, J. Jones, M. Jones, C. Plate and D. Lewis, Pharmacol. Pharm., 2013, 4, 528–534 CrossRef.
- J. Langmaier, F. Garay, F. Kivlehan, E. Chaum and E. Lindner, Anal. Chim. Acta, 2011, 704, 63 CrossRef CAS PubMed.
- F. Kivlehan, F. Garay, J. Guo, E. Chaum and E. Lindner, Anal. Chem., 2012, 84, 7670 CrossRef CAS PubMed.
- F. Rainey, F. Kivlehan, E. Chaum and E. Lindner, Electroanalysis, 2014, 26, 1–9 CrossRef.
- M.-H. Shyr, T.-H. Tsai, P. P. C. Tan, C.-F. Chen and S. H. H. Chan, Neurosci. Lett., 1995, 184, 212 CrossRef CAS.
- K. Toth, K. Stulik, W. Kutner, Z. Feher and E. Lindner, Pure Appl. Chem., 2004, 76, 1119–1138 CAS.
- J. X. Mazoit and K. Samii, Br. J. Clin. Pharmacol., 1999, 47, 35–42 CrossRef CAS.
- M. Schywalsky, H. Ihmsen, R. Knoll and H. Schwilden, Arzneim. Forsch., 2005, 55, 303–306 CAS.
Footnote |
| † Electronic supplementary information (ESI) available. See DOI: 10.1039/c4an01483a |
| This journal is © The Royal Society of Chemistry 2015 |

