
 Open Access Article
 This Open Access Article is licensed under a
 Creative Commons Attribution 3.0 Unported Licence
Correlating the transition dipole moment orientation of phosphorescent emitter molecules in OLEDs with basic material properties
A.
Graf
ab,
P.
Liehm
ab,
C.
Murawski
b,
S.
Hofmann
b,
K.
Leo
b and
M. C.
Gather
*ab
aSUPA, School of Physics and Astronomy, University of St Andrews, St Andrews, KY16 9SS, Scotland, UK. E-mail: mcg6@st-andrews.ac.uk
bInstitut für Angewandte Photophysik, Technische Universität Dresden, 01062 Dresden, Germany
First published on 17th October 2014
Abstract
The orientation of the emissive dipole moment of seven iridium-based phosphorescent emitter molecules commonly used in organic light-emitting diodes (OLEDs) is investigated. The orientation of Ir(ppy)3, Ir(ppy)2(acac), Ir(chpy)3, Ir(dhfpy)2(acac), Ir(BT)2(acac), Ir(MDQ)2(acac), and Ir(piq)3 is determined by measuring the angle dependent spectral radiant intensity of the transverse magnetic polarized emission from p–i–n OLEDs comprising these emitters. The experimental data are compared to the intensity calculated by a multilayer simulation method that includes the anisotropy factor describing the average dipole orientation. Surprisingly, among these molecules, Ir(ppy)3 is the only emitter showing an isotropically distributed transition dipole moment. In order to correlate our results with basic molecular properties, the permanent dipole moment and the size of the molecules are calculated by density functional theory (DFT). The dipole–dipole potential obtained for Ir(ppy)3 is more than 2.5 times larger than those for all other emitter molecules investigated here, indicating that this parameter is correlated with the transition dipole moment orientation.
1. Introduction
The organic light-emitting diode (OLED) technology is currently in the process of entering the display market and holds great promise for future applications in general illumination. However, while the internal efficiency of OLEDs can be close to unity, the efficiency of light extraction (outcoupling efficiency) is typically only on the order of 20%.1,2 This is mainly due to strong coupling of the emission to waveguided modes, caused by total internal reflection at different interfaces within the device, as well as coupling to surface plasmon modes. Most methods that are presently considered for enhancing the light extraction are based on utilizing additional refractive structures, e.g. micro-lens arrays or scattering layers.1,2On the molecular scale, the emission pattern of each emitter molecule in the emissive layer (EML) of an OLED can be described as an oscillating dipole.3–5 Hence, the molecules emit most light in the direction perpendicular to this dipole; along the dipole axis the emission intensity vanishes. Therefore, the average orientation of the emissive dipole moments within OLEDs strongly affects the proportion of light trapped in parasitic waveguide modes with respect to the amount of productive emission in the forward direction. Accordingly, an alternative way of increasing the light extraction efficiency is to have the transition dipole moments of the emitting molecules in the OLED aligned horizontally, i.e. within the plane of the device. Simulations indicate that the external quantum efficiency of OLEDs could be increased by a factor of 1.5 if the transition dipole moments within the OLED had exclusively horizontal orientation rather than being randomly, i.e. isotropically, oriented.3,6
Recently, the average transition dipole orientations of the iridium-based phosphorescent emitters Ir(ppy)3, Ir(ppy)2(acac), and Ir(MDQ)2(acac) were measured by several groups using either angle-resolved or time-resolved spectroscopy and optical modeling.4–10 While the transition dipole orientation of Ir(ppy)3 was found to be isotropic, preferentially horizontal orientation was observed for Ir(ppy)2(acac) and Ir(MDQ)2(acac) and enhanced outcoupling was indeed measured for OLEDs based on molecules with non-isotropically oriented transition dipoles. Previous work on different fluorescent emitter materials revealed structure–property relationships, i.e. the molecular geometry and shape appear to be indicative of the transition dipole orientation.11 However, for phosphorescent emitter complexes, the origin of the differences in transition dipole orientation has not been studied in detail.
Here, we explore and compare the orientation of seven phosphorescent emitter complexes commonly used in OLEDs: the three homoleptic compounds Ir(ppy)3 (tris(2-phenylpyridine)iridium(III), green emission), Ir(chpy)3 (tris(2-(1-cyclohexenyl)pyridine)iridium(III), yellow-green emission), and Ir(piq)3 (tris(1-phenylisoquinoline)iridium(III), red emission), as well as the four heteroleptic molecules with one acetylacetonate (acac) ligand, namely Ir(ppy)2(acac) (bis(2-phenylpyridine)iridium(III)acetylacetonate, green emission), Ir(dhfpy)2(acac) (bis(2-(9,9-dihexylfluorenyl)-1-pyridine)(acetylacetonate)iridium(III), yellow emission), Ir(BT)2(acac) (bis(2-phenylbenzothiazolato)(acetylacetonate) iridium(III), orange emission), and Ir(MDQ)2(acac) (iridium(III)bis(2-methyldibenzo[f,h]quinoxaline)(acetylacetonate), orange-red emission). The orientation of the transition dipole moments of each emitter molecule is determined by measuring the angle dependent emission spectra of p–i–n OLEDs comprising these emitters and comparing the experimental data to optical simulations that include the anisotropy factor describing the average dipole orientation as a fitting parameter. Surprisingly, we find that among the molecules studied, Ir(ppy)3 is the only emitter with isotropically distributed transition dipole moments. To correlate our results with molecular properties, we calculate the permanent dipole moment and the size of the molecules by density functional theory (DFT). We identify the dipole–dipole potential of phosphorescent emitters as a parameter that appears to be strongly correlated with the transition dipole orientation.
2. Results
One strategy for determining the average orientation of the transition dipole moments of emissive molecules is to perform angle-resolved photoluminescence spectroscopy on thin films of the material in question and compare against optical simulations.12 In this work, we use an extension of this approach where angle resolved electroluminescence from complete OLED stacks is recorded and analyzed.3,7 The OLEDs comprise one of the seven investigated emitters as a dopant within the EML of a p–i–n device structure (Fig. 1a, see Experimental section for further details). Working with complete OLEDs and using electrical rather than optical excitation ensure that one measures the average orientation of the emitter molecules involved in the actual emission process and thus excludes possible artifacts. The setup used to measure the electroluminescence spectra of each OLED as a function of viewing angle θ is schematically illustrated in Fig. 1b. Here, the OLED is mounted on a goniometer and emission is collected through a polarizer using a fiber coupled spectrometer.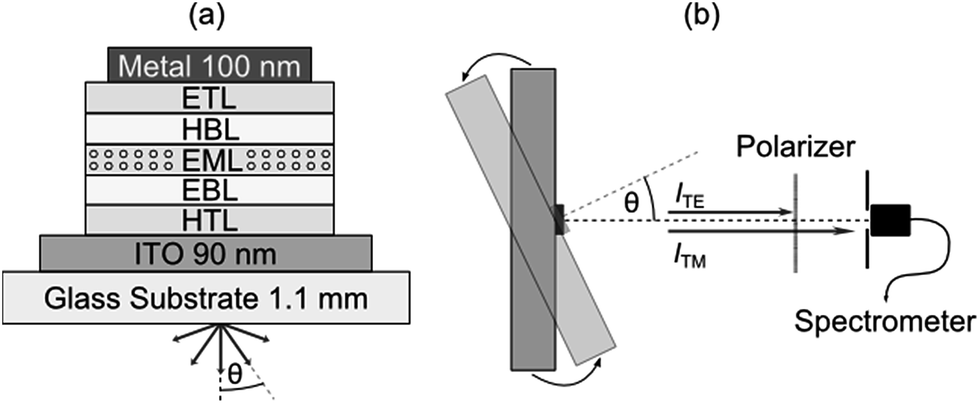 | ||
| Fig. 1 (a) Schematic of the multi-layer p–i–n OLED stack used in this work. (b) Sketch of the setup used to measure the angle resolved spectral radiant intensity; OLED mounted on a goniometer and emission collected through a polarizer using a fiber coupled spectrometer. | ||
2.1 Transition dipole moment orientation
The overall emission of an emissive molecule can be described as a superposition of the contribution from horizontally (h) and vertically (v) aligned dipoles, where the orientation is taken with respect to the planar surface of the stack. The function describing the overall emission into the far-field medium as a function of viewing angle θ, wavelength λ and anisotropy factor a is referred to as spectral radiant intensity I and can be written as| I(θ, λ, a) = aITM,v + (1 − a)(ITM,h + ITE,h). | (1) |
The value of a is determined for the different emitter materials used here by performing a least-squares fit of the measured spectral radiant intensity IExp with data obtained from an optical simulation ISim in which the orientation parameter a is a free fitting parameter. (Our simulations are based on a well-established transfer matrix approach combined with an electromagnetic dipole model.13 The recombination zone is modelled as δ-distribution at the EML/hole blocking layer (HBL) interface.3) According to eqn (1), I(θ, λ, a) is most sensitive to a if equal amounts of light are emitted by horizontally and vertically aligned dipoles. This is best fulfilled by using OLED stacks operating in the first optical minimum, i.e. where light emission from horizontally aligned dipoles is suppressed by destructive interference between direct emission and light reflected from the back cathode.14 The sensitivity is further enhanced by filtering out the ITE,h component of the spectral radiant intensity using a polarizer. In addition to the emitter orientation, small changes of the distance between the metal cathode and the EML strongly affect I(θ, λ, a).13 This distance essentially corresponds to the thickness of the electron transport layer (ETL), which is thus added as a second fit parameter for each device.
As a representative example, Fig. 2 shows the normalized experimental and simulated ITM(θ, λ, a) data for the OLED containing the yellow phosphor Ir(dhfpy)2(acac) as an emitter. Here, the least-squares optimization of the anisotropy factor yields a = 0.25 (Fig. 2b) in good agreement with the experimental data (Fig. 2a). In contrast, a simulation that assumes isotropic orientation predicts significantly lower emission intensity in the forward direction, i.e. at θ = 0° (Fig. 2c). Fig. 2d shows a simulation assuming an even more pronounced horizontal orientation (a = 0.22, the smallest a value observed for any of the investigated emitters).
 | ||
| Fig. 2 TM-polarized part of the spectral radiant intensity for the OLED stack with Ir(dhfpy)2(acac). (a) Experimental data, (b) simulated data for the best fit (a = 0.25), (c) simulation assuming isotropic orientation (a = 1/3) and (d) simulation assuming slightly stronger horizontal orientation (a = 0.22). All intensities are normalized to the maximum intensity and are plotted on a linear false-color scale. | ||
The experimental data and best fits for all seven emitters in this study are presented in Table 1. In addition, Table 1 shows the squared residuals L(θ, λ, a) for all fits, i.e. the square of the difference between the experimentally measured IExpTM and simulated spectral radiant intensity ISimTM for each data point (note that these graphs are shown on a logarithmic scale to display small deviations more easily):
| L(θ, λ, a) = (IExpTM(θ, λ, a) − ISimTM(θ, λ, a))2. | (2) |

|
All best fits show a deviation of L(θ, λ, a) < 0.04 from the experiment. The largest differences occur for forward emission at wavelengths above the peak emission of the emitters where the simulation underestimates the emission intensity. We attribute the deviations in this region to several simplifications made in the simulation. First, the emission zone is approximated as a δ-distribution but in reality is spread over a finite thickness within the EML which spectrally broadens the effect of constructive/destructive interference. Second, incoherent reflections at the edges of the devices lead to an emission background that cannot be accounted for in the simulation and that is most clearly seen in this region. Outside of this region, the difference for the best fit is consistently below L(θ, λ, a) < 0.015. Overall, the precision of the orientation measurement is estimated to be Δa = ±0.02.
For comparison, Table 1 also shows L(θ, λ, a) for optical simulations assuming isotropic (a = 1/3) and preferentially horizontal (a = 0.22) orientation. As light emitted by dipoles with vertical (horizontal) orientation is observed mainly under large (small) viewing angles, errors in a lead to the following picture: overestimating a, i.e. assuming an isotropic orientation for a horizontally oriented material, increases the error at large viewing angles. This is particularly apparent for Ir(BT)2(acac) and Ir(MDQ)2(acac). Underestimating a predominantly leads to an increased error at small viewing angles as seen most clearly for Ir(ppy)3. Moreover, the total fit error  is listed in each plot (Table 1). (Since
 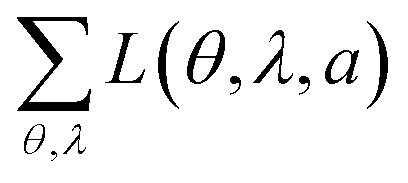 is minimized in the least-square optimization, any deviation from aopt in the simulation leads to a higher total fit error.)
In summary, there is a preferentially horizontal orientation for the emitters Ir(ppy)2(acac) (a = 0.23), Ir(chpy)3 (a = 0.23), Ir(dhfpy)2(acac) (a = 0.25), Ir(BT)2(acac) (a = 0.22), Ir(MDQ)2(acac) (a = 0.24), and Ir(piq)3 (a = 0.22). Among the investigated emitters, surprisingly Ir(ppy)3 alone shows an isotropically oriented transition dipole moment (a = 0.31). Now, the question arises how Ir(ppy)3 differs from the other emitters, in particular compared to the structurally similar emitters Ir(chpy)3 and Ir(piq)3, which also have three identical ligands.
2.2 Calculation of the dipole–dipole Potential
Previous work by N. G. Park et al. indicates a higher permanent dipole moment for Ir(ppy)3 (6.26 D) compared to Ir(ppy)2(acac) (1.91 D).14 This is expected to increase the molecular interaction due to the increased Keesom forces. Reineke et al. were indeed able to show that when embedded into typical host materials, Ir(ppy)3 molecules tend to aggregate more strongly than Ir(ppy)2(acac) molecules.15We assume that differences in Keesom forces and molecular attraction play a role in determining the average orientation of the emitter molecules and their transition dipole moments. CBP is the host material used in the EML of our OLEDs, except for Ir(MDQ)2(acac), which is doped into NPB. Since CBP is nonpolar16 and the permanent dipole moment of NPB is negligible compared to Ir(MDQ)2(acac),16 attraction will occur primarily between emitter molecules rather than between matrix and emitter molecules. For two identical molecules, the resulting intermolecular dipole–dipole potential U which controls the attractive force between them and describes the stability of aggregates formed between them is proportional to17
 | (3) |
For each molecule, we calculated the permanent dipole moment of the molecular ground state using density functional theory (DFT, see Experimental methods). First, the geometry of the different isomers of each molecule is optimized for the lowest overall energy in order to identify the structure of the abundant isomer of each molecule (Fig. 3). Using the optimized structures, we then obtain the dipole moments μ for each molecule (Table 2). For Ir(ppy)3, we find μ = 6.40 D, consistent with values given in the literature (6.26 D,14 6.4 D,18 and 6.14 D19). Apart from Ir(piq)3 (μ = 5.20 D), all other molecules investigated here have a permanent dipole moment that is more than three times smaller than that of Ir(ppy)3. Fig. 3 illustrates the relative magnitude and orientation (blue arrow) of the different dipole moments with respect to the size and orientation of the molecule.
 | ||
| Fig. 3 DFT optimized molecular structure, calculated relative magnitude and orientation of permanent dipole moment μ (blue arrows) for all phosphorescent emitter molecules investigated here. All dipole moments originate at the center of charge. | ||
| μ [D] | r [Å] | U/UIr(ppy)3 | a | |
|---|---|---|---|---|
| Ir(ppy)3 | 6.40 | 11.4 | 1.00 | 0.31 |
| Ir(ppy)2(acac) | 1.66 | 11.0 | 0.08 | 0.23 |
| Ir(chpy)3 | 2.02 | 11.6 | 0.09 | 0.23 |
| Ir(dhfpy)2(acac) | 1.16 | 17.7 | 0.01 | 0.25 |
| Ir(BT)2(acac) | 1.76 | 12.6 | 0.05 | 0.22 |
| Ir(MDQ)2(acac) | 1.75 | 13.8 | 0.04 | 0.24 |
| Ir(piq)3 | 5.20 | 13.5 | 0.39 | 0.22 |
In order to calculate the dipole–dipole potential, the average distance r between two dipoles must be determined. Considering the case of two adjacent emitting molecules in a possible aggregate, the distance r is equal to the molecular diameter along the connection between their dipoles. Since the molecular structure and the location of the permanent dipole within the molecule vary between the different types of emitter molecules, the molecular diameter differs as well. The molecular diameter was thus approximated by calculating the volume of the smallest cuboid that includes the whole molecule and then taking the diameter of a sphere with the same volume as the value of r. (Several alternative measures for the molecular diameter were tested and similar results were obtained.)
Table 2 lists the dipole–dipole potential U of all emitter molecules, normalized to the potential of Ir(ppy)3. U indicates the stability of a possible aggregate of emitter molecules. In comparison to Ir(ppy)3, all other investigated emitter molecules have a considerably smaller dipole–dipole potential. With the exception of Ir(piq)3, the potentials amount to less than 10% of the potential of Ir(ppy)3. Even for Ir(piq)3 the dipole–dipole potential is only 39% of the Ir(ppy)3 value. Interestingly, amongst the investigated phosphorescent hetero- and homoleptic emitter molecules those that show a small dipole–dipole potential tend to have horizontally aligned transition dipole moments. Whilst further investigations will be necessary to elucidate the origin of this effect, we tentatively attribute the isotropic orientation of Ir(ppy)3 to aggregation15 caused by the strong attractive potential. The orientation of emitter aggregates will be affected less by the interaction with the substrate and the matrix material (due to the smaller surface to volume ratio) and thus will be mostly stochastic. In contrast, the emitter molecules with small dipole–dipole potential will have a smaller probability to accumulate. Even the potential of Ir(piq)3, which is in between the potential of the other oriented emitters and Ir(ppy)3, is too small to cause substantial aggregation. Hence, the orientation of these separated emitter molecules within the matrix is dominated by spontaneously induced London forces with matrix molecules, which can lead to anisotropy. (London forces have also been found to be important for the orientation of fluorescent emitter molecules,11 which could indicate similarities in the underlying processes. However, we note that for fluorescent emitters orientation is frequently associated with elongated linear shapes, a motif absent from the phosphorescent emitters studied here.)
Our findings indicate that calculating the dipole–dipole potential may be helpful in identifying molecular structures that can offer preferential horizontal transition dipole orientation. However, with Ir(ppy)3 being the only isotropically oriented emitter available to us at present, our hypothesis needs to be verified further, once additional isotropically oriented iridium-based emitter complexes have been identified.
3. Conclusions
We have determined the average transition dipole orientation of seven phosphorescent iridium-based emitters by performing and analyzing angle resolved electroluminescence measurements on complete OLED stacks. The OLED architecture and the measurement were optimized to provide maximum sensitivity for the dipole orientation measurement. Surprisingly, it was found that among the investigated emitters, Ir(ppy)3 is the only one for which the transition dipole moment is isotropically oriented. All other emitters – even those based on homoleptic structures with three identical ligands – show a preferentially horizontal orientation of the transition dipole moment. Whether this preference for horizontal orientation is due to biased sampling (i.e. horizontally oriented emitters may have a better chance of passing initial material screening) or whether iridium-based phosphors have an intrinsic tendency to show horizontal emitter alignment remains to be seen. Certainly, simple symmetry considerations are not sufficient to predict the average transition dipole orientation. Instead, we found that the dipole–dipole potential for polar emitter molecules with preferred horizontal transition dipole orientation is substantially smaller than that for the isotropically oriented Ir(ppy)3. Screening for phosphorescent emitter molecules with small dipole–dipole potential may thus becomes a more widely applicable strategy for identifying emitter complexes that support efficient light extraction from phosphorescent OLEDs.4. Experimental section
4.1 Materials
The following is a list of the abbreviations and complete chemical names of the material used in this study: Ag (silver), Al (aluminum), BAlq2 (bis-(2-methyl-8-quinolinolato)-4-(phenyl-phenolato)aluminium-(III)), BPhen (4,7-diphenyl-1,10-phenanthrolin), CBP (4,4′-bis(carbazol-9-yl)biphenyl), Cs (cesium), F6-TCNNQ (2,2′-(perfluoronaphthalene-2,6-diylidene)dimalononitrile), Ir(BT)2(acac) (bis(2-phenylbenzothiazolato)(acetylacetonate)iridium(III)), Ir(chpy)3 (tris(2-(1-cyclohexenyl)pyridine)iridium(III)), Ir(dhfpy)2(acac) (bis(2-(9,9-dihexylfluorenyl)-1-pyridine)(acetyl-acetonate)iridium(III)), Ir(MDQ)2(acac) (iridium(III)bis(2-methyldibenzo [f,h]quinoxaline)(acetylacetonate)), Ir(piq)3 (tris(1-phenylisoquinoline)iridium(III)), Ir(ppy)2(acac) (bis(2-phenylpyridine)iridium(III)acetylacetonate), Ir(ppy)3 (tris(2-phenylpyridine)iridium(III)), MeO-TPD (N,N,N′,N′-tetrakis 4-methoxyphenyl-benzidine), MoO3 (molybdenum(VI) oxide), NPB (4,4′-bis[N-(1-naphthyl)-N-phenlamino]biphenyl), Spiro-TAD (2,2′,7,7′-tetrakis-(N,N-diphenylamino)-9,9′-spirobifluorene), Spiro-TTB (2,2′,7,7′-tetrakis-(N,N-di-methylphenylamino)-9,9′-spiro-bifluorene), and TPBi (2,2′,2′′-(1,3,5-phenylen)tris(1-phenyl-1H-benzimidazole)).4.2 OLED structure
The general structure of all OLEDs was anode/hole transport layer (HTL)/electron blocking layer (EBL)/emissive layer (EML)/hole blocking layer (HBL)/electron transport layer (ETL)/cathode. To obtain efficient electroluminescence from the different emitter materials used, slightly different material combinations were used for each emitter: Ir(ppy)3: ITO (90 nm)/CBP:MoO3 (25 nm)/CBP (10 nm)/CBP:Ir(ppy)3 (15 nm, 8 wt%)/TPBi (10 nm)/TPBi:Cs (134 nm)/Al (100 nm), Ir(ppy)2(acac): ITO (90 nm)/CBP:MoO3 (25 nm)/CBP (10 nm)/CBP:Ir(ppy)2(acac) (15 nm, 8 wt%)/TPBi (10 nm)/TPBi:Cs (137 nm)/Al (100 nm), Ir(chpy)3: ITO (90 nm)/Spiro-TTB:F6-TCNNQ (50 nm)/NPB (10 nm)/CBP:Ir(chpy)3 (20 nm, 10 wt%)/BPhen (10 nm)/BPhen:Cs (146 nm)/Al (100 nm), Ir(dhfpy)2(acac): ITO (90 nm)/Spiro-TTB:F6-TCNNQ (50 nm)/NPB (10 nm)/CBP:Ir(dhfpy)2(acac) (20 nm, 10 wt%)/BPhen (10 nm)/BPhen:Cs (149 nm)/Al (100 nm), Ir(BT)2(acac): ITO (90 nm)/Spiro-TTB:F6-TCNNQ (50 nm)/NPB (10 nm)/CBP:Ir(BT)2(acac) (20 nm, 10 wt%)/BPhen (10 nm)/BPhen:Cs (157 nm)/Al (100 nm), Ir(MDQ)2(acac): ITO (90 nm)/Spiro-TTB:F6-TCNNQ (60 nm)/Spiro-TAD (10 nm)/NPB:Ir(MDQ)2(acac) (20 nm, 10 wt%)/BAlq2 (10 nm)/BPhen:Cs (143 nm)/Ag (100 nm), Ir(piq)3: ITO (90 nm)/Spiro-TTB:F6-TCNNQ (50 nm)/NPB (10 nm)/CBP:Ir(piq)3 (20 nm, 10 wt%)/BPhen (10 nm)/BPhen:Cs (174 nm)/Al (100 nm).4.3 OLED fabrication
All OLEDs used in this work were fabricated by thermal evaporation of the used materials in a vacuum evaporation system (Kurt J. Lesker) at a base pressure below 10−8 mbar. OLED stacks were deposited on the glass substrate (thickness: 1.1 mm) with pattered ITO electrodes. Each substrate has four devices with an active area of 6.49 ± 0.1 mm2 each. After fabrication, OLEDs are immediately encapsulated under a nitrogen atmosphere using a cavity glass lid with an embedded hydrophilic getter material.4.4 Measuring the spectral radiant intensity
The spectral radiant intensity is measured with a fiber coupled Ocean Optics USB 4000 spectrometer and a rotational stage in 1° steps. The transverse electric component of the emission is filtered out with a polarization filter (extinction > 5 × 10⁵, CASIX PGT5010).4.5 DFT simulations
Calculations of the dipole moments of the different emitters were performed by DFT using the hybrid functional B3-LYP with the LANL2DZ basis set as implemented in the software package Gaussian09 (Gaussian Inc., Wallingford, CT, USA).Acknowledgements
The authors are grateful to H. A. Fruchtl for technical support with Gaussian and thank N. M. Kronenberg and R. Scholz for initial discussions on DFT simulations. This work received funding from the ESF/EU project OrganoMechanics and the European Community's Seventh Framework Programme under Grant Agreement no. FP7 267995 (NUDEV).Notes and references
- W. Brütting, J. Frischeisen, T. D. Schmidt, B. J. Scholz and C. Mayr, Phys. Status Solidi A, 2013, 210, 44 CrossRef.
- K. Saxena, V. K. Jain and D. S. Mehta, Opt. Mater., 2009, 32, 221 CrossRef CAS PubMed.
- M. Flämmich, M. C. Gather, N. Danz, D. Michaelis, A. H. Bräuer, K. Meerholz and A. Tünnermann, Org. Electron., 2010, 11, 1039 CrossRef PubMed.
- L. Penninck, F. Steinbacher, R. Krause and K. Neyts, Org. Electron., 2012, 13, 3079 CrossRef CAS PubMed.
- W. L. Barnes, J. Mod. Opt., 1998, 45, 661 CrossRef CAS.
- M. Flämmich, J. Frischeisen, D. S. Setz, D. Michaelis, B. C. Krummacher, T. D. Schmidt, W. Brütting and N. Danz, Org. Electron., 2011, 12, 1663 CrossRef PubMed.
- P. Liehm, C. Murawski, M. Furno, B. Lüssem, K. Leo and M. C. Gather, Appl. Phys. Lett., 2012, 101, 253304 CrossRef PubMed.
- C. Murawski, P. Liehm, K. Leo and M. C. Gather, Adv. Funct. Mater., 2013, 24, 1117 CrossRef.
- T. D. Schmidt, D. S. Setz, M. Flämmich, J. Frischeisen, D. Michaelis, B. C. Krummacher and W. Brütting, Appl. Phys. Lett., 2011, 99, 163302 CrossRef PubMed.
- S. Kim, W. Jeong, C. Mayr, Y. Park, K. Kim, J. Lee, C. Moon, W. Brütting and J. Kim, Adv. Funct. Mater., 2013, 23, 3896 CrossRef CAS.
- D. Yokoyama, J. Mater. Chem., 2011, 21, 19187 RSC.
- J. Frischeisen, D. Yokoyama, C. Adachi and W. Brütting, Appl. Phys. Lett., 2010, 96, 073302 CrossRef PubMed.
- M. Furno, R. Meerheim, S. Hofmann, B. Lüssem and K. Leo, Phys. Rev. B: Condens. Matter Mater. Phys., 2012, 85, 115205 CrossRef.
- N. G. Park, G. C. Choi, Y. H. Lee and Y. S. Kim, Curr. Appl. Phys., 2006, 6, 620 CrossRef PubMed.
- S. Reineke, T. C. Rosenow, B. Lüssem and K. Leo, Adv. Mater., 2010, 22, 3189 CrossRef CAS PubMed.
- Y. Noguchi, Y. Miyazaki, Y. Tanaka, N. Sato, Y. Nakayama, T. D. Schmidt, W. Brütting and H. Ishii, J. Appl. Phys., 2012, 111, 114508 CrossRef PubMed.
- J. Karle and L. Huang, J. Mol. Struct., 2003, 647, 9 CrossRef CAS.
- S. Polosan, T. J. Chow and T. Tsuboi, J. Phys. Org. Chem., 2008, 21, 315 CrossRef CAS.
- M. E. Thompson, S. Garon, R. Kwong, J. Brooks and M. H. M. Lu, US Pat. 6902833, University Of Southern California, Universal Display Corporation, 2003.
| This journal is © The Royal Society of Chemistry 2014 |