 Open Access Article
Creative Commons Attribution 3.0 Unported Licence
Ab initio thermodynamic model of Cu2ZnSnS4†
Adam J.
Jackson
a and
Aron
Walsh
*b
aDoctoral Training Centre in Sustainable Chemical Technologies, University of Bath, Claverton Down, Bath, UK
bCentre for Sustainable Chemical Technologies and Department of Chemistry, University of Bath, Claverton Down, Bath, UK. E-mail: a.walsh@bath.ac.uk
First published on 31st March 2014
Abstract
Thin-film solar cells based on the semiconductor Cu2ZnSnS4 (CZTS) are a promising candidate for terawatt-scale renewable energy generation. While CZTS is composed of earth abundant and non-toxic elements, arranged in the kesterite crystal structure, there is a synthetic challenge to produce high-quality stoichiometric materials over large areas. We calculate the thermodynamic potentials of CZTS and its elemental and binary components based on energetic and vibrational data computed using density functional theory. These chemical potentials are combined to produce a thermodynamic model for the stability of CZTS under arbitrary temperatures and pressures, which provide insights into the materials chemistry. CZTS was shown to be thermodynamically stable with respect to its component elements and their major binary phases binaries under modest partial pressures of sulfur and temperatures below 1100 K. Under near-vacuum conditions with sulfur partial pressures below 1 Pa decomposition into binaries including solid SnS becomes favourable, with a strongly temperature-dependent stability window.
1 Introduction
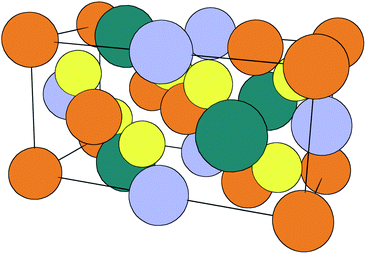
Inorganic thin-film solar cells consist of several materials (a combination of metallic, semiconducting and insulating compounds) arranged in a particular order to exploit the photovoltaic effect. The deposition and optimisation of each layer requires a specific set of conditions and sometimes chemical treatments to ‘activate’ their performance. The role of compositional and structural variations in limiting performance for a range of solar cell technologies is known.1 The development of processing and annealing conditions has been largely empirical in the past; however, the importance of chemical thermodynamics in this area is beginning to be recognised.2Cu2ZnSnS4 (CZTS), a quaternary chalcogenide semiconductor, was introduced as a photovoltaic material in 1988 by Ito and Nakazawa.3 Several crystal structures are known, but while early work assumed the stannite structure (space group I![[4 with combining macron]](https://www.rsc.org/images/entities/char_0034_0304.gif) 2m), the lowest-energy structure is now known to be the kesterite structure (space group I
2m), the lowest-energy structure is now known to be the kesterite structure (space group I![[4 with combining macron]](https://www.rsc.org/images/entities/char_0034_0304.gif) , Fig. 1). Computational work has shown this to be a few meV per formula unit lower in ground-state energy than the stannite and CuAu-derived structures.4 All low-energy crystal structures are related to the face-centred cubic zincblende lattice, with Cu, Zn and Sn distributed over one sublattice and S filling a second sublattice.
, Fig. 1). Computational work has shown this to be a few meV per formula unit lower in ground-state energy than the stannite and CuAu-derived structures.4 All low-energy crystal structures are related to the face-centred cubic zincblende lattice, with Cu, Zn and Sn distributed over one sublattice and S filling a second sublattice.
In recent years CZTS and Se-containing variations have come under particular attention as a candidate for large-area thin-film cells, with a current record light-to-electricity conversion efficiency of 12.6% in a Se-dominated cell.5 The record efficiency for Se-free CZTS is 8.4%.6 Its distinct advantages over competing technologies are the combination of a direct optical bandgap around the “optimum” 1.5 eV and its abundant, inexpensive elemental components.3–5,7,8 The reserves and production rates of these materials suggest that CZTS is a strong contender for global-scale generation compared to peers including Cu(In,Ga)(S,Se)2, CdSe and CdTe.9 The long-term requirements for such generation are expansive, forming part of “country-sized renewable facilities”.10 Large-scale production requires a pragmatic process, preferably one which is adaptable to “roll-to-roll” processing. Rapid reactions and modest pressures are therefore of particular interest, as is the avoidance of exotic and dangerous substances.
Laboratory studies have already demonstrated the complexity of the phase diagram, with secondary phases or partial disproportionation commonly observed, and off-stoichiometry compositions employed in order to manipulate this.11–14 These are commonly expressed in terms of chemical potential, giving insight into the transitions between phases but not the corresponding physical conditions. In particular, the materials chemistry of the system is known to be sensitive to the partial pressure of the chalcogen atmosphere. This pressure has been manipulated by supplying S/Se solids, H2S gas and/or SnS(e) solids.15–19 A recent paper provided Sn and Se powders with the intent that they would form reactive gas-phase Sn–Se compounds.20 It should be noted that SnS is itself a semiconductor that has been attracting interest for application as an absorber layer in thin-film solar cells.21,22
Weber et al. studied the relationship between the composition of CZTS and temperature, finding a significant shift in composition and loss of Sn at temperatures above around 500 °C under 10−2 Pa of S, with some SnS evaporation at temperatures as low as 350 °C.16 As well as two reactions involving a ternary phase, they propose the quaternary decomposition to binaries and sulfur vapours:
| Cu2ZnSnS4(s) → Cu2S(s) + ZnS(s) + SnS(g) + S(g) | (1) |
 | (2) |
| SnS(s) ⇌ SnS(g). | (3) |
A typical chalcogenide photovoltaic device consists of a metallic back electrical contact, an active p-type absorber layer, an n-type buffer layer and a transparent oxide electrical contact. For kesterite-based devices this is usually Mo|CZTS|CdS|In2O3:Sn. Evidence of chemical reactivity and compositional gradients is frequently found at each of the interfaces.2 In particular, significant amounts of MoS2 are formed at the Mo–CZTS interface during the annealing step.24 It is known that such reactions change the current–voltage characteristics of the solar cell, but the specific processes occurring and how to control them are not understood. There are significant opportunities for materials chemists to characterise the structure and properties of photovoltaic systems such as these.
While reference thermochemical data is available for well-studied semiconductors such as ZnS and SnS2, for CZTS and related compounds such information is currently unknown.25,26 For CZTS it is difficult to define a reference experimental sample; a recent study employing scanning transmission electron microscopy suggested substantial cation inhomogeneity in CZTS with features of the order 1 nm, while atom probe tomography of CZTSe has revealed a co-existing ZnSe network with features of the order 10 nm.27,28 Significant cation disorder is expected in kesterites following high-temperature annealing due to the gain in configurational entropy, and controlled by largely-undocumented cooling rates.29
In this study, we combine quantum and statistical mechanics to compute a range of thermodynamic potentials for pure kesterite CZTS and its elemental and binary components. This consistent set of data, with energies and vibrations computed using density functional theory (DFT), is used to predict the stability window for the material with respect to different processing conditions. The database is freely available and the model will be extended to include other materials systems and processing scenarios.‡ It is not practical to examine the effect of long-range disorder with ab initio calculations, and if these are suspected to provide a significant thermodynamic driving force in CZTS formation then alternative approaches will be needed. The stannite phase was briefly examined and the data is included in the ESI,‡ but as the chemical potential is consistently within a few meV of the kesterite phase it does not meaningfully affect any equilibrium results. A configurational entropy term from inter-mixing is possible, but would require a greater understanding of any phase-coexistence.
2 Methodology
2.1 Thermodynamic framework
Classical thermodynamics is used here to predict heats of formation and relative phase stabilities. A consistent approach is used to calculate the key thermodynamic potentials: internal energy U and enthalpy H. By calculating U as a function of temperature and pressure, the heat capacity Cv and entropy S are also derived, and hence the Helmholtz free energy A and Gibbs free energy G. G may be seen as the ‘key’ to phase stability, as this potential is minimised at equilibrium.Overall enthalpy changes ΔH are calculated from the molar enthalpies of components Ĥi following Hess's law:
 | (4) |
 | (5) |
These species-wise energies require a consistent reference point. Here the reference is a state in which all electrons are non-interacting (i.e., infinitely separated). We make the common assumption that chemistry is governed entirely by the electrostatic interactions and kinetic energy of electrons and nuclei, within the Born–Oppenheimer approximation. Gravity and nuclear forces are neglected.
The chemical potentials can be separated into a ground-state contribution and a vibrational contribution; in this work:
| U0 = H0 = A0 = G0 = EDFT + EZP, | (6) |
Expressions for these thermochemical potentials as functions of temperature and pressure, while aligning suitable reference energies, are at the heart of ab initio thermodynamics.30–33 The forms used here were derived and applied in previous work by the authors:34 for ideal gases
 | (7) |
 | (8) |
 | (9) |
 | (10) |
θ is used to denote an intermediate reference state; thermodynamic properties are often provided relative to a standard temperature and pressure. This enables the use of standard heat capacities Cp and Cv, or tabulated enthalpies relative to some arbitrary state. (Note that Cv and Cp are used interchangeably for incompressible solids.)
We emphasise that we cannot comment on the rates of reactions from our thermodynamic treatment. It is possible, for example, that kinetic barriers for a particular phase separation would be prohibitive for it to complete in the timescale of typical processing or annealing conditions.
2.2 Computational details
Ground-state total energies and forces were computed in DFT calculations with the FHI-aims quantum chemistry code.35,36 These were used to optimise the initial crystal and molecular structures, without symmetry constraints, before modelling vibrational properties. The PBEsol exchange–correlation (XC) functional was employed; this functional employs the generalised gradient approximation (GGA) and is optimised for solid-state calculations.37 Evenly-spaced k-point grids were used, with scaled sampling following the procedure of Moreno and Soler.38 In general a 10 Å reciprocal-space cutoff is sufficient for semiconductors and insulators, while a higher cutoff is helpful for achieving convergence in total energies for metals. The recommended ‘tight’ set of numerically-tabulated atom-centred basis functions was used throughout, except for the cases of Zn metal in which an extended set of 13 basis functions was employed, and Sn metal in which a full ‘tier 2’ basis set was used (17 functions per atom).Vibrational calculations were performed with Phonopy,§ a code which implements the Parlinski–Li–Kawazoe “direct method” for computing solid-state phonons within the harmonic approximation.39,40 From a primitive crystal structure, a mixture of finite displacements and analytical gradients is used to construct a dynamical matrix of force constants. Forces are obtained from DFT calculations on large periodic cells; generally it is necessary to form supercells in order to avoid self-interaction of displaced atoms. Supercell sizes for this study are listed in Table 1.
| Species | Supercell expansion | Supercell volume (Å3) | k-point cutoff (Å) |
|---|---|---|---|
| a 10 Å cutoff exceeded in c axis: [2 2 2] grid. | |||
| Cu | [333] | 1225.5 | 15 |
| Zn | [443] | 1356.4 | 25 |
| β-Sn | [333] | 1879.5 | 25 |
| α-S | [222] | 6663.3 | 10 |
| Cu2S | [111] | 2055.9 | 10 |
| ZnS | [333] | 1038.3 | 10 |
| SnS | [333] | 1679.4 | 15 |
| SnS2 | [332] | 1252.0 | 10 |
| Cu2ZnSnS4 | [222] | 2486.3 | 10a |
In this work the electronic structure was iterated until the analytical forces were converged to within 10−5 eV Å−1. Finite displacements of 0.01 Å were used, and symmetry employed to reduce the number of calculations where possible. From the dynamical matrix, a set of frequencies is calculated, forming a vibrational model of the system within the harmonic approximation and defining EZP. By applying Bose–Einstein statistics, a relationship is formed between temperature and vibrational energy, yielding U(T), and hence Cv(T) and S(T). Note that the effect of pressure is not taken into account with this method; a logical extension for exploring the anharmonic effects of lattice expansion would be the quasi-harmonic method or thermodynamic integration from molecular dynamics simulations with an appropriate ensemble.
2.3 Crystal structures
Ternary phases and metal alloys were disregarded at this initial stage. The structure for CZTS was drawn from previous work, and optimised for the basis set and XC functional used in this study.41The initial structure of Cu was obtained from the Inorganic Crystal Structure Database (ICSD) in the form of a simple face-centred cubic cell (collection code 64699).42 For Zn an initial structure was drawn from the ICSD (collection code 64990) consisting of a 2-atom hexagonal-close-packed unit cell. Standard local geometry-optimisation algorithms (also tested in the plane-wave code VASP) struggled to find the energy-minimising geometry as Zn is soft in the c-axis. A series of fixed c-values were tested over increments of 0.025 Å, while relaxing the a and b parameters to find optimal a and c values; b, α, β, γ and the atomic positions were then fixed to the P63/mmc space group. For β-Sn the lattice constant was drawn from the ICSD (collection code 40039) and a 2-atom face-centred-cubic cell constructed. The α-S structure was based on a previous DFT study and is a large triclinic cell containing 32 S atoms; this in turn is a symmetry reduction from an orthorhombic conventional cell.43
The structures of Cu2S phases have been previously studied using X-ray crystallography and density functional theory; while the high-temperature and cubic structures contain partially-occupied sites, low-Cu2S has a well-defined, albeit large, 144-atom monoclinic unit cell.44 SnS2 is the binary phase corresponding to the formal oxidation state in CZTS (i.e. Sn(IV)). A 3-atom hexagonal unit cell was obtained from the ICSD (collection code 100612). An 8-atom orthorhombic structure for the stable Pnma phase of SnS was drawn from recent work on the phase stability of this material.43 ZnS is encountered in (and gives its name to) both the zincblende and wurtzite crystal structures. The starting point was 2-atom zincblende primitive cell with a lattice parameter a = 5.4053 Å from reference data.45 A corresponding set of calculations were performed for the wurtzite phase of ZnS; the results are not considered here as the zincblende ground state is more stable and preferred for modelling, but the results are available as part of the ESI.† The initial and optimised structural parameters for all other phases are included in Table 2.
| Material | Structure | Space group | a | b | c | α | β | γ | ΔHθf (kJ mol−1) |
|---|---|---|---|---|---|---|---|---|---|
| Cu2ZnSnS4 (kesterite) | Initial41 |
I![[4 with combining macron]](https://www.rsc.org/images/entities/char_0034_0304.gif) |
5.434 | 5.434 | 10.856 | 90.00 | 90.00 | 90.00 | −369.13 |
| Optimised | 5.383 | 5.383 | 10.727 | 89.98 | 89.99 | 89.99 | |||
| Cu | Initial |
Fm![[3 with combining macron]](https://www.rsc.org/images/entities/char_0033_0304.gif) m m |
3.615 | 3.615 | 3.615 | 90.00 | 90.00 | 90.00 | |
| Optimised | 3.567 | 3.567 | 3.567 | 90.00 | 90.00 | 90.00 | |||
| Zn | Initial | P63/mmc | 2.665 | 2.665 | 4.947 | 90.00 | 90.00 | 120.00 | |
| Optimised | 2.614 | 2.614 | 4.775 | 90.00 | 90.00 | 120.00 | |||
| β-Sn | Initial | I41/amd | 4.589 | 4.589 | 4.589 | 60.00 | 60.00 | 60.00 | |
| Optimised | 4.614 | 4.614 | 4.614 | 60.10 | 60.10 | 60.10 | |||
| α-S | Initial43 | Fddd | 14.349 | 14.237 | 7.885 | 74.74 | 73.21 | 32.01 | |
| Optimised | 13.788 | 13.283 | 8.335 | 75.15 | 68.51 | 36.02 | |||
| Cu2S | Initial44 | P21/c | 14.424 | 11.865 | 13.003 | 90.00 | 116.77 | 90.00 | −46.24 |
| Optimised | 14.870 | 11.744 | 13.095 | 90.00 | 115.97 | 90.00 | |||
| SnS | Initial43 | Pnma | 11.106 | 3.989 | 4.238 | 90.00 | 90.11 | 90.08 | −97.70 |
| Optimised | 11.083 | 3.982 | 4.229 | 90.00 | 90.00 | 90.00 | |||
| SnS2 | Initial |
P![[3 with combining macron]](https://www.rsc.org/images/entities/char_0033_0304.gif) ml ml |
3.605 | 3.605 | 5.460 | 90.00 | 90.00 | 120.00 | −120.97 |
| Optimised | 3.654 | 3.654 | 6.016 | 89.95 | 90.04 | 120.00 | |||
| ZnS | Initial |
F![[4 with combining macron]](https://www.rsc.org/images/entities/char_0034_0304.gif) 3m 3m |
3.822 | 3.822 | 3.822 | 60.00 | 60.00 | 60.00 | −156.74 |
| Optimised | 3.789 | 3.789 | 3.789 | 59.98 | 59.98 | 59.98 | |||
2.4 Sulfur vapours
The thermochemistry of sulfur has been studied relatively lightly given its abundance and the scale of application. While sulfur vapours are known to consist of a series of rings from S8 down to the dimer S2, data for the intermediate rings and equilibrium mixtures is relatively scarce. Standard thermochemical tables prefer to treat the gas phase as an ideal diatomic gas, as do other treatments of the CZTS equilibrium.2,23,26 However, the vapour phase of sulfur is thought to contain a mixture of the cyclic allomorphs, and even above 1200 K may only be around 70% S2.46–48In the condensed phase, the stable structure α-S is a molecular solid formed of packed S8 rings. In the absence of a comprehensive model, calculations here consider α-S solid and the S2 and S8 vapours; the true behaviour of the mixture is expected to be somewhere between the effect of these pure species. DFT-optimised structures were used for the ground state energies of the S2 dimer and S8 ring. Temperature-dependent data was drawn from the NIST-JANAF thermochemical data tables; these are based on spectroscopy and assume ideal behaviour.26
3 Results
We begin by reporting the vibrational properties for each solid compound of interest. The resulting thermodynamic potentials are then combined to assess the formation of CZTS with respect to its constituent elements and isovalent binary sulfides. Finally the decomposition liberating SnS and sulfur vapour is considered.3.1 Lattice dynamics
Optimised ground-state lattice parameters are given in Table 2. The only significant shifts in structure are for α-S (a large, soft, molecular crystal) and to a lesser extent the c parameters of Zn metal and SnS2, which are weakly bound. Following the procedure outlined above, phonon densities of states and band structures were computed for CZTS, Cu, Sn, Zn, α-S, Cu2S, ZnS, and SnS2. While there have been isolated reports of individual phases, this is the first consistent collection of phonon data for these materials.The phonon dispersion for CZTS is shown in Fig. 2, while the remaining curves are available in the ESI.† The general behaviour is similar to previous work by Khare et al., but lacks LO-TO splitting at the Γ point, which was not considered in this case.49 The 16-atom unit cell of kesterite results in 48 (3N) modes. There are two blocks of bands, which spread from 0 to 171 cm−1 and from 251 to 350 cm−1. The calculated phonon density of states (DOS) (Fig. 2) shows activity between around 270 and 250 cm−1; from experimental studies the Raman spectrum is known to contain two distinct peaks at about 286 and 337 cm−1 (A1 modes).11
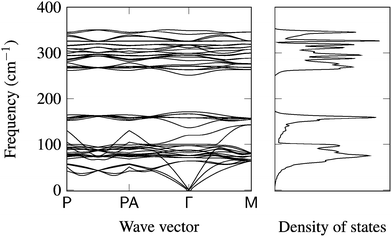 | ||
| Fig. 2 Phonon band structure and density of states for kesterite CZTS (tetragonal unit cell) with 16 atoms and 48 vibrational modes. All other dispersion plots are included in ESI.† | ||
The associated total energies and thermal properties have been packaged into a Python code for ease of use and manipulation. These are also available as ESI, and as part of a continuing project online.†
3.2 Standard thermodynamic properties of CZTS
| 2Cu + Zn + Sn + 4S ⇌ Cu2ZnSnS4 | (11) |
The standard formation enthalpy of kesterite CZTS at 298.15 K and under 1 bar of pressure is calculated to be −3.83 eV per formula unit (−369.1 kJ mol−1). At standard conditions the effect of temperature and pressure is small (<1 meV) as there is no gas component to the reaction. However, stability is determined by the Gibbs free energy of formation, ΔGf.
The free energy of formation is plotted against temperature and pressure in Fig. 3. The effect of pressure is negligible due to assumed solid incompressibility and absence of a gas phase.
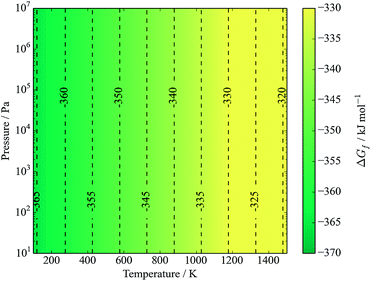 | ||
| Fig. 3 Gibbs free energy of formation of kesterite CZTS from elements in their standard states (eqn (12)). Contours represent energies in kJ mol−1. S is in the solid α-sulfur phase. The y-axis represents pressure from an inert gas or mechanical force. | ||
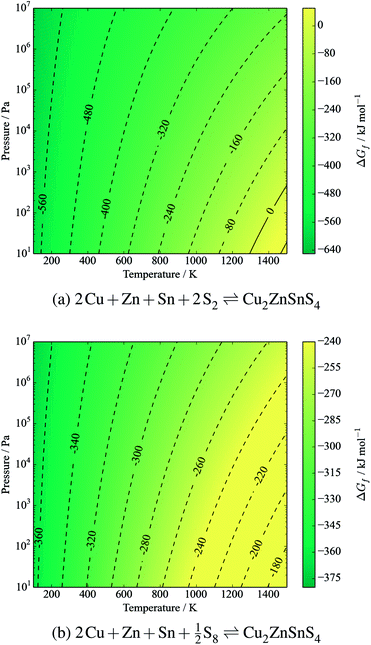
It is clear that CZTS is thermodynamically stable with respect to its solid elemental precursors over all reasonable processing conditions. Considering the equilibrium with sulfur vapours:
| 2Cu + Zn + Sn + 2S2(g) ⇌ Cu2ZnSnS4 | (12) |
 | (13) |
3.3 Stability of CZTS relative to binary sulfides
The binary sulfides are of interest both in terms of routes to forming CZTS and possible disproportionation reactions. Note that for a stoichiometric mixture, there is no dependence on the chemical potential of elemental sulfur:| Cu2S + ZnS + SnS2 ⇌ Cu2ZnSnS4, | (14) |
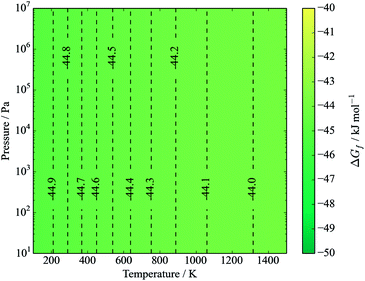 | ||
| Fig. 5 Gibbs free energy of formation of kesterite from binaries (eqn (15)). Contours represent energies in kJ mol−1. The y-axis represents pressure from an inert gas or mechanical force. | ||
If we instead consider decomposition to Sn metal, due to an instability of SnS2, then a dependence appears as sulfur is released (Fig. 6) following the reaction
| Cu2ZnSnS4 ⇌ Cu2S + ZnS + Sn + S2(g). | (15) |
 | (16) |
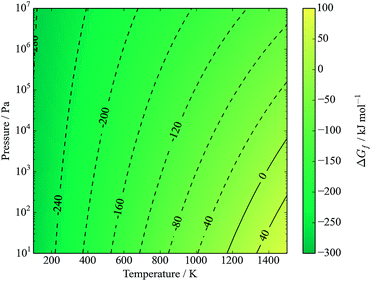 | ||
| Fig. 6 Gibbs free energy of formation of kesterite from binaries, tin and sulfur vapour (eqn (16)). Contours represent energies in kJ mol−1. The y-axis represents the partial pressure of S2. | ||
Note that eqn (17) appears identical to eqn (2); the only difference is that SnS is here defined as being the bulk solid, while it is understood that in the actual mechanism the SnS likely forms a reactive surface and may even be adsorbed to a CZTS or ZnS bulk phase. Application of the model at high (∼1 bar) partial pressures of sulfur suggests that such decomposition is not expected below temperatures of around 1300 K. Fig. 7 shows that CZTS becomes unstable following this process at around 600 K and above for very low partial pressures of S2. The stability window is found to be almost identical to that predicted by kinetic modelling of experimental data (see Fig. 5 of ref. 23).
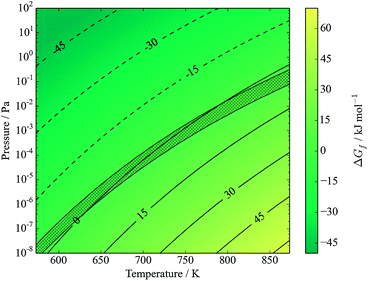 | ||
| Fig. 7 Gibbs free energy of formation of kesterite from binary compounds, with SnS in equilibrium with S2 vapours (eqn (17)). Contours represent energies in kJ mol−1. The y-axis represents the partial pressure of S2. Hatched area shows predicted transition region from kinetic modelling, figure 5 of ref. 23. Note low pressure and reduced temperature range relative to other figures; this is for ease of comparison with ref. 23. | ||
The agreement is especially interesting given that the kinetic model of Scragg et al. is based on SnS vapours (which were introduced as a gas stream in the accompanying experiment), while the result is reproduced here in an ab initio thermodynamic model with no such phase.23 This model does not consider the evaporation of solid SnS, and as such is equivalent to the two-step model (eqn (2) and (3)) given a saturated SnS vapour phase. It is reasonable to expect that the direct formation of SnS vapour would offer a higher entropy gain, lowering the free energy further and hence promoting decomposition; this would be equivalent to same two-step model with a very low partial pressures of SnS.
Direct comparison to experimental syntheses of CZTS is difficult as stability curves have not been measured directly, but it is possible to interpret experimental results where the conditions are reported clearly. At typical formation temperatures of 700–800 K we find that decomposition is only expected where there is a significant absence of sulfur in the atmosphere. Given that sulfur solids have a vapour pressure of the order 100 kPa in this temperature range, this would only be expected to occur where sulfur is limited or vapours are removed by a vacuum pump.25 Ericson et al. successfully produced CZTS films by reactive sputtering followed by annealing in a static argon atmosphere of 35 kPa at 560°; given that they observed a correlation between sulfur loss and temperature during sputtering, we would assume that the sulfur was sufficiently mobile to form an equilibrium pressure during annealing.19 Redinger et al. observed decomposition at 560 °C under “vacuum”; this is in agreement with our model provided that their vacuum pump maintained a sulfur partial pressure of around 0.1 Pa (10−3 mbar) or less.50
4 Conclusions
Based on first-principles total energy calculations, a thermodynamic model has been developed to describe the formation and stability of CZTS with respect to its elemental constituents and stoichiometric binary sulfides, as well as the tin monosulfide which is known to play an active role. Reactions involving solid and gaseous sulfur have been considered, the latter of which introduces a substantial temperature and pressure dependence. Temperature and pressure conditions have been related to the phase equilibrium; they indicate higher decomposition temperatures than those observed experimentally, but otherwise broadly similar behaviour. These results, which are ab initio except for the reference data for sulfur vapours, closely reproduce a previous model which was derived from experimental results and reference data.23 It is clear that the pressure–temperature interaction is strong in near-vacuum conditions.This initial model is based on a number of approximations that could be removed in future work. These include the effects of thermal expansion and compressibility on the solid phases and the non-ideality of the S vapour. There is always a compromise between accuracy and computational cost, especially as future models will be extended to consider competitive ternary and quaternary phases, in addition to metallic alloys. One issue with rigorous validation of the model is the scarcity of experimental thermodynamic data so far. We suggest that high-temperature near-vacuum experiments need to control and report the annealing pressure carefully if they are to be reproducible and aid understanding of the phase equilibria of multi-component semiconductors such as Cu2ZnSnS4.
Acknowledgements
We acknowledge L. M. Peter for useful discussions and J. J. Scragg for providing access to his kinetic modelling data. A.W. acknowledges support from the Royal Society for a University Research Fellowship and A.J.J. is funded by EPSRC (Grant no. EP/G03768X/1) through the Doctoral Training Centre in Sustainable Chemical Technologies. We acknowledge use of Hartree Centre resources in this work. The STFC Hartree Centre is a research collaboratory in association with IBM providing High Performance Computing platforms funded by the UK's investment in e-Infrastructure. Via our membership of the UK's HPC Materials Chemistry Consortium, which is funded by EPSRC (EP/L000202), this work made use of the facilities of HECToR, the UK's national high-performance computing service, which is provided by UoE HPCx Ltd at the University of Edinburgh, Cray Inc and NAG Ltd, and funded by the Office of Science and Technology through EPSRC's High End Computing Programme.References
- Handbook of Photovoltaic Science and Engineering, ed. A. Luque and S. Hegedus, John Wiley & Sons, Chichester, 2003 Search PubMed.
- J. J. Scragg, P. J. Dale, D. Colombara and L. M. Peter, ChemPhysChem, 2012, 13, 3035–3046 CrossRef CAS PubMed.
- K. Ito and T. Nakazawa, Jpn. J. Appl. Phys., 1988, 27, 2094–2097 CrossRef CAS.
- S. Chen, X. G. Gong, A. Walsh and S.-H. Wei, Appl. Phys. Lett., 2009, 94, 041903 CrossRef PubMed.
- W. Wang, M. T. Winkler, O. Gunawan, T. Gokmen, T. K. Todorov, Y. Zhu and D. B. Mitzi, Adv. Energy Mater., 2013 DOI:10.1002/aenm.201301465.
- B. Shin, O. Gunawan, Y. Zhu, N. A. Bojarczuk, S. J. Chey and S. Guha, Prog. Photovolt: Res. Appl., 2013, 21, 72–76 CrossRef CAS.
- J. J. Scragg, P. J. Dale, L. M. Peter, G. Zoppi and I. Forbes, Phys. Status Solidi B, 2008, 245, 1772–1778 CrossRef CAS.
- H. Katagiri, K. Jimbo, W. S. Maw, K. Oishi, M. Yamazaki, H. Araki and A. Takeuchi, Thin Solid Films, 2009, 517, 2455 CrossRef CAS PubMed.
- C. Wadia, A. P. Alivisatos and D. M. Kammen, Environ. Sci. Technol., 2009, 43, 2072–2077 CrossRef CAS.
- D. J. C. Mackay, Philos. Trans. R. Soc., A, 2013, 371, 20110431 CrossRef PubMed.
- X. Fontané, L. Calvo-Barrio, V. Izquierdo-Roca, E. Saucedo, A. Pérez-Rodriguez, J. R. Morante, D. M. Berg, P. J. Dale and S. Siebentritt, Appl. Phys. Lett., 2011, 98, 181905 CrossRef PubMed.
- S. Chen, J.-H. Yang, X. G. Gong, A. Walsh and S.-H. Wei, Phys. Rev. B: Condens. Matter Mater. Phys., 2010, 81, 254204 Search PubMed.
- A. Walsh, S. Chen, S.-H. Wei and X.-G. Gong, Adv. Energy Mater., 2012, 2, 400–409 CrossRef CAS.
- M. Mousel, T. Schwarz, R. Djemour, T. P. Weiss, J. Sendler, J. C. Malaquias, A. Redinger, O. Cojocaru-Mirédin, P.-P. Choi and S. Siebentritt, Adv. Energy Mater., 2013, 4(2), 1300543 Search PubMed.
- S. Ahmed, K. B. Reuter, O. Gunawan, L. Guo, L. T. Romankiw and H. Deligianni, Adv. Energy Mater., 2012, 2, 253–259 CrossRef CAS.
- A. Weber, R. Mainz, H. W. Schock and I. I. Experimental, J. Appl. Phys., 2010, 107, 013516 CrossRef PubMed.
- Q. Guo, G. M. Ford, W.-C. Yang, B. C. Walker, E. a. Stach, H. W. Hillhouse and R. Agrawal, J. Am. Chem. Soc., 2010, 17384–17386 CrossRef CAS PubMed.
- H. Katagiri, N. Sasaguchi, S. Hando, S. Hoshino, J. Ohashi and T. Yokota, Sol. Energy Mater. Sol. Cells, 1997, 49, 407–414 CrossRef CAS.
- T. Ericson, J. J. Scragg, T. Kubart, T. Törndahl and C. Platzer-Björkman, Thin Solid Films, 2013, 535, 22–26 CrossRef CAS PubMed.
- A. Fairbrother, X. Fontané, V. Izquierdo-Roca, M. Placidi, D. Sylla, M. Espindola-Rodriguez, S. López-Mariño, F. A. Pulgarín, O. Vigil-Galán, A. Pérez-Rodríguez and E. Saucedo, Prog. Photovolt: Res. Appl., 2014, 479–487 CrossRef CAS.
- L. A. Burton and A. Walsh, Appl. Phys. Lett., 2013, 102, 132111–132111 CrossRef PubMed.
- P. Sinsermsuksakul, K. Hartman, S. Bok Kim, J. Heo, L. Sun, H. Hejin Park, R. Chakraborty, T. Buonassisi and R. G. Gordon, Appl. Phys. Lett., 2013, 102, 053901 CrossRef PubMed.
- J. J. Scragg, T. Ericson, T. Kubart, M. Edoff and C. Platzer-Björkman, Chem. Mater., 2011, 23, 4625–4633 CrossRef CAS.
- J. J. Scragg, T. Kubart, J. T. Wätjen, T. Ericson, M. K. Linnarsson and C. Platzer-Björkman, Chem. Mater., 2013, 25, 3162–3171 CrossRef CAS.
- D. R. Lide, CRC Handbook, CRC Press, London, 83rd edn, 2002 Search PubMed.
- M. J. Chase, J. Phys. Chem. Ref. Data, Monogr., 1998, 9, 1–1951 Search PubMed.
- B. G. Mendis, M. D. Shannon, M. C. Goodman, J. D. Major, R. Claridge, D. P. Halliday and K. Durose, Prog. Photovolt: Res. Appl., 2014, 22, 24–34 CrossRef CAS.
- T. Schwarz, O. Cojocaru-Miredin, P. Choi, M. Mousel, A. Redinger, S. Siebentritt and D. Raabe, Appl. Phys. Lett., 2013, 102, 042101 CrossRef PubMed.
- J. J. S. Scragg, L. Choubrac, A. Lafond, T. Ericson and C. Platzer-Björkman, Appl. Phys. Lett., 2014, 104, 041911 CrossRef PubMed.
- R. P. Stoffel, C. Wessel, M.-W. Lumey and R. Dronskowski, Angew. Chem., Int. Ed., 2010, 49, 5242–5266 CrossRef CAS PubMed.
- K. Reuter, C. Stampfl and M. Scheffler, Handbook of Materials Modeling, Part A. Methods, Springer, Berlin, 2005, pp. 149–234 Search PubMed.
- K. Reuter and M. Scheffler, Phys. Rev. B: Condens. Matter Mater. Phys., 2001, 65, 035406 CrossRef.
- A. Soon, M. Todorova, B. Delley and C. Stampfl, Phys. Rev. B: Condens. Matter Mater. Phys., 2007, 75, 125420 CrossRef.
- A. J. Jackson and A. Walsh, Phys. Rev. B: Condens. Matter Mater. Phys., 2013, 88, 165201 CrossRef.
- V. Blum, R. Gehrke, F. Hanke, P. Havu, V. Havu, X. Ren, K. Reuter and M. Scheffler, Comput. Phys. Commun., 2009, 180, 2175–2196 CrossRef CAS PubMed.
- V. Havu, V. Blum, P. Havu and M. Scheffler, J. Comput. Phys., 2009, 228, 8367–8379 CrossRef CAS PubMed.
- J. Perdew, A. Ruzsinszky, G. Csonka, O. Vydrov, G. Scuseria, L. Constantin, X. Zhou and K. Burke, Phys. Rev. Lett., 2008, 100, 136406 CrossRef.
- J. Moreno and J. Soler, Phys. Rev. B: Condens. Matter Mater. Phys., 1992, 45, 13891–13898 CrossRef.
- K. Parlinski, Z. Q. Li and Y. Kawazoe, Phys. Rev. Lett., 1997, 78, 4063–4066 CrossRef CAS.
- A. Togo, F. Oba and I. Tanaka, Phys. Rev. B: Condens. Matter Mater. Phys., 2008, 78, 134106 CrossRef.
- S. Chen, X. G. Gong, A. Walsh and S.-H. Wei, Appl. Phys. Lett., 2010, 96, 021902 CrossRef PubMed.
- D. Fletcher, R. McMeeking and D. Parkin, J. Chem. Inf. Model., 1996, 36, 746–749 CrossRef CAS.
- L. A. Burton and A. Walsh, J. Phys. Chem. C, 2012, 116, 24262–24267 CAS.
- Q. Xu, B. Huang, Y. Zhao, Y. Yan, R. Noufi and S.-H. Wei, Appl. Phys. Lett., 2012, 100, 061906 CrossRef PubMed.
- O. Madelung, Semiconductors: Data Handbook, Springer-Verlag, Berlin, 3rd edn, 2004 Search PubMed.
- J. R. West, Ind. Eng. Chem., 1950, 209, 713–718 CrossRef.
- J. Berkowitz and J. Marquart, J. Chem. Phys., 1963, 39, 275–283 CrossRef CAS PubMed.
- H. Rau, T. Kutty and J. Guedes De Carvalho, J. Chem. Thermodyn., 1973, 5, 833–844 CrossRef CAS.
- A. Khare, B. Himmetoglu, M. Johnson, D. J. Norris, M. Cococcioni and E. S. Aydil, J. Appl. Phys., 2012, 111, 083707 CrossRef PubMed.
- A. Redinger, D. M. Berg, P. J. Dale and S. Siebentritt, J. Am. Chem. Soc., 2011, 133, 3320–3323 CrossRef CAS PubMed.
Footnotes |
| † Electronic supplementary information (ESI) available: Material properties and thermodynamic data implemented as Python modules. Source code for free energy surface plots. See DOI: 10.1039/c4ta00892h |
| ‡ The project is hosted at http://github.com/WMD-Bath/CZTS-model and a current snapshot is included in the ESI. |
| § Phonopy is an open source code developed by Atsushi Togo from the earlier package FROPHO. It is available from http://phonopy.sourceforge.net |
| This journal is © The Royal Society of Chemistry 2014 |

