 Open Access Article
 This Open Access Article is licensed under a Creative Commons Attribution-Non Commercial 3.0 Unported Licence
Tuning the pore size of ZnO nano-grids via time-dependent solvent annealing†
Kuhu
Sarkar
a,
Christoph J.
Schaffer
a,
Daniel Moseguí
González
a,
Anna
Naumann
a,
Jan
Perlich
b and
Peter
Müller-Buschbaum
*ac
aTechnische Universtität München, Physik-Department, Lehrstuhl für Funktionelle Materialien, James-Franck-Straße 1, 85748 Garching, Germany. E-mail: muellerb@ph.tum.de; Fax: +49 (89) 289-12473; Tel: +49 (89) 289-12451
bDeutsches Elektronen-Synchrotron DESY, Notkestraße 85, 22607 Hamburg, Germany
cNanosystems Initiative Munich, Schellingstraße 4, 80799 München, Germany
First published on 20th February 2014
Abstract
Via a block copolymer-assisted sol–gel synthesis route, zinc oxide (ZnO) thin films are obtained with a nanogrid-like morphology. During annealing of the hybrid ZnO films, the templating polymer undergoes structural rearrangements. Solvent annealing is done using tetrahydrofuran (THF) vapor and hence used as a tool to tune the pore size of the final grid-like films. A calcination step is performed to remove the polymer template and to study the effect of solvent annealing on the final ZnO nano-grid film. The surface structures of the films are investigated via scanning electron microscopy (SEM) and atomic force microscopy (AFM). In addition, the evolution in the structural length scales in the film volume is probed using grazing incidence small angle X-ray scattering (GISAXS).
Introduction
Structural modifications/evolutions of block copolymer films have been studied to a great extent regarding their self-assembling properties.1–5 Such modifications produce a large range of well-defined nanostructures and are mostly observed under the influence of an external stimulus. The long-range order in block copolymers is mainly reported to be induced by modification of interfacial tension between the blocks, application of an electric field, introduction of a patterned substrate or by subjecting the system to a gradient of temperature or shear.6–11Amongst the wide range of diblock copolymers available, the ones belonging to the class of poly(styrene-block-4-vinylpyridine), abbreviated as P(S-b-4VP), have gained considerable attention for structural evolution studies.12,13 Investigation is not constrained to structural modifications in pure bulk copolymers under an external perturbation, but has spread to exploration of thin films as well. The block copolymers, moreover, are now being associated with different small molecules to form supramolecular assemblies (SMA). Pioneering work in this field was reported by Nandan et al. and Huang et al.1,14 The small molecules preferentially attach to one of the blocks of the copolymer via weak secondary bonds, thereby affecting the structural evolution and behavior of the whole system towards an applied stimulus.15 Inspired by the on-going research, a step forward is taken to utilize the self-assembling properties of the copolymers to manipulate the length scale of inorganic nanostructures. Thereby, the structural modifications in a block copolymer film are transferred to the inorganic material present in the block copolymer template. Such nanostructured thin films with tunable length scales find applications in sensing, catalysis and energy storage.14,16–18
In the present study, P(S-b-4VP) is used as the matrix to host inorganic metal oxide nanostructures, in particular zinc oxide (ZnO), synthesized in association with a sol–gel chemistry-based approach. This type of synthesis of various inorganic metal oxides has been documented as an efficient way of producing a myriad of morphologies, as shown for example by Smarsly, Wiesner and their coworkers.18–21 Whereas, such a synthesis is widely used in the case of titania22,23 or other transparent conducting oxides (TCO), ZnO nanostructure synthesis is so far only rarely reported.24,25 Zinc acetate dihydrate (ZAD) is used as a commercial source of ZnO in this system. During the sol–gel preparation a mixture of good and poor solvents is used in order to preferentially dissolve both or one of the blocks of the amphiphilic template. This induces micro-phase separation in the template, which results in the formation of micelles in the solution. Depending on the weight fraction of the different solvents and the precursor used for the process, different structures of the micelles arise which then lead to the formation of different final morphologies in the film.24 This is one of the major advantages of the block copolymer-assisted sol–gel route as compared to other methods, which fail to produce multiple morphologies using the same ingredients and production protocol. In the system under consideration, a certain weight fraction combination of the solvents and the precursor is chosen. The particular chosen combination gives rise to a nanogrid-like morphology of the films. The morphology is very promising owing to its potential applications as photonic devices, photocatalysts or chemical/gas sensors. As an example, the grid-like ZnO nanostructured film is investigated as an active material in a dye-sensitized solar cell. The details about the preparation and functioning of the device are explained in the ESI,† since this is not the main focus of this work. In order to explore further applications, it is interesting to develop a route in order to tune the length scale of such a grid to suit any particular device requirement, and at the same time keeping the unique morphology intact. Although the sol–gel synthesis route imparts flexibility to tune the nanostructured morphologies obtained in the final film, it imposes limitations in terms of the obtained length scales of the nanostructures. This restriction is mainly related to the block lengths of the copolymer template, signifying the use of different copolymer templates for different required length scales, which is not always practically feasible. In order to overcome this limitation, post-treatment of the synthesized nanostructured films is performed to tune the length scales. To serve this purpose, a suitable solvent vapor treatment to the copolymer/ZnO hybrid films is provided. This step is undertaken considering the property of the block copolymer to rearrange under the influence of an external solvent vapor stimulus.26 The process, commonly known as solvent vapor annealing, has been utilized considerably for influencing nanoscale morphological changes in the block copolymer, extensively reported by Russell and coworkers.27–29 Recently, the influence of the solvent vapor on the morphology of a conjugated polymer has also been investigated to find applications in organic photovoltaics.30–32 So far, by monitoring structural evolution in pure block copolymer films under a solvent vapor environment, the micro-phase separation in the block copolymer is reported to be the most common phenomenon depending on the selectivity of the solvent vapor used. However, the uniqueness in the present study lies in the fact that the impact of the solvent annealing procedure is studied on films which have already undergone micro-phase separation during the sol–gel process and in addition are incorporated with the ZnO precursor. The structural rearrangements in the template get transferred to the ZnO network in the polymeric template. The final ZnO morphology stays unchanged as long as the film is stable, while only the length scales vary. The main focus of this work is, however, to study the final ZnO nanostructured morphology and the tunability of the length scales of these structures, for which the diblock copolymer template is removed via a high temperature treatment after the exposure of the hybrid films to a suitable solvent vapor for a given time period. Tetrahydrofuran (THF) is used as the solvent for all the present experiments. It is a good solvent for both the blocks of the template, but slightly selective towards the PS block. Since the micro-phase separation in the block copolymer is already induced during the sol–gel process, the presence of the ZnO precursor molecules in the diblock copolymer matrix plays an important role in controlling the morphology of the final films.
Both, real and reciprocal space techniques are used in order to follow the structural evolution of the ZnO nanostructures in the matrix of the diblock copolymer template under THF vapor annealing. Atomic force microscopy (AFM) and scanning electron microscopy (SEM) have been performed for determining the change in the surface morphology as a function of different annealing times. Grazing incidence small angle X-ray scattering (GISAXS) is used for further probing the morphology in the film volume as a function of short annealing times.
Experimental section
Materials
The diblock copolymer template, poly(styrene-block-4-vinylpyridine), (P(S-b-4VP)) was obtained from Polymer Source Inc., Canada, and used as received. The number average molecular weights, Mn, for the PS and the P4VP blocks were 11.8 and 11.5 kg mol−1, with a polydispersity index of 1.04. The ZnO precursor, namely zinc acetate dihydrate (ZAD; 99.999% trace metal basis) was obtained from Sigma-Aldrich with a density of 1.84 g cm−3. N,N-Dimethylformamide (DMF; analytical reagent grade 99.99%) and tetrahydrofuran (THF) were purchased from Carl Roth GmbH + Co. KG.Fabrication of the nanogrid-like morphology via the sol–gel approach
The weight fraction of DMF, water and ZAD was chosen to be 0.86![[thin space (1/6-em)]](https://www.rsc.org/images/entities/char_2009.gif) :0.01:0.13 in order to obtain the nanogrid-like morphology. Fig. 1 provides a schematic representation of the ZnO thin film preparation routine and its post-treatment with the THF solvent vapor. The polymer was first dissolved in DMF and stirred for 30 minutes. ZAD was dissolved separately in DMF and also stirred for 30 minutes. Afterwards, the required amount of water was added to the polymer solution, followed by stirring again for 30 minutes. Both, the polymer and the ZAD solutions, were filtered using a polytetrafluoroethylene (PTFE) filter with 0.45 μm pore diameter. Finally, both solutions were mixed together using a syringe pump, PHD 2000 infuse/withdraw, Harvard Apparatus, by using a constant infuse rate of 1 mL min−1. The sol–gel containing micellar solution of the diblock copolymer along with ZAD being preferentially incorporated in the P4VP block of the template was obtained, Fig. 1(a). The solution was then coated (2000 rpm; 60 s; 400 rounds per s; open cover; Delta 6 RC TT, Süss MicroTec) on acid-cleaned silicon substrates, Fig. 1(b).33
:0.01:0.13 in order to obtain the nanogrid-like morphology. Fig. 1 provides a schematic representation of the ZnO thin film preparation routine and its post-treatment with the THF solvent vapor. The polymer was first dissolved in DMF and stirred for 30 minutes. ZAD was dissolved separately in DMF and also stirred for 30 minutes. Afterwards, the required amount of water was added to the polymer solution, followed by stirring again for 30 minutes. Both, the polymer and the ZAD solutions, were filtered using a polytetrafluoroethylene (PTFE) filter with 0.45 μm pore diameter. Finally, both solutions were mixed together using a syringe pump, PHD 2000 infuse/withdraw, Harvard Apparatus, by using a constant infuse rate of 1 mL min−1. The sol–gel containing micellar solution of the diblock copolymer along with ZAD being preferentially incorporated in the P4VP block of the template was obtained, Fig. 1(a). The solution was then coated (2000 rpm; 60 s; 400 rounds per s; open cover; Delta 6 RC TT, Süss MicroTec) on acid-cleaned silicon substrates, Fig. 1(b).33
 | ||
| Fig. 1 Schematic representation of the steps involved in the fabrication of ZnO composite thin films and solvent annealing: (a) preparing ZnO sol–gel solution, (b) spin-coating the polymer/ZnO nanocomposite film, (c) solvent annealing in THF vapor for different times, (d) high temperature calcination step to obtain the nanostructured ZnO film. | ||
Solvent vapor annealing of the polymer/ZnO hybrid films
The obtained copolymer/ZnO nanocomposite thin films were exposed to THF solvent vapor in a desiccator under ambient conditions for different time scales ranging from 3 to 48 hours as represented in Fig. 1(c). Different solvent annealing times allow for tracing the structural evolution in the thin films due to rearrangement of the copolymer molecules. The solvent-annealed films are subsequently calcined at 400 °C in air for 30 minutes in a tube furnace, RETTH 230/3, GERO Hochtemperaturöfen GmbH, with a heating rate of 5.78 °C min−1. During the calcination step, the polymer template was sacrificed and, moreover, the remaining amorphous ZnO phase got transformed to a crystalline phase. The resulting structure was a ZnO grid-like morphology, which had different average pore sizes owing to different solvent annealing times, Fig. 1(d).Characterization
The surface morphology of the nanocomposite and the calcined films was probed using scanning electron microscopy (SEM). The measurements were performed with a Zeiss Gemini NVision 40 field emission scanning electron microscope (5.0 kV, working distance 3.5 mm, aperture 10 μm). The images were processed using the ImageJ 1.42q software.34In order to obtain information about the structural heights and the root mean square (rms) roughness of the calcined films, atomic force microscopy (AFM) measurements were performed. The surface topography images were obtained using an Autoprobe CP Research (Veeco Metrology Group) instrument. A triangular silicon cantilever was used to mount the conical silicon tip covered with gold and having a curvature of 10 nm (Ultralever cantilevers), with a resonance frequency of 100 kHz. The images were recorded with a (2 × 2) μm size consisting of 256 line scans. The 2d images were processed using Gwyddion v2.20 software for background correction.
GISAXS measurements were performed at the BW4 beamline of the DORIS III storage ring at DESY, Hamburg.35 Details of the beamline are reported elsewhere.36 The parameters of the GISAXS measurements were kept constant for all the samples. The selected incident angle of the X-ray beam was 0.36° and a sample–detector distance of 1.99 m was used. The scattering signal was detected using a MAR CCD detector with a pixel size of (79.1 × 79.1) μm2.
Results and discussion
Solvent annealing is a simple and efficient strategy to control the length scales of a nanostructured film. It promotes the advantage of preserving the thin film morphology under a given time frame, over other techniques to tune the structural length scales. Depending on the system under consideration, the structural evolution via solvent annealing is a slow process which is easy to follow for a complete understanding of the reorganizational processes taking place in the films.Surface structures
The SEM surface images of the polymer/ZnO hybrid films subjected to THF solvent vapor annealing are shown in Fig. 2 (left column) for different annealing times. The solvent-annealed films are subsequently calcined in order to investigate the effect on the remaining ZnO film. The SEM images of these calcined films are shown in Fig. 2 (right column). For reference, the hybrid and the calcined films without any solvent vapor treatment are also investigated. All the samples produced are homogeneous on a large scale (2.4 × 2) cm2. It is observed that the hybrid as well as the calcined films in general, show an ordered nanogrid-like morphology. The nanostructured morphology of the thin films synthesized via the block copolymer-assisted sol–gel route is preserved also after calcination as seen from the SEM images, indicating a successful templating of ZnO nanostructures via the diblock copolymer template. It should be noted that all calcined films mentioned in the text are solvent-treated for different times prior to calcination. The differences in the structures of the solvent-annealed and the calcined films for shorter solvent annealing times (3 to 12 hours) are not very prominent from the surface images. In contrast, for a longer solvent annealing time of 48 hours, there is a clear change in the morphology of the films (Fig. 2). The structural evolution in terms of length scales is, however, not easily visible. Upon thorough analysis of the SEM data, it is found that the average pore sizes of the ZnO grid for the calcined films increase with increasing solvent annealing time. The average pore sizes for the calcined films increase from approximately 11 nm for the untreated film to up to 20 nm for the film calcined after a solvent treatment of 12 hours. After 48 hours of solvent annealing and subsequent calcination, the change in length scales of the nanostructures is prominent, subjected to the formation of large ZnO clusters present all over the substrate. Apart from the variations in the length scales of the pores, the surface roughness of the films also varies with different solvent annealing times. This is more evident for the ZnO films solvent-treated for 9, 12 and 48 hours and is observed as bright and dark patches in the SEM images of the corresponding solvent-annealed films. | ||
| Fig. 2 SEM surface images of the ZnO nanostructured films obtained via sol–gel synthesis showing a nanogrid-like morphology, being subjected to THF vapor annealing for different time scales. Left column: (a) film without any annealing, followed by (b) solvent annealing for 3 hours, (c) 9 hours, (d) 12 hours, and (e) 48 hours. Right column: the corresponding films calcined at 400 °C after the THF solvent vapor treatment. | ||
In order to determine the height of the surface structures and the surface roughness, AFM measurements are performed on the calcined samples which have already been solvent vapor-treated for the above-mentioned times. The topography images for these samples are shown in Fig. 3. A clear morphological trend towards larger surface structures is observed with increasing solvent annealing time. The brighter regions are associated with the domains of larger heights which contribute to the surface roughness of the films. The rms roughness of the films for shorter solvent annealing times of up to 12 hours is in the range of approximately 2 nm, whereas, after 48 hours of solvent annealing, the same increases up to (12.6 ± 1) nm.
 | ||
| Fig. 3 AFM topography images of the calcined ZnO nanostructured films subjected to THF vapor treatment before the calcination step for (a) 0, (b) 3, (c) 9, (c) 12 and (e) 48 hours. All the images are (2 × 2) μm2 and the scale bar for all the images is 1 μm long. The color bar as insets in the images indicates the height of the nanostructures in nm. | ||
Inner film structures
Although a clear indication of the structural evolution on the film surfaces is obtained from the real-space imaging techniques, these structures might not extend into the inner film volume. Moreover, it is quite challenging to follow the change in length scales of the nanostructures occurring during short annealing times. A quantitative analysis of the length scales is important in order to develop the accurate routine to tune the structures for a specific requirement. To effectively address the prerequisite, grazing incidence small angle X-ray scattering (GISAXS) has been performed on the solvent-annealed and calcined samples to probe the structural transitions in the bulk of the films.35 This powerful technique enables even to probe the minor structural fluctuations in the length scale of nanostructures in a quantitative way.35,37The 2d scattering patterns obtained from the measurements for all samples are shown in Fig. 4. As seen in common in these scattering patterns, the specular reflection (at an exit angle equal to the incident angle) is shielded by a beamstop to avoid the over saturation of the detector. In addition a rod shaped beamstop shielding the region along qy = 0 is also installed, in order to allow for increased data acquisition time and thereby enhanced scattering signal-to-noise ratio at the high qy region.38–41 Other than the specular peak, another high intensity peak known as the Yoneda peak is observed at the critical angle of the material.42 Another interesting feature observed from the signals of the solvent-annealed films is related to the azimuthal scattering ring (marked by the white dashed curve exemplarily for the film solvent-annealed for 3 hours in Fig. 4) for solvent annealing times up to 12 hours. The presence of such a signal corresponds to a random orientation of the structures inside the film with respect to the substrate plane.43 In this case, the objects are linked to the randomly oriented domains as observed for the surface structures via AFM (Fig. 3). However, after calcination, it is observed that the ring is absent and instead, prominent Bragg scattering rods along the qz direction are observed indicating an improvement in structural order in the direction perpendicular to the substrate. Additionally, for the 48 hours solvent-annealed film no preferred orientation of the structures in the film volume is noticed (Fig. 4(e)). In general, the scattering intensity from the calcined films is higher as compared with non-calcined films, which is attributed to the enhanced scattering contrast between ZnO and air in comparison with the contrast between ZnO and the polymer template.44 This difference in intensity is the reason for the implementation of different beamstops (rod for the solvent-annealed and point shaped for the calcined films) to account for different data acquisition times.
 | ||
| Fig. 4 2D GISAXS data of the solvent-annealed samples (left column) for different time scales as indicated and samples calcined afterwards (right column). The specular peak for all the samples is shielded by a circular beamstop. The red dashed arrow in (a) indicates the exemplary position at the Yoneda peak where horizontal cuts for all the scattering patterns are made. The white dashed arc in (b) exemplarily shows the azimuthal scattering ring present for the THF vapor-annealed samples for treatment up to 12 hours. | ||
For a quantitative analysis of the data, horizontal line cuts at the Yoneda peak positions (exemplarily marked by a red dashed arrow for the sample without any solvent vapor treatment in Fig. 4) are achieved. These horizontal line cuts are used to gain information about the structural length scales parallel to the substrate and are shown in Fig. 5(a) and (b) for the solvent-annealed and the subsequently calcined samples, respectively. The copolymer/ZnO hybrid samples are annealed for 3, 9, 12 and 48 hours, which are plotted from the bottom to the top in the graphs. For reference, the lowest curve denotes the sample without any solvent annealing. The position of the most pronounced peak observed for all the samples determines the predominant structural length scale in the volume of the film. The secondary peaks in the case of the solvent-annealed samples indicate the long-range higher ordering of the nanostructures. For the solvent-annealed samples these higher orders are suppressed after solvent annealing for 48 hours. Also for the samples which are calcined subsequently after the solvent annealing, the higher orders are no longer present, even after the shortest solvent annealing time investigated. Hence, the presence of a long-range order in the system is attributed to the copolymer template.
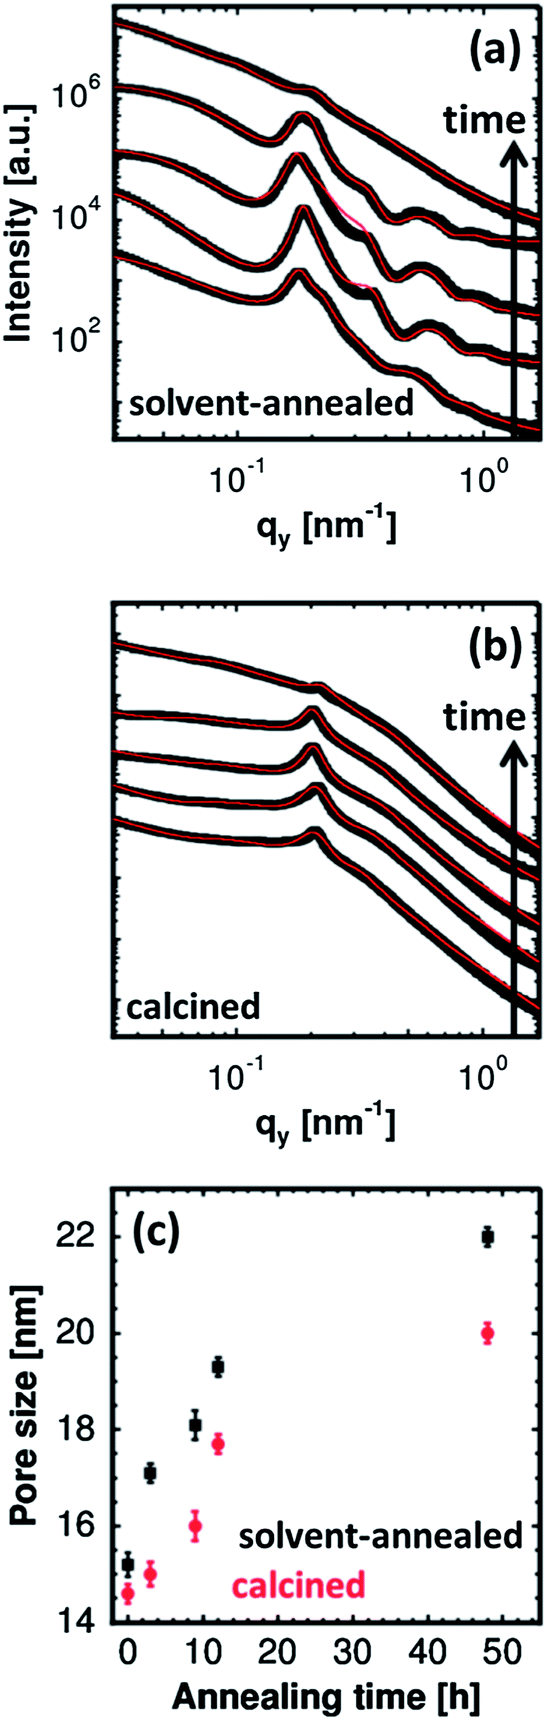 | ||
| Fig. 5 Horizontal line cuts obtained from the GISAXS data for (a) solvent-annealed samples for different times (0, 3, 9, 12 and 48 hours from bottom to top) and (b) samples calcined afterwards. The solid red lines indicate the fits to the data. The cuts are shifted along the intensity axis for illustrative purpose. (c) Average pore size of the solvent-annealed and subsequently calcined samples plotted as a function of the solvent annealing time. The values are extracted from the fits. | ||
To gain information about the length scales as a function of increasing solvent annealing time, the curves are fitted by a model consisting of two form factors with a cylindrical geometry distributed over a 1D paracrystal. The form factors denote the shape of the scattering objects in the film which in the present case is ascribed to the ZnO nanoparticles. The diameters of these cylindrical objects obtained from the fits denote the size of the ZnO nanoparticles. The structure factors obtained from the fits, on the other hand, account for the center-to-center distance between the scattering objects.44 Values of the structure and the form factors are then used to extract the pore size of the nano-grid films. More details about the fitting model are given in the ESI.† Thus the average pore size of the ZnO nano-grid is obtained by the following calculation:
| Pore size = (centre-to-centre distance between the nanoparticles − 2 × radius of the nanoparticles). |
Based on these calculations, the pore sizes of the solvent-annealed and the calcined films are plotted as a function of increasing solvent annealing time in Fig. 5(c). The increase in the average pore size is clearly visible with an increasing solvent annealing time for the hybrid films. For the films calcined afterwards, a similar trend is manifested. The average pore size of the solvent-annealed films decreases after they undergo the calcination step which is related to the pattern collapse. The copolymer template is removed from the system after calcination which leads to a structural collapse of the remaining ZnO thereby reducing the average pore size of the nano-grid films. The average pore size extracted from the GISAXS measurements are in good agreement with those obtained from the surface investigation of the films via SEM. It should be noted that the average pore size mentioned for the solvent-annealed film for 48 hours is represented by the distorted grid present underneath the large ZnO clusters observed on the film surface. This distorted grid is clearly visible in the SEM image.
Model of morphology formation
To summarize the results obtained via the real- and the reciprocal-space analysis, Fig. 6 shows a pictorial representation of the on-going modification processes in the copolymer/ZnO hybrid films as a function of time-dependent solvent annealing. In the sketch, the micelles formed in the solution during sol–gel synthesis are shown. These micelles are a result of the micro-phase separation in the diblock copolymer occurring due to the interaction of the blocks with the good and the selective solvents. The hydrophobic PS block is indicated in red. It forms the core of the micelles, whereas the corona formed by the blue chains represents the hydrophilic P4VP block. This structural rearrangement develops as a result of the increased interfacial interaction of the blocks upon addition of the selective solvent in the system. The small green spheres indicate the ZnO precursor (ZAD) molecules. Although the solvent annealing is performed on thin films, the sketch describes the structural modifications in the micelles. These micelles produced in the sol–gel are frozen on the substrate after spin coating. As spin coating is a non-equilibrium and fast process, the micelles retain the potential to rearrange under an external applied stimulus which in the present case is THF vapor. As the ZAD molecules get preferentially incorporated in the P4VP block of the template, their mobility is hindered to a large extent. On the other hand, THF being slightly selective towards the PS block promotes its swelling faster than the P4VP block when exposed to the THF vapor. Since the PS block constitutes the core of the micelles, the average pore size of the ZnO nano-grid increases after solvent annealing. The increase in the average pore size is around 27% after 12 hours of solvent annealing. It is observed from the SEM images that the grid-like morphology stays intact even after 12 hours of solvent annealing. The slow kinetics of the system is explained by the fact that the PS core is protected from the THF vapor by the ZAD molecules which are incorporated in the P4VP corona. Hence, considerable time is needed by the solvent vapor in order to penetrate the ZnO shielding and finally swell the PS block. Nevertheless, for sufficiently long solvent annealing times THF vapor considerably swells both the PS and the P4VP blocks of the template, which results in a collapse of the micellar arrangement (see Fig. 2 for 48 hours of solvent annealing). With time, both of the blocks attain sufficient mobility. The interfacial energy between the hydrophobic PS block and water (which is used as the selective solvent) decreases in the presence of a THF solvent environment, which ultimately results in deformation of the micelles. Thus, big clusters of ZnO with an average size of around 60 nm (as probed by GISAXS) are formed. This is clearly observed in the SEM and AFM images as well. However, for the calcined sample after 48 hours of solvent annealing, a distorted nano-grid of ZnO, as observed from the SEM images is present underneath the big ZnO clusters. This indicates that the solvent affects the top part of the film first and then gradually penetrates the rest of the film. The average distance between the big ZnO clusters is also probed by GISAXS and corresponds to a length scale of around 40 nm. Thus, the GISAXS measurements successfully probe the change in the pore size of the ZnO nano-grid as a function of both short and long term solvent annealing throughout the entire film volume. | ||
| Fig. 6 Schematic illustration of the structural evolution of the copolymer/ZnO nanocomposite film for different solvent annealing times as indicated. | ||
Conclusions
In conclusion, we present a highly promising morphology of ZnO resembling nano-grids, which have a large number of potential applications since they can be prepared on large scale samples, which is a prerequisite for successful application.45 An efficient route for tuning the pore size of the nano-grids is studied via the solvent annealing method, applied on the copolymer template/ZnO nanocomposite films. The modification in the length scale of the ZnO nano-grids is followed for both short and long term exposure to THF vapor via the powerful technique, GISAXS. Interactions of the solvent vapor with the polymer for different time scales lead to structural rearrangements in the system. Finally, this results in an increase in the average pore size of the ZnO nano-grid by 27% after 12 hours of solvent annealing followed by calcination. It is also shown that for a longer solvent annealing time of 48 hours, large clusters of ZnO are produced on the surface of the grid-like film. Several factors determine the extent of length scale manipulation of the nanostructures produced, of which the most important ones consist of the solvent annealing time and the interaction of the chosen solvent with the system under consideration. Hence, using a block copolymer together with a suitable solvent environment is a competent strategy to tune the length scale of ZnO nanostructures, keeping the film morphology intact as synthesized via the block copolymer-assisted sol–gel route. The fruitful combination of solvent annealing and sol–gel synthesis is foreseen to have a strong potential to be extended to other inorganic nanostructured systems.Acknowledgements
We thank Professor Alexander Holleitner and Peter Weiser for the opportunity to perform SEM measurements. We are thankful to D. Magerl for implementing the fitting model for the horizontal line cuts. The financial support of TUM.solar in the framework of the Bavarian Collaborative Research Project “Solar Technologies Go Hybrid” (SolTec) is gratefully acknowledged. C. J. S. thanks the Bavarian State Ministry of Sciences, Research and Arts for funding this work via the International Graduate School “Materials Science of Complex Interfaces” (CompInt).Notes and references
- B. Nandan, M. K. Vyas, M. Böhme and M. Stamm, Macromolecules, 2010, 43, 2463 CrossRef CAS.
- S. Miller, G. Fanchini, Y. Lin, C. Li, C. Chen, W. Su and M. Chhowalla, J. Mater. Chem., 2007, 18, 306 RSC.
- J. Gong, H. Ahn, E. Kim, H. Lee, S. Park, M. Lee, S. Lee, T. Kim, E. Kwak and D. Y. Ryu, Soft Matter, 2012, 8, 3570 RSC.
- L. Nicole, C. Boissiere, D. Grosso, A. Quach and C. Sanchez, J. Mater. Chem., 2005, 15, 3598 RSC.
- C. Wang, Y. Mao, D. Wang, Q. Qu, G. Yang and X. Hu, J. Mater. Chem., 2008, 18, 683 RSC.
- K. Fukunaga, H. Elbs, R. Magerle and G. Krausch, Macromolecules, 2000, 33, 947 CrossRef CAS.
- C. Chang, P. Wu and Y. Sun, Soft Matter, 2011, 7, 9140 RSC.
- S. Park, B. Kim, J. Xu, T. Hofmann, B. M. Ocko and T. P. Russell, Macromolecules, 2009, 42, 1278 CrossRef CAS.
- C. Chang, Y. Lee, P. Yu, J. Liou, Y. Sun and B. Ko, Langmuir, 2011, 27, 14545 CrossRef CAS PubMed.
- G. Kim and M. Libera, Macromolecules, 1998, 31, 2569 CrossRef CAS.
- Y. Xuan, J. Peng, L. Cui, H. Wang, B. Li and Y. Han, Macromolecules, 2004, 37, 7301 CrossRef CAS.
- J. W. Spalenka, P. Gopalan, H. E. Katz and P. G. Evans, Appl. Phys. Lett., 2013, 102, 041602 CrossRef.
- Y. Lee, Y. Sun, J. Liou and W. Chuang, Polymer, 2012, 53, 5972 CrossRef CAS.
- J. Huang, Z. Yin and Q. Zheng, Energy Environ. Sci., 2011, 4, 3861 CAS.
- B. K. Kuila and M. Stamm, J. Mater. Chem., 2011, 21, 14127 RSC.
- M. Ahmad and J. Zhu, J. Mater. Chem., 2011, 21, 599 RSC.
- R. Yamada, H. Wano and K. Uosaki, Langmuir, 2000, 16, 5523 CrossRef CAS.
- M. C. Orillal and U. Wiesner, Chem. Soc. Rev., 2011, 40, 520 RSC.
- B. Smarsly and M. Antonietti, Eur. J. Inorg. Chem., 2006, 6, 1111 CrossRef.
- K. Brezesinski, J. Wang, J. Haetge, C. Reitz, S. O. Steinmueller, S. H. Tolbert, B. M. Smarsly, B. Dunn and T. Brezesinski, J. Am. Chem. Soc., 2010, 132, 6982 CrossRef CAS PubMed.
- Y.-J. Cheng and J. S. Gutmann, J. Am. Chem. Soc., 2006, 128, 4658 CrossRef CAS PubMed.
- M. Rawolle, M. A. Niedermeier, G. Kaune, J. Perlich, P. Lellig, M. Memesa, Y.-J. Cheng, J. S. Gutmann and P. Müller-Buschbaum, Chem. Soc. Rev., 2012, 41, 5131 RSC.
- M. A. Niedermeier, G. Tainter, B. Weiler, P. Lugli and P. Müller-Buschbaum, J. Mater. Chem. A, 2013, 1, 7870 CAS.
- K. Sarkar, M. Rawolle, E. M. Herzig, W. Wang, S. V. Roth and P. Müller-Buschbaum, ChemSusChem, 2013, 6, 1414 CrossRef CAS PubMed.
- G. Baldinozzi, G. Muller, C. Laberty-Robert, D. Gosset, D. Simeone and C. Sanchez, J. Phys. Chem. C, 2012, 116, 7658 CAS.
- X. Li, J. Peng, Y. Wen, D. H. Kim and W. Knoll, Polymer, 2007, 48, 2434 CrossRef CAS.
- S. Hyun, M. J. Misner and T. P. Russell, Adv. Mater., 2004, 16, 2119 CrossRef.
- K. A. Cavicchi, K. J. Berthiaume and T. P. Russell, Polymer, 2005, 46, 11635 CrossRef CAS.
- B. Kim, S. W. Hong, S. Park, S. Xu, S. K. Hong and T. P. Russell, Soft Mater, 2011, 7, 443 RSC.
- J. Shi, H. Hong, Y. Ding, Y. Yang, F. Wang, W. Cai and X. Wang, J. Mater. Chem., 2011, 21, 9000 RSC.
- I. Garcia, A. Tercjak, J. Guttierrez, L. Ruedda and I. Mondragon, J. Phys. Chem. C, 2008, 112, 14343 CAS.
- T. H. Kim, J. Huh, J. Hwang, H. Kim, S. H. Kim, B. Sohn and C. Park, Macromolecules, 2009, 42, 6688 CrossRef CAS.
- P. Müller-Buschbaum, N. Hermsdorf, S. V. Roth, J. Wiedersich, S. Cunis and R. Gehrke, Spectrochim. Acta, Part B, 2004, 59, 1789 CrossRef.
- W. S. Rasband, ImageJ, U. S. National Institutes of Health, Bethesda, Maryland, USA, 1997–2012, http://imagej.nih.gov/ij/ Search PubMed.
- S. V. Roth, R. Döhrmann, M. Dommach, M. Kuhlmann, I. Kröger, R. Gehrke, H. Walter, C. Schroer, B. Lengeler and P. Müller-Buschbaum, Rev. Sci. Instrum., 2006, 77, 085106 CrossRef.
- P. Müller-Buschbaum, Anal. Bioanal. Chem., 2003, 376, 3 Search PubMed.
- J. Perlich, G. Kaune, M. Memesa, J. S. Gutmann and P. Müller-Buschbaum, Philos. Trans. R. Soc., A, 2009, 367, 1783 CrossRef CAS PubMed.
- G. Kaune, M. Memesa, R. Meier, M. A. Ruderer, A. Diethert, S. V. Roth, M. D'Acunzi, J. S. Gutmann and P. Müller-Buschbaum, ACS Appl. Mater. Interfaces, 2009, 1, 2862 CAS.
- K. Kim, Y.-K. Fang, W. Kwon, S. Pyo, W.-C. Chen and M. Ree, J. Mater. Chem. C, 2013, 1, 4858 RSC.
- H. Waters, J. Kettle, S.-W. Chang, C.-J. Su, W.-R. Wu, U.-S. Jeng, Y.-C. Tsai and M. Horie, J. Mater. Chem. A, 2013, 1, 7370 CAS.
- M. J. Jurow, B. A. Hageman, E. DiMasi, C.-Y. Nam, C. Pabon, C. T. Blac and C. M. Drain, J. Mater. Chem. A, 2013, 1, 1557 CAS.
- Y. Yoneda, Phys. Rev., 1963, 131, 2010 CrossRef.
- P. Busch, M. Rauscher, J.-F. Moulin and P. Müller-Buschbaum, J. Appl. Crystallogr., 2011, 44, 370 CrossRef CAS.
- M. Rawolle, K. Sarkar, M. A. Niedermeier, M. Schindler, P. Lellig, J. S. Gutmann, J.-F. Moulin, M. Haese-Seiller, A. S. Wochnik, C. Scheu and P. Müller-Buschbaum, ACS Appl. Mater. Interfaces, 2013, 5, 719 CAS.
- M. A. Niedermeier, I. Groß and P. Müller-Buschbaum, J. Mater. Chem. A, 2013, 1, 13399 CAS.
Footnote |
| † Electronic supplementary information (ESI) available. See DOI: 10.1039/c4ta00489b |
| This journal is © The Royal Society of Chemistry 2014 |