 Open Access Article
Creative Commons Attribution 3.0 Unported Licence
The effect of solvent choice on the gelation and final hydrogel properties of Fmoc–diphenylalanine†
Jaclyn
Raeburn
a,
Cristina
Mendoza-Cuenca
b,
Beatrice N.
Cattoz
c,
Marc A.
Little
a,
Ann E.
Terry
d,
Andre
Zamith Cardoso
 a,
Peter C.
Griffiths
c and
Dave J.
Adams
*a
aDepartment of Chemistry, University of Liverpool, Crown Street, Liverpool, L69 7ZD, UK. E-mail: d.j.adams@liverpool.ac.uk
bDepartment of Chemical Engineering, Faculty of Sciences, 18071 Granada, Spain
cSchool of Life Sciences, University of Sussex, Chichester II Building, Falmer, BN1 9QG, UK
dRutherford Appleton Laboratory, Science and Technology Facilities Council, Didcot, Oxfordshire OX11 0QX, UK
First published on 8th December 2014
Abstract
Gels can be formed by dissolving Fmoc–diphenylalanine (Fmoc–PhePhe or FmocFF) in an organic solvent and adding water. We show here that the choice and amount of organic solvent allows the rheological properties of the gel to be tuned. The differences in properties arise from the microstructure of the fibre network formed. The organic solvent can then be removed post-gelation, without significant changes in the rheological properties. Gels formed using acetone are meta-stable and crystals of FmocFF suitable for X-ray diffraction can be collected from this gel.
Introduction
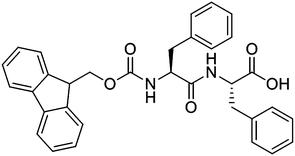
Fluorenylmethoxycarbonyl diphenylalanine (FmocFF, Scheme 1) is perhaps the most commonly reported dipeptide gelator in the literature.1–5 FmocFF forms transparent, homogeneous hydrogels under a number of different assembly conditions. For example, a change in pH (which can also include a heating and cooling step) can trigger gelation,1,3,6–9 or the FmocFF can be solubilised in an appropriate solvent before dilution with water to afford a gel.2,4,10 FmocFF is an attractive low molecular weight gelator (LMWG) as stable gels can be prepared at physiological conditions, allowing for the potential use in biological applications such as controlled drug release,4 tissue engineering and cell culturing.1,2,7 The main issue with not only FmocFF, but LMWG in general, is that the method of assembly can have a significant impact on whether or not a material forms a hydrogel and the material properties of the resulting hydrogel.5,11 Although it is known that under specific conditions FmocFF self-assembles to form long fibrous structures that entangle, yielding a network capable of entrapping water, it is still relatively unclear as to what exactly leads to the differences in the final properties of these gels. In recent years, FmocFF gels with a variety of mechanical properties have been prepared using the different assembly methods.11 For example, Ulijn and co-workers have extensively utilised a pH switch method, coupled with changes in temperature, to prepare gels of FmocFF and have shown that the final properties are variable.1,6–9 The rate of pH decrease and the final pH value can influence the final properties. Even the method of mixing can affect the hydrogel properties.12Mahler et al. were the first to show that gels can also be formed using FmocFF by dissolving FmocFF in an appropriate water-miscible solvent,4 before diluting with water to drive the hydrophobic FmocFF to self-assemble into one-dimensional structures, leading to hydrogelation.2,13,14 Using this method, we recently showed that the final ratio of dimethylsulfoxide (DMSO) to water (expressed as the volume fraction of DMSO, ϕDMSO) strongly affects the mechanical properties of gels formed using FmocFF5 and another related gelator, FmocLG.15 The rheological properties were affected by the ϕDMSO, as was the ability of the gels to recover after shear. We also showed through the use of various buffers that the pH plays a pivotal role in controlling the mechanical properties of these FmocFF gels. Elsewhere, Gazit's group have formed gels from FmocFF using different compositions of DMSO, acetone, or hexafluoroisopropanol (HFIP) with water and reported mechanical properties, with the storage modulus (G′) being typically in the kPa region.4,10
For this solvent-triggered approach, some solvents may be preferred over others for use in biological systems due to any associated hazards with the solvent in the gel. Whilst pH-triggered gels consist of water and no solvent, which might be more attractive for some applications, the stability of “solvent-triggered” FmocFF gels over a wider range of pH conditions5 plus the fact that no mixing is required5 (thus increasing the homogeneity and reproducibility of these gels) makes the latter class of gels extremely interesting. Having the ability to potentially choose a desired solvent to tailor both the gel properties and suitability for different applications could be an extremely powerful approach. In this paper, we investigate the effects of specific solvents on both the gelation ability of FmocFF with different volume fractions of the solvent (ϕsolvent). We show how the choice of solvent influences the final mechanical properties of the gels formed and show that the solvent can be removed post-gelation without a significant impact on the rheological properties.
Results and discussion
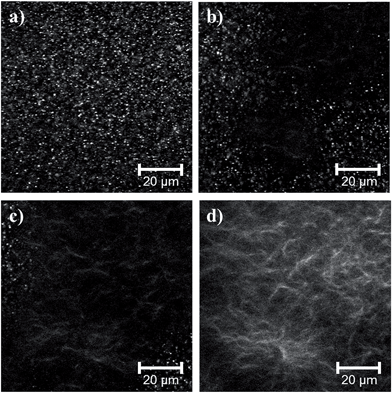
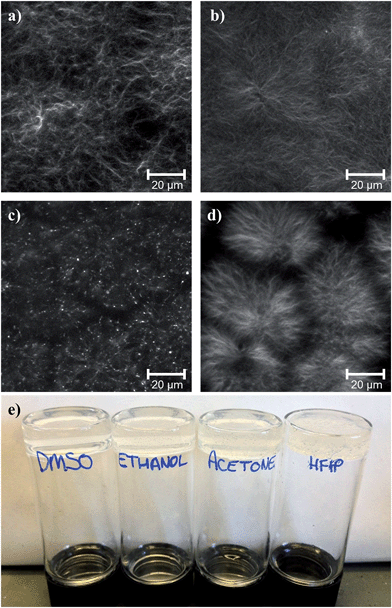
Here, we report the mechanical properties of FmocFF gels formed by adding water to solutions of DMSO, ethanol, acetone, or HFIP. FmocFF gels composed of varying ϕDMSO have been reported previously by our group.5 FmocFF dissolves readily in DMSO to prepare concentrated gelator solutions that can be diluted with water to give gels with a final FmocFF concentration of 5 mg mL−1. Replicating the same dilutions with acetone and HFIP showed that FmocFF could again be dissolved readily in these solvents, but the ϕsolvent range over which gels could be prepared varied. Ethanol can also be used to prepare gels using FmocFF at a range of ϕethanol, but the gelator stock solutions require gentle heating to fully dissolve the FmocFF. These ethanolic solutions were left to cool to room temperature prior to dilution with water to trigger gelation. For all solutions, upon addition of water to the stock solutions of FmocFF, a change in turbidity of the solution was observed. Turbidity changes have been noted previously for FmocFF gels5,16 and related FmocLG gels prepared from DMSO–water.15 The turbidity change observed was dependent on both the solvent used and the ϕsolvent. Recently, Dudukovic and Zukoski demonstrated via in-depth confocal microscopy analysis of the gelation process in FmocFF gels prepared from DMSO–water mixtures that the FmocFF–DMSO solution contains spherulitic structures that can act as nucleation points for fibril growth upon water addition.17 They also showed that as the gelation progresses, these spherulitic structures disappear, being replaced by fibres that continue to grow and entangle to give a uniform network. We have previously shown similar behaviour for the related gelator FmocLG.15 Here, studying the gelation process of FmocFF prepared using ethanol–water, we observed the same transition from spherulitic structures to a fibrous network (Fig. 1). Using confocal microscopy with Nile Blue to stain FmocFF, we observed that upon the addition of water to an ethanol solution of FmocFF (final ϕethanol of 0.3 shown in Fig. 1), the initial presence of spherulitic structures which disappeared as fibre formation occurred. This transition from spheres to fibres was a dynamic process, taking approximately two minutes under these conditions.There is clearly therefore a phase separation event that leads to gelation. Using the other solvents, the duration of this sphere to fibre transition varies (Fig. S1, ESI†). However, it is clear by comparison of the microscopy in ethanol–water and from data collected for DMSO–water by Dudukovic et al. that the self-assembly process is similar and solvent independent.17 Slight differences in turbidity for the gels formed using different solvents (Fig. 3e) is more likely a result of variations in the sizes of spherulitic structures/fibrous structures rather than the process itself. We note that turbidity changes and the formation of spherulitic structures preceding gelation has never been reported for FmocFF gels prepared using pH triggered methods, indicating a fundamentally different self-assembly process occurs with these triggers.
Gelation occurred across slightly different ϕsolvent ranges, depending on the solvent used. At a final FmocFF concentration of 5 mg mL−1, gelation occurred from a ϕsolvent of 0.05 to 0.6 for DMSO and HFIP, but there were solubility issues at a ϕsolvent of 0.05 when ethanol and acetone were used. The higher volatility of these solvents compared to DMSO and HFIP may play a role in this due to the low volume of solvent required here. Otherwise, there appears to be only small deviations in the gelation ability of FmocFF using the four solvents despite their different hydrogen bonding ability, dielectric constant, etc., although no gel formed at a ϕacetone of 0.6 unlike for the other solvent systems.
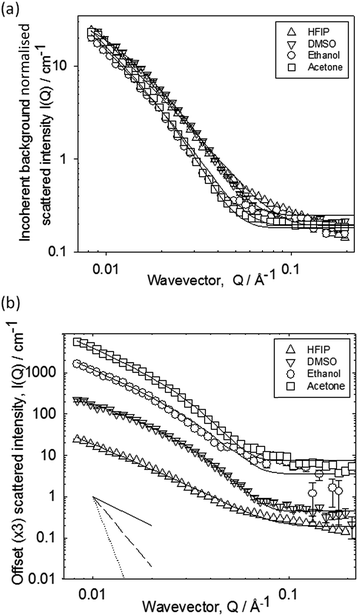
We used small angle neutron scattering (SANS) to probe the fibrous structures formed. The scattering from a series of gels prepared from the different solvents at a ϕsolvent of 0.3 is presented in Fig. 2.
The data have been normalised for subtle differences in incoherent background in Fig. 2a, and separated by factors of 3 in Fig. 2b for clarity. The data fall into two pairs, though there is no major difference between the four datasets. There are also few distinguishing features in the data e.g. discontinuities at high Q. This implies that the scattering objects are not core–shell structures. Over the Q-range examined here, the data are most sensitive to the cross-section of the scattering objects. The decay rates follow the order acetone ∼ ethanol > DMSO ∼ HFIP, indicating a marginally larger cross-section of the structures formed in ethanol and acetone. The absolute intensities of all four cases are also similar suggesting a comparable number of scatterers per unit volume, and molecules per unit length along the fibril. The data were fitted in terms of the Kholodenko–Dirac worm as previously reported,15 which models the scattering structure as a series of semi-flexible rods of a given cross-section. The model smoothly interpolates between a rigid-rod Q−1 decay at low Q, into a decay consistent with a more flexible structure with characteristic Q−2 decay, and ultimately, at high Q, into a Q−4 dependence associated with the highly curved surface of the cross-section of the rod (see inset to Fig. 3b). In essence, Rcross-section = 34 (±3) Å for DMSO, 38 (±3) Å for ethanol, 44 (±3) Å for acetone, and 32 (±3) Å for HFIP. Hence, the primary fibres formed from each solvent are very similar. We note that the values obtained are in agreement with recent data for FmocFF fibres formed from DMSO.17
Despite the similar phase separation during the self-assembly process, comparison of the final gel microstructures shows that there are differences in the fibrous network depending on the solvent used. This is exemplified for FmocFF gels prepared at a final ϕsolvent of 0.3 in Fig. 3. Using DMSO (Fig. 3a), a largely homogeneous network of fibres is formed, where the fibres appear to be densely packed into larger domains of fibres, interconnected by slightly less dense regions of fibres (similar to that previously reported5). This microstructure is much more pronounced for the corresponding gels containing HFIP (Fig. 3d), where defined fibrous clusters are visible. FmocFF gels prepared using ethanol (Fig. 3b) appeared to the have the most homogeneous fibril network at the micrometer length scale. A dense network of thin entangled fibres was present throughout the gels. There are indications of similar fibrous domains visible in gels prepared from acetone (Fig. 3c), but there are also spherulitic structures. The residual spherulites in the acetone–water gels were crystalline, as can be determined by both polarised microscopy (Fig. S2, ESI†) and X-ray crystallography. We note that the gels formed from other solvents showed no such structures under polarised microscopy or X-ray diffraction. The crystals developed from acetone after gelation, and are not simply due to undissolved FmocFF. No crystals were observed in the ethanol gels. Since ethanol is also volatile like acetone, the lack of crystallisation in the ethanol gels suggests that crystallisation does not simply occur as a result of the solvent leaving the system.
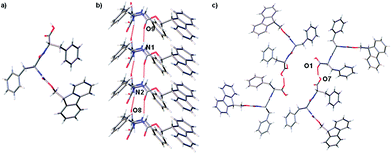
A crystal of FmocFF, selected from gel phase, was suitable for single crystal X-ray diffraction studies using synchrotron radiation despite the extremely small size of the needle shaped fragment. In the single crystal structure FmocFF molecules are stacked parallel along the crystallographic b axis, Fig. 4a. The distance between FmocFF molecules stacked along b correlates to one unit cell length, or 5.0 Å. Hydrogen bonding interactions, Fig. 4b, and weak offset π–π interactions, at a distance of ∼5 Å, are evident between these FmocFF molecules. The single crystal structure of FmocFF was refined in the chiral monoclinic space group C2, with the asymmetric unit comprising two FmocFF molecules which interact through edge-to-face π–π bonding interactions. These two FmocFF molecules have the opposite relative orientation along b. Additional FmocFF molecules in the crystal lattice are related by twofold rotation axes; these axes are located centrally between four stacks of FmocFF molecules, Fig. 4c. Diffuse solvent, found in small lattice voids, was modelled as H2O.
Powder X-ray diffraction (pXRD) data was recorded on dried xerogel material formed using acetone (Fig. S5, ESI†). From the pXRD pattern reflections at 15, 12.6, 4.9, 4.2, 3.8 and 3.4 Å were measured. Comparison between the experimental pXRD pattern and that simulated from the single crystal structure reveal a close comparison between peak positions. From the experimental pXRD pattern, there is also a clear contribution from amorphous material. WAXS data has been reported for a pH-triggered gel, where reflections at 26, 16 and 4.3 Å were found.6 Reflections at approximately 10 and 4.7 Å have been interpreted as being due to the formation of β-sheet structures, which are thought to be the basis of the assembly of FmocFF,6 with a reflection at 16 Å thought to arise from stacking between Fmoc groups. SAED data on single fibres from a film of FmocFF, also revealed reflections at 4.8 and 23 Å, which were assigned to the fibre axis and a perpendicular axis respectively, with the aid of TEM imaging.18 Interestingly, these two reflections are very similar to the a- and b-axis lattice parameters obtained here for the single crystal data, 5.0 and 22.8 Å. Here, in line with our previous data, we ascribe the amorphous material observed by pXRD to the gel phase.19 It is not clear whether the crystalline material of FmocFF isolated during this study is representative of the proposed fibrous structure. We include the data here for completeness, but believe interpreting the single crystal structure in this instance is not informative for determining the packing in the fibrous structure in line with our previous data.19 Nonetheless, this data represents the first single crystal X-ray diffraction study for this important gelator.
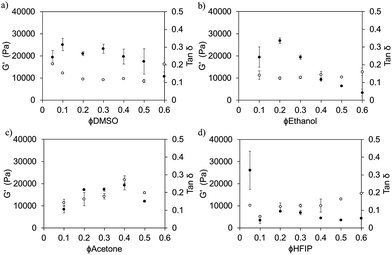
We have reported previously on the importance of ϕsolvent for FmocFF5 and FmocLG15 gels prepared at different ϕDMSO. Here, we find that the rheological properties can be tuned by judicious choice of both solvent and solvent composition (strain and frequency sweep data for ϕsolvent of 0.3 are shown in Fig. S6 and S7, ESI†). For gels prepared using DMSO, ethanol, or acetone, somewhat similar mechanical properties were recorded between ∼ϕsolvent of 0.2 and 0.4, with the mechanical properties slightly lower for gels prepared at a ϕsolvent on either side of this range (Fig. 5). However, for HFIP, all ϕHFIP resulted in storage moduli (G′) < 10 kPa; except for a ϕHFIP of 0.05 which resulted in significantly mechanically stronger gels with a G′ of ∼26 kPa. In almost all the gels studied, G′ exceeded G′′ by a factor of >7, however in some cases this factor was only ∼4/5 (Fig. 5, showing tan![[thin space (1/6-em)]](https://www.rsc.org/images/entities/char_2009.gif) δ (G′′/G′)). The critical strain at which the gelled state yields did not directly correlate with either the solvent used or the ϕsolvent. The critical strains varied between ∼2 and 20% for 5 mg mL−1 gels prepared from all solvents. This could be due to differences in the number of crosslink points or degree of association of the fibres, or even in the brittleness of the fibres themselves. The rheology for all gels was measured 24 hours after water addition to trigger gelation. These gels form quickly (see above), but the rheology does develop over time.16 However, by 24 hours, the rheology has essentially come to a plateau value (example data is shown in Fig. S8, ESI†).
δ (G′′/G′)). The critical strain at which the gelled state yields did not directly correlate with either the solvent used or the ϕsolvent. The critical strains varied between ∼2 and 20% for 5 mg mL−1 gels prepared from all solvents. This could be due to differences in the number of crosslink points or degree of association of the fibres, or even in the brittleness of the fibres themselves. The rheology for all gels was measured 24 hours after water addition to trigger gelation. These gels form quickly (see above), but the rheology does develop over time.16 However, by 24 hours, the rheology has essentially come to a plateau value (example data is shown in Fig. S8, ESI†).
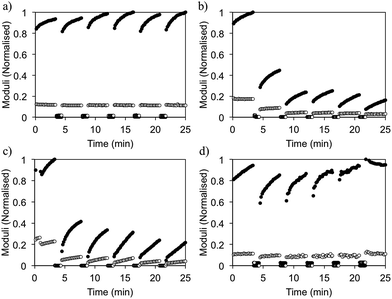
The ability of the gels to recover after shear can also be controlled by solvent choice (Fig. 6). This is an important property for injectable gels, since ideally here the gel would recover quickly and completely back to its original state after flowing through a needle.20 For DMSO gels (ϕDMSO = 0.3), 100% of the mechanical strength is recovered upon cessation of high shear (Fig. 6a), even after several cycles. We note here that we intended to probe the ability of the gels to recover from a short period of high shear that breaks down the gel rather than the absolute value of G′. As a result, in this experiment, set up shear cycles of constant duration and as a result the modulus does not return to a constant value.
Previously, we drew a correlation between the gel microstructure and the ability of the gel FmocLG to recovery from shear.15 We showed that gels formed by a nucleation and growth process led to domains of fibres such as those found here (Fig. 3), which could percolate back to a gel after shear cessation and hence recover more successfully than those gels that were found to be consisting of a more densely packed network such as that found for ethanol gels. Yan et al. have also drawn similar conclusions for their injectable oligopeptide (MAX1 and MAX8) gels.21 From the microscopy, we would therefore expect that gels formed from HFIP and ethanol would recover well, whilst those formed from acetone would recover poorly. For gels formed from HFIP and acetone, this expectation holds. Gels formed using acetone only recovered 30% of their original G′. Gels formed using HFIP, however, could recover 95% of the original G′ at a ϕHFIP of 0.3. However, despite the similar microstructure observed by confocal microscopy (Fig. 3), gels formed using ethanol (ϕethanol 0.3) exhibit very poor recovery. These gels only regain 26% of their original mechanical properties after being subjected to high shear. It seems therefore that a simple comparison of the microscopy is not always a good predictor of mechanical properties.
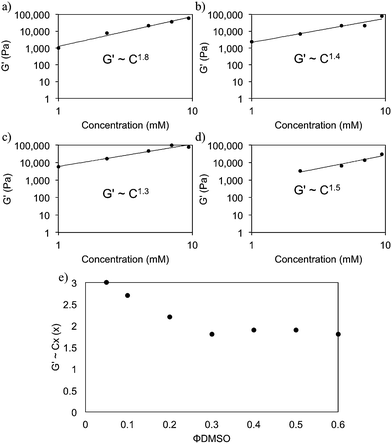
It is clear from the above that there are distinct differences in gel properties depending on the choice of solvent. It is not entirely clear what influences these fluctuations at both the microstructural and bulk scales of FmocFF gels (and other systems). Considering the initial phase separation process seems very similar, presumably these differences appear to be at the latter stages of the gelation process i.e. fibril growth, association and beyond. To investigate this further, we investigated the scaling relationships between the concentration of FmocFF and the final mechanical properties i.e. G′ of the gel such that G′ ∝ Cx. A power law behaviour has been reported for many gelling systems, with x being indicative of the network type. Typically for colloidal gels, x is between 3 and 6.22 For cross-linked polymer networks, x is around 2.5.23–25 Values of x of around 1.4 have been reported for entangled semiflexible networks.24,26,27
Fig. 7 shows the scaling relationships drawn for FmocFF gels prepared with the four solvents at a ϕsolvent 0.3. The exponents depend on the solvent, which again shows that the network is tuneable by solvent. In all cases, the exponents are much lower than predicted by Mackintosh theory. This suggests that, over the concentration range studied here, the networks observed are more reminiscent of relatively dilute F-actin systems, which formed entangled chain networks rather than densely crosslinked networks.24,26 We previously found similar values for Fmoc–dipeptide gels formed using a pH switch.28
Concentrating on gels formed using DMSO, we find that the exponent derived was dependent on the ϕDMSO used to prepare the gels (Fig. 7e and S9, ESI†). Exponents ranging from 3.0 to 1.8 are derived for ϕDMSO between 0.05 and 0.6, inherently indicating a change in the network formed when the ϕDMSO is altered. This suggests that different networks are formed at different ϕDMSO. This could arise from differences in the kinetic process of gelation in these systems when the ϕDMSO is changed. Such differences are suggested by the turbidity data upon addition of water to the FmocFF–DMSO solution (Fig. S1b, ESI†). There are differences in the final turbidity change and in the duration of the turbidity events, depending on the ϕDMSO. We interpret this as the kinetics of the assembly process differing, leading to different types of fibre networks. Recently, Dudukovic and Zukoski reported a scaling relationship of 2.5 for FmocFF gels prepared using DMSO.29 This is much higher than the values we report here and more fitting with the model proposed by Mackintosh.29 The reasons for the difference are not clear, but may be due to slight changes in the sample preparation protocol, final pH etc. The pH of the gels was not reported by Dudukovic and Zukoski. Here, we find that the pH of the gels is between 4.3 and 4.7 for all solvents and ratios apart from for HFIP, where the pH is slightly lower (∼4).
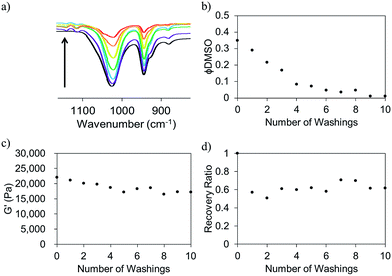
For some applications, the presence of the solvent could be undesirable. For example, large solvent volumes could be deleterious for cell viability and biocompatibility. However, the tunability afforded using this solvent switch approach is useful. Hence, we considered the possibility of removing the solvent from the gel network post-gelation. FmocFF gels were prepared as described above, utilising a final gelator concentration of 5 mg mL−1 and a ϕDMSO of 0.3. We used D2O here as opposed to H2O to facilitate analysis of DMSO removal. Post-gelation, D2O was added to the top of the gels. This D2O was replaced regularly. The concentration of DMSO in the washing D2O was quantified using FT-IR by observation of the sulfoxide peak in these samples at 1020 cm−1 (Fig. 8a). This data shows that the DMSO can be removed via washing. ϕDMSO decreased to <0.1 from the initial value of 0.3 after just four washings (Fig. 8b). The ϕDMSO of the gels continued to decrease; after ten washings, the DMSO was almost completely removed (ϕDMSO of approximately 0.01).
A key question is whether the removal of the solvent affects the mechanical properties. Fig. 8c shows that the G′ slightly decreased from ∼22 kPa to ∼17 kPa after 10 washings. Hence, the solvent can be exchanged for D2O with little perturbation of the hydrogel network. The critical strains were also unaffected by the removal of DMSO from the system (Fig. S10, ESI†), with a critical strain of ∼8% being recorded after each washing.
The ability of the gels to recover from shear after the DMSO has been washed out slightly deteriorates, with the recovery going from 100% before washing to 70% after one washing step (Fig. 8d). However, there is no further decrease after this first washing step. This decreased ability to recover remains constant after successive washings. This diminished ability to recover at lower ϕDMSO is consistent with gels of similar ϕDMSO which have not undergone any washing process.5 Gels with almost no DMSO present at all still possess mechanical properties similar to that of the originally prepared FmocFF gels with ϕDMSO of ∼0.3. Hence, desired mechanical properties can potentially be targeted and the hydrogel be altered to contain almost 100% water with the mechanical properties being almost unperturbed in the process. This could be advantageous for systems where toxic and undesirable solvents may be required to solubilise the gelator. Potentially, any unwanted solvent can be removed and could, thus, increase the biocompatibility of the hydrogel material without compromising the material properties.
Conclusions
From consideration of previous work on both FmocLG15 and FmocFF5 gels formed from the DMSO–water system, we have shown that the tunability of FmocFF hydrogels can be extrapolated to a number of other solvent systems. FmocFF is readily soluble in a number of both polar protic and aprotic solvents across a number of ϕsolvent and on water addition, gelation can occur under a number of different solvent conditions. Upon addition of water to the solvent-stabilised FmocFF, a nucleation and growth process of fibres occurs from small spherulitic structures that diminish as the fibrous network forms. The primary fibre dimensions are all very similar as measured by SANS, but the fibre network formed as a result can be controlled by the solvent choice. This allows for the control of the mechanical properties of the final hydrogel. At a ϕsolvent of 0.3, FmocFF gels prepared using ethanol appear to have a more uniform network than gels with DMSO, acetone or HFIP. Gels formed using ethanol are the mechanically strongest at this ϕsolvent. However, these gels have a poor ability to recover from shear. Conversely, gels prepared from DMSO or HFIP (at a ϕsolvent of 0.3) are mechanically weaker by comparison to those formed using ethanol, but they can recover 95–100% of their mechanical strength upon shear cessation. This can be attributed to a microstructure of spherulitic domains of fibres interconnected by less dense domains of fibres. On exposure to shear, the links between these domains are broken, but not the domains themselves. When the shear is stopped, the domains can re-pack and form a network. Similar concepts have been suggested by Yan et al.21 Overall the gels formed using DMSO tend to have the highest storage modulus, despite a non-uniform fibre network.Tuning the properties of FmocFF gels by changing the solvent used is a very attractive feature. However, for many applications the presence of the organic solvent may be an issue. Removing the solvent by washing is possible as we have shown here, which expands the potential utility and opens up the possibility to replace the solvent portion of the hydrogel with potentially any solvent that may be required for an application. Even considerably harsh solvents – which may be necessary to solubilise a particular gelator – could be used due to the ability to remove the solvent from the hydrogel network.
Experimental
Materials
FmocFF was prepared as described previously.28 Deionised water was used throughout. All other chemicals were purchased from Sigma-Aldrich and used as received.Hydrogel preparation
Stock solutions of FmocFF were prepared by dissolving in DMSO (or other solvents) and upon complete dissolution of gelator, distilled water was added to make up to a final volume of 2 mL to form a gel for analysis. Some gentle heating was required to dissolve FmocFF in ethanol. The ethanolic solution was allowed to cool to room temperature before water addition to form a gel. The volume of solvent and water added varied depending on the desired ϕsolvent. No post-water mixing was required. Samples were left to stand overnight before any analyses of the gels formed were carried out. When gelled, complete immobilisation of the solvent occurred and gels had final gelator concentration of 0.5 wt% (5 mg mL−1) unless otherwise stated.We note that an exotherm was observed when water was added to the gelator solution; this increased as the ϕsolvent increased. This exotherm was more pronounced for DMSO–water systems30,31 – an exotherm of 19 °C was noted for a gel containing a ϕDMSO of 0.6. For ethanol, acetone and HFIP systems, exotherms were all ∼6 °C or less, regardless of the presence of gelator or not. Homogeneous hydrogels were formed at each ϕsolvent for all solvents. Gelation occurred within minutes. All gels were left to stand overnight in sealed sample tubes before any characterisation of their final properties and were all therefore at room temperature when analysed.
Confocal microscopy
Confocal microscopy images were taken using a Zeiss LSM 510 Meta confocal microscope. A Zeiss Plan-Apochromat 100x/1.40 Oil M27 objective was used for all images selected. Fluorescence from Nile blue was excited using a 633 nm Helium–Neon laser (with power adjusted between 10 to 25%) and emission detected with a band pass filter between 650 and 710 nm. Gels were prepared in situ, using the same methodology as described above except gels were prepared with a volume of 500 μL and contained 20 μL of a 0.1 wt% solution of Nile Blue per 1 mL of gel. Gels were prepared in MatTek dishes (20 mm diameter glass coverslip) made of uncoated borosilicate glass.Optical microscopy
Optical microscopy images were taken with a Nikon LV100D-U microscope and using an Infinity 2-1C colour USB2 camera. Samples were imaged under cross-polarised light and (at ×5 magnification) to identify any crystalline material present. Gel samples were placed on a microscope slide prior to imaging.Powder X-ray diffraction
Powder X-ray diffraction data were collected on a PANalytical X'pert pro multipurpose diffractometer (MPD) in transmission Debye–Scherrer geometry operating with a Cu anode at 40 kV and 40 mA. PXRD patterns were collected in 4 × 1 h scans with a step size of 0.013° 2θ and a scan time of 115 s per step over 5–50° 2θ. The incident X-ray beam was conditioned with 0.04 rad Soller slits and an antiscattering slit of 0.5°. The diffracted beam passed through 0.04 rad Soller slits before being processed by the PIXcel2 detector operating in scanning mode. Samples were dried in air before measuring.Single crystal X-ray diffraction
A solvated single crystal of FmocFF isolated from the gel phase was mounted on MiTeGen loop and cooled to 100 K under a dry nitrogen gas stream. Single crystal XRD data was measured at beamline I19, Diamond Light Source, Didcot, UK using silicon double crystal monochromated radiation (λ = 0.6889 Å, Rigaku Saturn724+ detector).32 Empirical absorption corrections using equivalent reflections were performed with the program SADABS.33 The structure was solved by direct methods using SHELXS-97,34 and reined by full-matrix least squares on F2 by SHELXL,34 interfaced through the programme OLEX2.35Crystal data for FmocFF·(H2O)0.875 crystallised from a H2O–acetone gel phase; CCDC entry: 1027570.† Formula C33H31.75N2O5.875; M = 550.35 g mol−1; monoclinic space group C2, colourless needle shaped crystal; a = 52.27(6), b = 5.010(6), c = 22.83(3) Å; β = 105.49(3)°; V = 5761(11) Å3; ρ = 1.269 g cm−3; μ = 0.082 mm−3; F(000) = 2326; crystal size = 0.070 × 0.009 × 0.008 mm3; T = 100(2) K; 11![[thin space (1/6-em)]](https://www.rsc.org/images/entities/char_2009.gif) 789 reflections measured (0.78 < Θ < 20.00°), 5782 unique (Rint = 0.1630), 2644 (I > 2σ(I)); R1 = 0.1027 for observed and R1 = 0.2274 for all reflections; wR2 = 0.3134 for all reflections; max/min residual electron density = 0.484 and −0.360 e Å−3; data/restraints/parameters = 5782/396/503; GOF = 1.008. The asymmetric unit for FmocFF·(H2O)0.875 comprises two complete FmocFF molecules, one fully occupied H2O molecule and one partially occupied H2O molecule. Single crystal samples of FmocFF were extremely small and very weakly diffracting, synchrotron radiation was therefore essential for structure solution. A resolution limit of 1 Å was applied during integration. Due to the limited number of reflections only the main residue atoms were refined anisotropically. Atomic displacement parameters were restrained during refinement (SIMU and DELU in SHELX). In addition the geometry of one aromatic ring was constrained during refinement (AFIX 66 in SHELX). Diffuse electron density was modeled as H2O. These H2O molecules were refined without riding proton atoms however the appropriate number of protons were included in the refined formula unit. For FmocFF, data quality was not of sufficient quality to determine proton positions these were therefore place is geometrically estimated positions using the riding model. For a displacement ellipsoid plot of the asymmetric unit, see Fig. S3.†
789 reflections measured (0.78 < Θ < 20.00°), 5782 unique (Rint = 0.1630), 2644 (I > 2σ(I)); R1 = 0.1027 for observed and R1 = 0.2274 for all reflections; wR2 = 0.3134 for all reflections; max/min residual electron density = 0.484 and −0.360 e Å−3; data/restraints/parameters = 5782/396/503; GOF = 1.008. The asymmetric unit for FmocFF·(H2O)0.875 comprises two complete FmocFF molecules, one fully occupied H2O molecule and one partially occupied H2O molecule. Single crystal samples of FmocFF were extremely small and very weakly diffracting, synchrotron radiation was therefore essential for structure solution. A resolution limit of 1 Å was applied during integration. Due to the limited number of reflections only the main residue atoms were refined anisotropically. Atomic displacement parameters were restrained during refinement (SIMU and DELU in SHELX). In addition the geometry of one aromatic ring was constrained during refinement (AFIX 66 in SHELX). Diffuse electron density was modeled as H2O. These H2O molecules were refined without riding proton atoms however the appropriate number of protons were included in the refined formula unit. For FmocFF, data quality was not of sufficient quality to determine proton positions these were therefore place is geometrically estimated positions using the riding model. For a displacement ellipsoid plot of the asymmetric unit, see Fig. S3.†
Rheological measurements
Rheological measurements were carried out using an Anton Paar Physica MCR101 rheometer. A cup and vane system was used which allowed the direct measurement of gels formed in 7 mL Sterilin cups. Repeat measurements on fresh samples were carried out to ensure reproducibility between samples. Strain scans were performed from 0.1% to 100% under a frequency of 10 rad s−1. The critical strain was quoted as the point the G′ starts to deviate from linearity and ultimately cross over the G′′, resulting in gel breakdown.Frequency scans were performed from 1 rad s−1 to 100 rad s−1 under a strain of 0.5%. The shear moduli (storage modulus G′ and loss modulus G′′) were measured at a frequency of 10 rad s−1. All shear moduli measured were within the linear viscoelastic (LVE) region for the gels measured.
For the recovery test experiments, time sweep with a constant frequency of 10 rad s−1 and strain of 0.5% was first performed for 200 seconds, followed by higher strain of 300% for 60 seconds to totally destroy the gel to a liquid state. Restoration of the gel was monitored in the subsequent time sweep (with the frequency of 10 rad s−1 and strain of 0.5%) for 200 seconds again. The shear-recovery cycles were performed for 5 times for the same sample to check the reproducibility. The recovery ratios were calculated by the ratios of the average storage modulus (G′) after restoration with the original storage modulus obtained in the first step of time sweep.
Small-angle neutron scattering (SANS)
Small-angle neutron scattering (SANS) measurements were performed on the fixed-geometry, time-of-flight LOQ diffractometer (ISIS Spallation Neutron Source, Oxfordshire, UK). A white beam of radiation with neutron wavelengths spanning 2.2 to 10 Å was used to access a Q [Q = 4π![[thin space (1/6-em)]](https://www.rsc.org/images/entities/char_2009.gif) sin
sin![[thin space (1/6-em)]](https://www.rsc.org/images/entities/char_2009.gif) (θ/2)/λ] range of 0.005 and ≥0.3 Å−1 (25 Hz), with a fixed sample-detector distance of 4.1 m. Samples of volume ∼0.4 mL were contained in 2 mm path length, UV-spectrophotometer grade, quartz cuvettes (Hellma) and mounted in aluminium holders on top of an enclosed, computer-controlled, sample chamber with temperature controlled to 25 ± 0.5 °C by use of a thermostatted circulating bath pumping fluid through the base of the sample chamber. Experimental measuring times were approximately 40 minutes.
(θ/2)/λ] range of 0.005 and ≥0.3 Å−1 (25 Hz), with a fixed sample-detector distance of 4.1 m. Samples of volume ∼0.4 mL were contained in 2 mm path length, UV-spectrophotometer grade, quartz cuvettes (Hellma) and mounted in aluminium holders on top of an enclosed, computer-controlled, sample chamber with temperature controlled to 25 ± 0.5 °C by use of a thermostatted circulating bath pumping fluid through the base of the sample chamber. Experimental measuring times were approximately 40 minutes.
All scattering data were (a) normalized for the sample transmission, (b) background corrected using an empty quartz cell or one filled with the appropriate solvent (this also removes the inherent instrumental background arising from vacuum windows etc.) and (c) corrected for the linearity and efficiency of the detector response using the instrument-specific software package. The data were put onto an absolute scale by reference to the scattering from a partially deuterated polystyrene blend. Data were fitted using the Kholodenko–Dirac worm-like chain model, which analyses the data as a Gaussian distribution of m connected cylindrical elements of statistical length l and radius Rax, such that the contour length, L, is L = ml. This model therefore interpolates between the expected Q−1 dependence for the rod-like character of the cylindrical elements, the Q−2 associated with the cross-section of the cylinder and a limiting Q−4 associated with the globular nature over large distances.
UV turbidity measurements
UV-Vis absorption data was collected using a Thermo Scientific Nanodrop 2000/2000c spectrophotometer. Gels samples were prepared in situ in 1.0 cm pathlength PMMA cuvettes and monitored over time via sequential UV measurements at 600 nm as soon as water was added to the gelator stock solution. Measurements were taken every 5 seconds for 900 seconds. Quartz glass cuvettes were used for samples containing acetone.Acknowledgements
We thank the EPSRC for funding a studentship for JR. CMC acknowledges an Erasmus traineeship. Experiments at the ISIS Pulsed Neutron and Muon Source were supported by a beamtime allocation from the Science and Technology Facilities Council. We thank Diamond Light Source for access to beamline I19 (MT8728) that contributed to the results presented here. We would like to acknowledge the Liverpool CCI (Centre for Cell Imaging) for continuous support in this project.Notes and references
- V. Jayawarna, M. Ali, T. A. Jowitt, A. F. Miller, A. Saiani, J. E. Gough and R. V. Ulijn, Adv. Mater., 2006, 18, 611–614 CrossRef CAS.
- T. Liebmann, S. Rydholm, V. Akpe and H. Brismar, BMC Biotechnol., 2007, 7, 88–98 CrossRef PubMed.
- D. J. Adams, M. F. Butler, W. J. Frith, M. Kirkland, L. Mullen and P. Sanderson, Soft Matter, 2009, 5, 1856–1862 RSC.
- A. Mahler, M. Reches, M. Rechter, S. Cohen and E. Gazit, Adv. Mater., 2006, 18, 1365–1370 CrossRef CAS.
- J. Raeburn, G. Pont, L. Chen, Y. Cesbron, R. Levy and D. J. Adams, Soft Matter, 2012, 8, 1168–1174 RSC.
- A. M. Smith, R. J. Williams, C. Tang, P. Coppo, R. F. Collins, M. L. Turner, A. Saiani and R. V. Ulijn, Adv. Mater., 2008, 20, 37–41 CrossRef CAS.
- V. Jayawarna, S. M. Richardson, A. R. Hirst, N. W. Hodson, A. Saiani, J. E. Gough and R. V. Ulijn, Acta Biomater., 2009, 5, 934–943 CrossRef CAS PubMed.
- C. Tang, A. M. Smith, R. F. Collins, R. V. Ulijn and A. Saiani, Langmuir, 2009, 25, 9447–9453 CrossRef CAS PubMed.
- M. Zhou, A. M. Smith, A. K. Das, N. W. Hodson, R. F. Collins, R. V. Ulijn and J. E. Gough, Biomaterials, 2009, 30, 2523–2530 CrossRef CAS PubMed.
- N. Amdursky, R. Orbach, E. Gazit and D. Huppert, J. Phys. Chem. C, 2009, 113, 19500–19505 CAS.
- J. Raeburn, A. Zamith Cardoso and D. J. Adams, Chem. Soc. Rev., 2013, 42, 5143–5156 RSC.
- W. Helen, P. de Leonardis, R. V. Ulijn, J. Gough and N. Tirelli, Soft Matter, 2011, 7, 1732–1740 RSC.
- J. Ryu, S.-W. Kim, K. Kang and C. B. Park, Adv. Mater., 2010, 22, 5537–5541 CrossRef CAS PubMed.
- J. H. Kim, S. Y. Lim, D. H. Nam, J. Ryu, S. H. Ku and C. B. Park, Biosens. Bioelectron., 2011, 26, 1860–1865 CrossRef CAS PubMed.
- L. Chen, J. Raeburn, S. Sutton, D. G. Spiller, J. Williams, J. S. Sharp, P. C. Griffiths, R. K. Heenan, S. M. King, A. Paul, S. Furzeland, D. Atkins and D. J. Adams, Soft Matter, 2011, 7, 9721–9727 RSC.
- R. Orbach, I. Mironi-Harpaz, L. Adler-Abramovich, E. Mossou, E. P. Mitchell, V. T. Forsyth, E. Gazit and D. Seliktar, Langmuir, 2012, 28, 2015–2022 CrossRef CAS PubMed.
- N. A. Dudukovic and C. F. Zukoski, Soft Matter, 2014, 10, 7849–7856 RSC.
- H.-G. Braun and A. Z. Cardoso, Colloids Surf., B, 2012, 97, 43–50 CrossRef CAS PubMed.
- K. A. Houton, K. L. Morris, L. Chen, M. Schmidtmann, J. T. A. Jones, L. C. Serpell, G. O. Lloyd and D. J. Adams, Langmuir, 2012, 28, 9797–9806 CrossRef CAS PubMed.
- C. Yan and D. J. Pochan, Chem. Soc. Rev., 2010, 39, 3528–3540 RSC.
- C. Yan, A. Altunbas, T. Yucel, R. P. Nagarkar, J. P. Schneider and D. J. Pochan, Soft Matter, 2010, 6, 5143–5156 RSC.
- W.-H. Shih, W. Y. Shih, S.-I. Kim, J. Liu and I. A. Aksay, Phys. Rev. A: At., Mol., Opt. Phys., 1990, 42, 4772–4779 CrossRef CAS.
- F. C. Mackintosh, J. Kas and P. A. Janmey, Phys. Rev. Lett., 1995, 75, 4425–4428 CrossRef CAS.
- D. C. Morse, Macromolecules, 1998, 31, 7030–7043 CrossRef CAS.
- S. Rammensee, D. Huemmerich, K. D. Hermanson, T. Scheibel and A. R. Bausch, Appl. Phys. A: Mater. Sci. Process., 2006, 82, 261–264 CrossRef CAS.
- H. Isambert and A. C. Maggs, Macromolecules, 1996, 29, 1036–1040 CrossRef CAS.
- F. G. Schmidt, B. Hinner, E. Sackmann and J. X. Tang, Phys. Rev. E: Stat. Phys., Plasmas, Fluids, Relat. Interdiscip. Top., 2000, 62, 5509–5517 CrossRef CAS.
- D. J. Adams, L. M. Mullen, M. Berta, L. Chen and W. J. Frith, Soft Matter, 2010, 6, 1971–1980 RSC.
- N. A. Dudukovic and C. F. Zukoski, Langmuir, 2014, 4493–4500, DOI:10.1021/la500589f.
- D. B. Wong, K. P. Sokolowsky, M. I. El-Barghouthi, E. E. Fenn, C. H. Giammanco, A. L. Sturlaugson and M. D. Fayer, J. Phys. Chem. B, 2012, 116, 5479–5490 CrossRef CAS PubMed.
- J. Catalán, C. Díaz and F. García-Blanco, J. Org. Chem., 2001, 66, 5846–5852 CrossRef PubMed.
- H. Nowell, S. A. Barnett, K. E. Christensen, S. J. Teat and D. R. Allan, J. Synchrotron Radiat., 2012, 19, 435–441 CrossRef CAS PubMed.
- G. M. Sheldrick, SADABS, University of Göttingen, Germany, 2008 Search PubMed.
- G. Sheldrick, Acta Crystallogr., Sect. A: Found. Crystallogr., 2008, 64, 112–122 CrossRef CAS PubMed.
- O. V. Dolomanov, L. J. Bourhis, R. J. Gildea, J. A. K. Howard and H. Puschmann, J. Appl. Crystallogr., 2009, 42, 339–341 CrossRef CAS.
Footnote |
| † Electronic supplementary information (ESI) available: Full experimental details, full rheological data, single crystal (monoclinic C2, a = 52.27(6), b = 5.010(6), c = 22.83(3) Å; β 105.49(3)°; V = 5761(11) Å3) and pXRD data. CCDC 1027570. For ESI and crystallographic data in CIF or other electronic format see DOI: 10.1039/c4sm02256d |
| This journal is © The Royal Society of Chemistry 2015 |

