 Open Access Article
Creative Commons Attribution 3.0 Unported Licence
Elasticity of 3D networks with rigid filaments and compliant crosslinks
Knut M.
Heidemann
a,
Abhinav
Sharma
b,
Florian
Rehfeldt
b,
Christoph F.
Schmidt
*b and
Max
Wardetzky
*a
aInstitute for Numerical and Applied Mathematics, Georg-August-Universität, Göttingen, Germany. E-mail: wardetzky@math.uni-goettingen.de
bThird Institute of Physics—Biophysics, Georg-August-Universität, Göttingen, Germany. E-mail: cfs@physik3.gwdg.de
First published on 15th October 2014
Abstract
Disordered filamentous networks with compliant crosslinks exhibit a low linear elastic shear modulus at small strains, but stiffen dramatically at high strains. Experiments have shown that the elastic modulus can increase by up to three orders of magnitude while the networks withstand relatively large stresses without rupturing. Here, we perform an analytical and numerical study on model networks in three dimensions. Our model consists of a collection of randomly oriented rigid filaments connected by flexible crosslinks that are modeled as wormlike chains. Due to zero probability of filament intersection in three dimensions, our model networks are by construction prestressed in terms of initial tension in the crosslinks. We demonstrate how the linear elastic modulus can be related to the prestress in these networks. Under the assumption of affine deformations in the limit of infinite crosslink density, we show analytically that the nonlinear elastic regime in 1- and 2-dimensional networks is characterized by power-law scaling of the elastic modulus with the stress. In contrast, 3-dimensional networks show an exponential dependence of the modulus on stress. Independent of dimensionality, if the crosslink density is finite, we show that the only persistent scaling exponent is that of the single wormlike chain. We further show that there is no qualitative change in the stiffening behavior of filamentous networks even if the filaments are bending-compliant. Consequently, unlike suggested in prior work, the model system studied here cannot provide an explanation for the experimentally observed linear scaling of the modulus with the stress in filamentous networks.
1 Introduction
The mechanical properties of biological cells are governed by the cytoskeleton, a viscoelastic composite consisting of three main types of linear protein polymers: actin, microtubules, and intermediate filaments. These filamentous polymers are crosslinked by various binding proteins and constitute a dynamic complex network that maintains the structural integrity of the cell with the capacity for dynamic reorganization needed for active processes. Many in vitro studies have focused on reconstituted networks with rigid crosslinks.1–12 In the cytoskeleton, however, many of the crosslinks are themselves extended and highly compliant proteins. Such flexible crosslinks can strongly affect the macroscopic network elasticity.13–21 Indeed, experimental studies show that composite networks can have a linear modulus as low as ∼1 Pa, while being able to stiffen by up to a factor of 1000.11,14Here we analyze 3-dimensional (3D) composite networks theoretically, and we offer physical simulations thereof. Our networks are composed of randomly oriented rigid filaments that are connected by highly flexible crosslinks, each of which is modeled as a wormlike chain (WLC),22,23 which has been shown to accurately describe flexible crosslinkers, such as filamin.24,25 In our approach we assume that the filaments are much more rigid than the crosslinks, meaning that the network elasticity is dominated by the entropic stretching resistance of the crosslinks.
In our theoretical analysis we adopt the widely employed assumption of affine deformations.16,19,26 Under this premise, the network is assumed to deform affinely on the length scale of the filaments, which in turn is assumed to be much longer than the contour length of the crosslinks. Using a single filament description in the limit of a continuous distribution of crosslinks along the filament, we obtain the asymptotic scaling behavior of the elastic modulus with the stress in the nonlinear regime. We show that in 1-dimensional (1D) networks, the elastic modulus scales with the second power of the stress, whereas it scales with the third power in 2-dimensional (2D) networks. Remarkably, there is no power law scaling in 3D—in fact, the elastic modulus of a 3D composite network increases exponentially with the stress. Numerical evaluation of the affine theory at finite crosslink densities—as opposed to a continuous distribution of crosslinks—shows that (i) the only asymptotic scaling is the modulus scaling with an exponent 3/2 with the stress and that (ii) the dependence on dimensionality of the system is limited to an intermediate-stress regime. These findings are in agreement with our extensive physical simulations of 3D composite networks. For all cases, the elastic modulus diverges at a finite strain.
Our theoretical analysis is inspired by the mean-field model proposed by Broedersz et al.16,26 In sharp contrast to our theoretical analysis and to the results of our physical simulations, however, these authors predict linear scaling of the elastic modulus with applied stress. In particular, for any finite strain, the elastic modulus remains finite in their model. While this linear scaling of the elastic modulus is in accordance with what has been observed experimentally,13,20,21 we here argue that this model does not adequately capture the elastic response of networks with rigid filaments and permanent (i.e., non rupturing or rebinding) crosslinks of finite length.
In ref. 19, the authors ruled out that the experimentally observed approximately linear scaling of the modulus with the stress might be due to enthalpic (linear) stretching compliance of the crosslinks or filaments. Here, we complement their analysis by physical simulations that take into account bending of filaments. Our results empirically show that the inclusion of bending rigidity does not impact the nonlinear stiffening behavior of composite networks either. We therefore conclude that the theoretical explanation for the linear scaling of the modulus with stress in experiments remains a challenging open problem.
By physical simulations, we also study the role of prestress. We show that in contrast to 1D and 2D networks, 3D networks experience an initial tension due to non-intersecting filaments resulting in initially stretched crosslinks, and are therefore prestressed. The modulus in the linear deformation regime is then governed by this prestress; indeed, it is higher than the modulus expected from the affine theory. Our simulations additionally indicate that if the network is allowed to relax initial tension by unbinding and rebinding of crosslinks, the impact of prestress on the elastic modulus in the linear regime becomes insignificant, although the prestress does not relax all the way to zero.
The remainder of the article is organized as follows. First, we present the affine theory of composite networks in Section 2. Under the assumption that deformations of the network are affine on the length scale of the filaments, we derive expressions for the stress and modulus in 1D, 2D, and 3D. We then present our physical simulation model and describe our network generation procedure in Section 3. We expand on the implications of our 3D simulation procedure in Section 4; in particular, we explain the emergence of prestress. We then discuss the results of our simulations in the linear deformation regime in Section 5 and indicate which results from the affine theory are still valid. Finally, we analyze the simulation results in the nonlinear regime in Section 6.
2 Theory
In this section we analytically derive the stress and modulus of a composite network under the assumption of affine deformations on the length scale of the filaments. We consider a collection of N rigid filaments of length L that are permanently connected by nN/2 flexible crosslinks of contour length l0, where n is referred to as the crosslink density, i.e., the number of crosslinks per filament. The filaments are assumed to be perfectly rigid, i.e., they neither bend nor stretch, and the crosslinks are modeled via the WLC interpolation formula23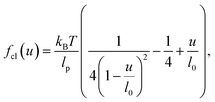 | (1) |
 | (2) |
Imposing affine deformations on the filament level fully determines the deformation field u on the subfilament level. In the following analysis, we consider a single representative filament subject to an extensional strain of the surrounding medium that it is embedded in and crosslinked to.
2.1 1D network calculation
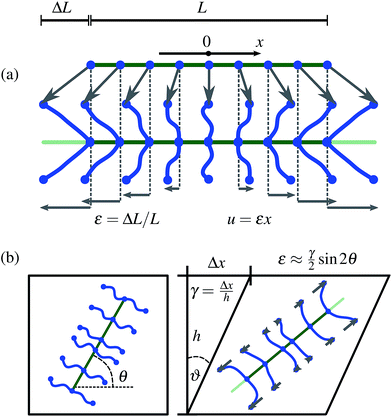
We start with a one dimensional system, i.e., 1D extensional strain ε, and advance in dimensionality by converting an applied shear strain γ into the orientation dependent extensional strain ε(γ) felt by the filament.In the rest frame of the filament, the end-to-end distance of a crosslink at distance x from the center of the filament is given by |u(x,ε)| = |εx| (see Fig. 1(a)). For notational convenience, we consider positive ε only. Under the assumption that the crosslink density is high enough that one can consider the associated distribution as uniformly continuous, the total energy of a filament in 1D is given by
 | (3) |
Following the described approach for the linear regime of the WLC force–extension relation, i.e., for u ≪ l0, the linear modulus may be extracted as  , where E/V is the energy per unit volume V in the network and ε is a small strain.27 For a 1D system this yields
  , with
  being the linear spring constant of a crosslink and ρ: = NL/V the total length of filaments per unit volume. The same holds for the modulus in 2D and 3D, but with different numerical prefactors: 1/96 and 1/192, respectively.16,19,26
Next we show that one can extract a functional relation between the nonlinear modulus and stress in the nonlinear regime, based on simple asymptotic scaling analysis. It follows from above that there is a strain εd: = l0/(L/2) at which the outer most crosslink (at x = L/2) reaches maximum extension. For ε → εd the energy diverges as follows
 | (4) |
 and
and  , respectively, in order to obtain σ1D ∼ 1/(1 − ε/εd), and K1D ∼ 1/(1 − ε/εd)2. We arrive at the asymptotic scaling relation
| K1D ∼ (σ1D)2. | (5) |
This scaling relation between the modulus and stress in 1D has also been derived in previous work.19 Next we consider scaling relations in 2D and 3D.
2.2 2D network calculation
We perform similar calculations as in 1D, while taking into account that the extensional strain ε, which results from a shear strain γ on a 2D system, depends on the orientation of the filament under consideration. In the small-strain limit one thus obtains|ε(γ, θ)| = |(γ/2)![[thin space (1/6-em)]](https://www.rsc.org/images/entities/char_2009.gif) sin sin![[thin space (1/6-em)]](https://www.rsc.org/images/entities/char_2009.gif) 2θ|, 2θ|, | (6) |
Substituting this expression into eqn (4) and averaging over all orientations leads to
 | (7) |
![[thin space (1/6-em)]](https://www.rsc.org/images/entities/char_2009.gif) 2θ| is π/2-periodic. Note that we do not take into account a redistribution of filament orientations under the shear transformation. This approach, as well as the small-strain approximation for ε(γ, θ), are justified if L ≫ l0, since then the strain γd: = 4l0/L at which the integrand diverges is small.
2θ| is π/2-periodic. Note that we do not take into account a redistribution of filament orientations under the shear transformation. This approach, as well as the small-strain approximation for ε(γ, θ), are justified if L ≫ l0, since then the strain γd: = 4l0/L at which the integrand diverges is small.
Differentiating eqn (7) with respect to γ and neglecting the weaker (logarithmically) diverging part of the integrand lead to an expression for the stress, as γ → γd:
 | (8) |
 | (9) |
| K2D ∼ (σ2D)3. | (10) |
2.3 3D network calculation
For a 3D network, the extensional strain on a filament in the small-strain limit is given by|ε(γ, θ, ϕ)| = |(γ/2)![[thin space (1/6-em)]](https://www.rsc.org/images/entities/char_2009.gif) sin sin![[thin space (1/6-em)]](https://www.rsc.org/images/entities/char_2009.gif) 2θ 2θ![[thin space (1/6-em)]](https://www.rsc.org/images/entities/char_2009.gif) cos cos![[thin space (1/6-em)]](https://www.rsc.org/images/entities/char_2009.gif) ϕ|, ϕ|, | (11) |
 | (12) |
![[thin space (1/6-em)]](https://www.rsc.org/images/entities/char_2009.gif) ϕ| is π-periodic and symmetric about π/2 on [0,π]. If we carry out the ϕ integral and expand the integrand around θ = π/4, in order to integrate over θ (see Appendix A.2 for details), we obtain σ3D ∼ −ln(1 − γ/γd) and hence K ∼ 1/(1 − γ/γd). Consequently, K does not scale with σ as a power law; instead, one obtains
ϕ| is π-periodic and symmetric about π/2 on [0,π]. If we carry out the ϕ integral and expand the integrand around θ = π/4, in order to integrate over θ (see Appendix A.2 for details), we obtain σ3D ∼ −ln(1 − γ/γd) and hence K ∼ 1/(1 − γ/γd). Consequently, K does not scale with σ as a power law; instead, one obtains| K3D ∼ ecσ3D, | (13) |
 | (14) |
![[thin space (1/6-em)]](https://www.rsc.org/images/entities/char_2009.gif) K versus ln
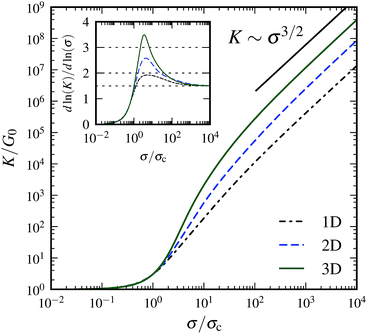
K versus ln![[thin space (1/6-em)]](https://www.rsc.org/images/entities/char_2009.gif) σ plots; e.g., for n = 60 the maximal slope is 3.49, for n = 3000 it is 5.82. However, for any finite n, eventually there is always universal scaling of K ∼ σ3/2, resulting from the single WLC force–extension relation, independent of the dimensionality of the system. Indeed, for any given n, the integral representation eqn (3) becomes invalid close to γ = γd due to the divergence of the WLC energy.
σ plots; e.g., for n = 60 the maximal slope is 3.49, for n = 3000 it is 5.82. However, for any finite n, eventually there is always universal scaling of K ∼ σ3/2, resulting from the single WLC force–extension relation, independent of the dimensionality of the system. Indeed, for any given n, the integral representation eqn (3) becomes invalid close to γ = γd due to the divergence of the WLC energy.
The numerical results in Fig. 2 have been obtained without the small-strain approximation for the extension of the filaments. However, the redistribution of the filament orientations under shear has not been taken into account in Fig. 2. Calculations including this effect show that it may both decrease and increase the maximum intermediate slope in the ln![[thin space (1/6-em)]](https://www.rsc.org/images/entities/char_2009.gif) K versus ln
K versus ln![[thin space (1/6-em)]](https://www.rsc.org/images/entities/char_2009.gif) σ plot and shift the peak to larger stress values depending on the maximum strain γd. In any case, the asymptotic scaling regime remains unchanged.
σ plot and shift the peak to larger stress values depending on the maximum strain γd. In any case, the asymptotic scaling regime remains unchanged.
In the next section we introduce the simulation framework that we use to study 3D networks consisting of many filaments and crosslinks, relaxing the assumption of affine deformations.
3 Simulation model
We perform quasistatic simulations of 3D networks that consist of N rigid filaments of length L, permanently crosslinked by a collection of nN/2 crosslinks of length l0. All lengths are measured in units of the side length of the cubic periodic simulation box. A typical set of parameters is N = 3000, L = 0.3, n = 60, and l0 = 0.03.Each filament is modeled as perfectly rigid, implying that its configuration can be described by its two endpoints only, which are constraint to stay at distance L. The flexible crosslinks are modeled as a central force acting between the two binding sites. In particular, we use the WLC interpolation formula (eqn (1)) and the corresponding energy (eqn (2)). In all data that are presented, forces are measured in units of (kBT)/lp. There are no additional degrees of freedom introduced through the crosslinks, since their configuration is represented via the endpoints of the filaments, in terms of barycentric coordinates.
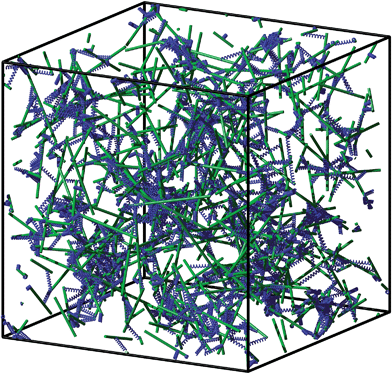
In order to generate an initial network configuration we proceed as follows. We generate N randomly distributed filaments by first randomly choosing their centers of mass in our simulation box and by then picking a random orientation for each filament. For crosslinking we apply the following iterative procedure. We randomly choose two points on distinct filaments and insert a crosslink if the corresponding point-to-point distance is shorter than a certain threshold αl0. Here α ∈ [0,1) serves as a parameter to vary the initially allowed crosslink lengths in the system. This procedure is repeated until the desired number of crosslinks is reached; see Fig. 3 for an illustration of the final configuration. Since we perform quasistatic simulations, the system must be at static equilibrium at all times. As practically all crosslinks will be stretched beyond their rest-length after the initial network generation, we minimize the energy (of the crosslinks) before subjecting the simulation box to any deformation.‡ For energy minimization we use the freely available external library IPOPT,28 which requires the gradient and the Hessian of the system's energy function. It might happen during the optimization process that individual crosslinks reach extensions u larger than their contour length l0. Acceptance of these solutions is prohibited by setting the energy to infinity (1019) for u ≥ l0 in eqn (2); without this modification it would become negative in that regime. The length constraints for the filaments are realized via Lagrange multipliers.
In order to extract elastic properties of the network we perform quasistatic shearing by applying an affine incremental shear strain δγ to the network, with subsequent rescaling of filaments to length L (see Fig. 1). We apply Lees–Edwards shearing periodic boundary conditions.29 The magnitude of δγ is determined by calculating the maximum affine shear that leaves all crosslinks below their contour length. Due to the rescaling of filament lengths, a nonaffine deformation component is introduced. This nonaffinity may lead to crosslinks being overstretched after all. In this case, we iteratively halve the shear strain until the length of all crosslinks remains below their contour length. After each shear increment, the energy is minimized. We apply a fixed upper bound of 1% strain on δγ in order to stay reasonably close to the previous solution. This increases numerical efficiency and accelerates convergence because it allows us to use a warm-start procedure that reuses Lagrange multipliers from one minimization as initial guesses for the next one. Moreover, the application of small shear steps reduces the likelihood of discontinuously jumping between local energy minima.
We stop shearing when the achievable increment in shear strain becomes smaller than a chosen threshold due to crosslinks that are very close to their maximum extension. During the entire simulation process, we record network parameters in the equilibrated states—in particular, the energy E as a function of shear strain γ. This allows us to extract the shear stress  as well as the differential shear elastic modulus
  . Derivatives are taken by first interpolating E(γ) with a cubic spline. We define the linear shear elastic modulus as
| G0 ≔ K|γ=0. | (15) |
In the following section we discuss the implications of our specific simulation model, in particular with respect to the network structure, and contrast it with previous studies that have been carried out mostly in 2D.
4 Initial tension and prestress
As mentioned in Section 3, our network generation results in a non-zero initial energy E0 at zero strain. Indeed, by randomly placing (zero-diameter) filaments in a 3D container, filaments have zero probability to intersect; thus, crosslinks have finite initial extension with probability one. This is different from 2D, where randomly placed filaments mutually intersect with a probability approaching one as their number increases. Indeed, so-called Mikado models,19,30–32 where filaments are crosslinked at their intersection sites only, exhibit no forces at zero strain.In contrast, the initial stretching of crosslinks in our networks results in an initial tension before any deformation. For a quantitative analysis we measure a global variant of this effect by what we call total prestress σ0, which measures the normal stress§ component orthogonal to the shear planes.¶ More precisely, we measure the single sided (e.g., upward) normal component of the force that is acting on a given shear plane, by summing up the normal components of the forces exerted by each crosslink and filament passing through the given shear plane, see Fig. 4(a). The normal stress is then given by dividing by the surface area of the shear plane. Note that σ0 does not depend on the choice of a particular shear plane; indeed, if the total stress was changing during vertical movement of a shear plane, then this would immediately contradict force balance in the system.
 | ||
| Fig. 4 (a) Measuring the total prestress σ0 by extracting the normal component of the total force acting on a shear plane. We sum up all the forces acting on one side of the plane exerted by (i) the crosslinks passing through (here f2 and f4) and (ii) the filaments passing through (here f1 + f3)—then we project onto the normal vector n. (b) A tensegrity structure (here: Snelson's X33) remains in static equilibrium without the application of boundary conditions. The forces acting on any plane add up to zero, i.e. no plane carries any total prestress although it is under tension locally. | ||
Intuitively, one might expect negative normal stresses (pulling down on the upper face of the simulation box), since crosslinks are contractile. However, since filaments withstand compression, it is possible to construct systems that exhibit positive normal stress. This suggests the existence of configurations with zero normal stress.|| Indeed, so-called tensegrity structures,34 which are in static equilibrium in the absence of boundary conditions satisfy this criterion—while still being able to store arbitrary amounts of energy (see Fig. 4(b)). Empirically, our simulations show that the random networks generated by the procedure described in Section 3 exhibit negative initial normal stresses throughout. Their integrity is provided through the application of periodic boundary conditions. Note, in particular, that our setup enforces conservation of the volume of the simulation box. In general, it would be possible to relax the prestress by letting the volume of the simulation box change. However, we did not follow this approach in the study presented here, in order to ensure that the filament length remains significantly smaller than the size of the simulation box.
In the following, we relate total prestress to the linear elastic response of our networks.
5 Linear regime
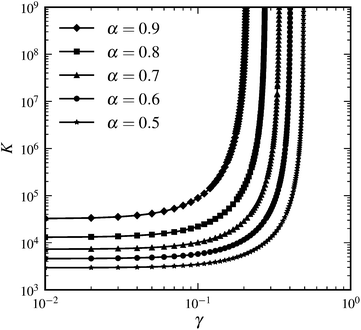
In previous work,16,19,26 an expression for the linear modulus in 3D was derived under the assumption of affine deformations and in the absence of any initial tension in the network. Our simulations show that the linear elastic modulus depends on the initial tension in the network.One scenario that clearly demonstrates the dependence of the linear modulus G0 (defined in eqn (15)) on the initial tension is shown in Fig. 5 where the admissible maximum initial crosslink length was varied.
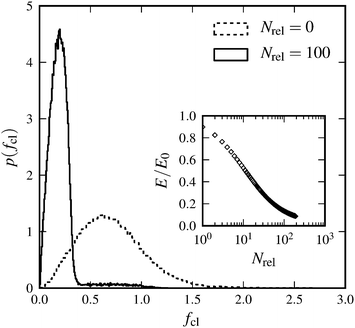
For a more quantitative analysis we have designed a method that allows us to change initial tension for a network with a fixed set of simulation parameters. We first randomly generate a network as described above and let it relax into static equilibrium. We then remove a given amount (5%) of the most-stretched crosslinks in the system. Then we reconnect those crosslinks randomly again, and let the network relax. This procedure is repeated Nrel times. Thereby, we successively decrease the system's initial tension, and therefore also its total energy, see the inset of Fig. 6. Not only does the total energy decrease, we also observe a change in the distribution of forces (see Fig. 6). As long as one performs the crosslink binding–unbinding procedure over a small enough fraction of crosslinks, the network remains nearly isotropic.
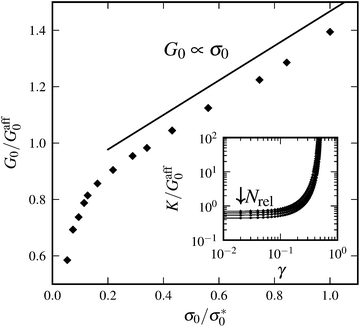
It is apparent from the inset of Fig. 7 that the linear elastic modulus is reduced by increasing the number of relaxation steps, as expected. Fig. 7 also shows the dependence of linear modulus G0 on the total prestress σ0, which has been introduced in Section 4. We varied σ0via the above described procedure, and measured G0 with the shearing protocol described in Section 3. After a certain number of relaxation steps the empirical value for G0 equals the value Gaff0 expected from affine theory (see Section 2.1). Relaxing initial tension further, we reach moduli even below Gaff0. This is possible because the network can rearrange nonaffinely, thereby softening its response. Over a certain range of total prestresses, we observe linear scaling of G0 with σ0, a phenomenon, which has been discussed in other contexts before (see for example ref. 35). We explain the linear regime as follows. For small strains the normal component σN of the stress acting on shear planes is close in magnitude to the total prestress σ0, i.e., σN ≈ σ0. For small strains given by shear angles ϑ ≈ 0, total forces acting on the shear planes make an angle φ with the direction normal to the shear planes (see Fig. 8). Our simulations show that tan![[thin space (1/6-em)]](https://www.rsc.org/images/entities/char_2009.gif) φ ∝ tan
φ ∝ tan![[thin space (1/6-em)]](https://www.rsc.org/images/entities/char_2009.gif) ϑ and that the constant of proportionality remains unchanged in the linear scaling regime. Therefore, shear satisfies
ϑ and that the constant of proportionality remains unchanged in the linear scaling regime. Therefore, shear satisfies
 | (16) |
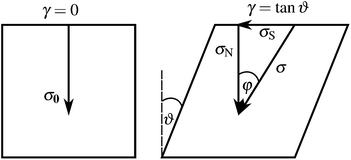 | ||
Fig. 8 The initial network carries a total prestress σ0. After a small shear γ = tan![[thin space (1/6-em)]](https://www.rsc.org/images/entities/char_2009.gif) ϑ has been applied it exhibits shear stress σS and normal stress σN, with tan ϑ has been applied it exhibits shear stress σS and normal stress σN, with tan![[thin space (1/6-em)]](https://www.rsc.org/images/entities/char_2009.gif) φ = σS/σN. φ = σS/σN. | ||
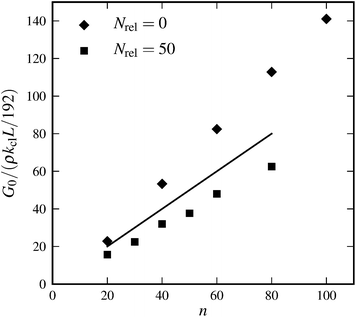
Furthermore, affine theory predicts linear scaling of the modulus G0 with crosslink density n. Fig. 9 shows that this linear scaling is indeed reproduced in our simulations, independent of the prestress. Moreover, by changing the prestress via our relaxation procedure it is possible to reach comparable slopes to what is predicted by the affine theory.
The next section deals with the nonlinear elastic response of the simulated networks, and relates it to the theoretical results that were derived in Section 2.
6 Nonlinear regime
6.1 Critical strain
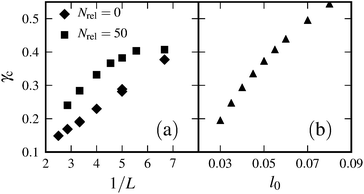
The networks that we study are inherently nonlinear because crosslinks are WLCs with finite length l0 (see eqn (1)), resulting in pronounced strain stiffening at a critical strain γc. Stress diverges at a higher strain γd. In our simulations, we define the critical strain γc to be the strain where K/G0 ≈ 3. In the affine theory, γd and γc scale linearly with the ratio of crosslink to filament length l0/L. In our simulations, we cannot conclusively report on this dependence because the accessible ranges for l0 and L are quite limited. On the one hand, there exists an upper limit for L (therefore also for l0, since l0/L ≪ 1 should hold) to be significantly smaller than the simulation box. On the other hand, L and l0 are bounded from below due to computational limitations—this is because we need to increase the number of filaments in order to keep networks homogenous.For ranges that are accessible to our simulations, we obtain the following results. If we fix l0, then we observe linear scaling γc ∝ 1/L for systems where no relaxation procedure has been applied (see Fig. 10(a)). Relaxed systems, however, sometimes show a less than linear dependence. This effect might be due to anisotropies induced by the relaxation procedure. If we fix L, then the dependence of γc on l0 is slightly less than linear (see Fig. 10(b)).
6.2 Differential modulus
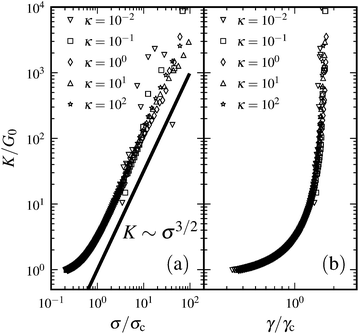
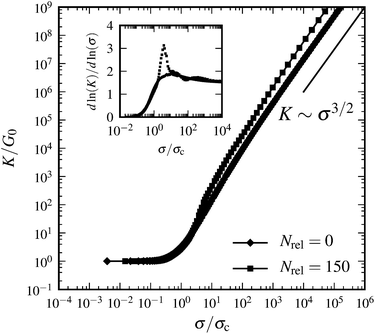
It remains to discuss the dependence of the differential modulus on stress, the affine theory of which has been derived in Section 2. For finite crosslink densities, the only persistent scaling behavior is K ∼ σ3/2, as γ approaches γd—due to the fact that eventually the single WLC response dominates. In an intermediate regime, above the critical stress σc = σ(γc), we observe slopes (d![[thin space (1/6-em)]](https://www.rsc.org/images/entities/char_2009.gif) ln
ln![[thin space (1/6-em)]](https://www.rsc.org/images/entities/char_2009.gif) K/d
K/d![[thin space (1/6-em)]](https://www.rsc.org/images/entities/char_2009.gif) ln
ln![[thin space (1/6-em)]](https://www.rsc.org/images/entities/char_2009.gif) σ) > 3/2. The majority of the simulations shows intermediate slopes around 2 or slightly above, mostly independent of simulation parameters, but there are also realizations that show maximum slopes up to 3.5 (see Fig. 11). These higher slopes and the final scaling K ∼ σ3/2 are in accordance with the predictions of affine theory. Indeed, a slope of 3.5 is the maximum slope predicted by the affine theory when using the same crosslink density as in the simulation (Fig. 2). There are, however, differences between theory and simulation in terms of slope profiles since various assumptions are made by the theory that do not hold in the simulations: a randomly generated network does not have a uniform crosslink density along the filaments, these systems are prestressed, and there is no perfect isotropy. Moreover, the networks do not deform perfectly affinely.
σ) > 3/2. The majority of the simulations shows intermediate slopes around 2 or slightly above, mostly independent of simulation parameters, but there are also realizations that show maximum slopes up to 3.5 (see Fig. 11). These higher slopes and the final scaling K ∼ σ3/2 are in accordance with the predictions of affine theory. Indeed, a slope of 3.5 is the maximum slope predicted by the affine theory when using the same crosslink density as in the simulation (Fig. 2). There are, however, differences between theory and simulation in terms of slope profiles since various assumptions are made by the theory that do not hold in the simulations: a randomly generated network does not have a uniform crosslink density along the filaments, these systems are prestressed, and there is no perfect isotropy. Moreover, the networks do not deform perfectly affinely.
6.3 Nonaffinity
In order to study to what extent simulation results deviate from affine theory, apart from prestress, nonuniform crosslink density, and anisotropy, we analyze the nonaffinity of the network deformation under shear. For a single filament, we define its differential nonaffinity with respect to the center of mass by | (17) |
We let δΓ denote the average of the differential nonaffinities over all filaments. Affine approximations imply δΓ = 0. Fig. 12 shows that center of mass deformations are mostly affine for small strains. However, the differential nonaffinity increases starting at a strain around γc and eventually diverges as γ → γd. This can be understood, since the networks are strain stiffening, such that small incremental strain can induce a large increase in the forces of individual crosslinks, thereby inducing large local rearrangements during energy minimization.
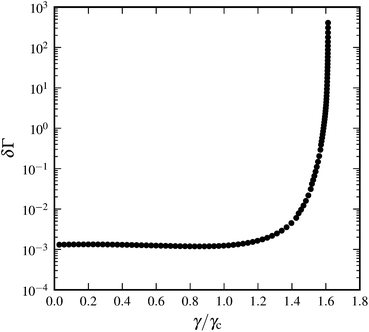 | ||
| Fig. 12 Differential nonaffinity δΓ as a function of scaled shear strain γ/γc for a system with N = 3000, n = 60, L = 0.3, l0 = 0.06, and α = 0.05. | ||
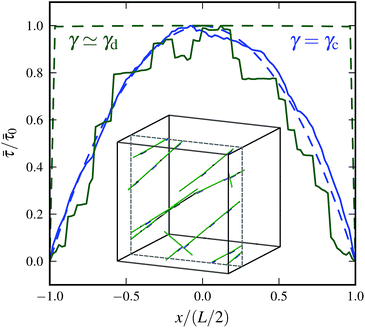
While increasing shear strain, there are force chains36–38 developing in the network, which carry most of the tension, and which cannot reduce their strain due to the fact that they span the entire system (see the inset of Fig. 13). We quantify this effect by considering tension profiles along filaments. The tension τ at position x along a filament is given via , where {xi} are the crosslink binding sites and {ui} are their extensions (ui = εxi in affine theory). Fig. 13 shows tension profiles averaged over all filaments for both, theoretical and simulated systems at various strains. In the simulations there is non-zero tension at zero strain due to prestress. With increasing γ, the simulations resemble the profiles expected from affine theory. However, when approaching the maximum strain γd, the emergence of selective paths (force chains) that carry most of the tension becomes evident. The highly stretched crosslinks dominate the averaged tension profiles and therefore lead to jumps in the tension curves at the respective binding sites along the filament (green solid curve in Fig. 13).
6.4 Bending
Thus far we have restricted our theory and simulations to rigid filaments that can neither bend nor stretch. In ref. 19, the authors considered finite stretching compliance of filaments, while bending compliance was assumed to be zero. They report that finite stretching stiffness does not impact the nonlinear stiffening regime of a composite network apart from the expected convergence (to some constant value) of the modulus at high strains. Here we complement this analysis by considering filaments that have finite bending but no stretching compliance. We performed simulations on a 2D network because of the relative computational ease compared to the 3D case. In addition to the energy stored in the crosslinks, we consider bending energy of the form Eb = κθ2/(2lav), where κ is the bending rigidity, θ is the angle through which the filaments bend locally, and lav = (l1 + l2)/2 is the average distance between two adjacent pairs of crosslinks (Fig. 14). We show the results in Fig. 15. The range of bending rigidity was chosen such that the linear modulus was still determined by the soft stretching modes of the crosslinks, so that bending did not impact the linear regime. As can be seen from these plots, bending compliance does not impact the nonlinear stiffening regime either—since bending modes are geometrically prohibited for large strains.Thus, in isolation, neither bending nor stretching compliance of filaments impacts the nonlinear stiffening regime of composite networks. These findings suggest that the theoretical models at present cannot explain the K ∼ σ scaling observed in experiments.
7 Conclusions
We have studied the elastic properties of composite crosslinked filamentous networks in 3D analytically and numerically. We modeled such networks as a collection of rigid filaments connected by WLC crosslinks.Based on the affine theory introduced in ref. 19 we derived asymptotic power law scaling exponents for the differential elastic modulus with stress, in the limit of infinite crosslink density. In this case, the scaling exponents depend on the dimensionality of the system. In particular, we showed that 3D systems no longer exhibit a power law. Furthermore, we showed that for finite crosslink densities, the only persistent regime (over several orders of magnitude of stress) is the σ3/2 scaling, as it is derived from the single WLC force–extension relation, eqn (1). This is in sharp contrast with the model proposed in ref. 16 and 26, where linear scaling was suggested, independent of the dimensionality of the system. This model implies finite stress at any strain and therefore does not apply to composite networks of rigid filaments with flexible crosslinks of finite length.
We further developed a simulation framework that allows us to measure the elastic response of random filamentous networks with WLC crosslinks. One important property of these 3D networks is that, by construction, they are prestressed due to initial extensions of the crosslinks. In addition to geometrical constraints, active elements such as motors can induce prestress as well.39 We showed that the prestress in a network can dominate the linear response and might therefore be a feature that is worthwhile analyzing in experimental systems.
Regarding the nonlinear response, we observed divergence of stress (and differential modulus) at finite strain. Close to this strain we measured power law scaling of the differential modulus with stress, with an exponent 3/2, just as expected for a single WLC. In an intermediate-stress regime we observed local exponents that span the entire range of theoretically derived values for systems of differing dimensionality. The fact that our simulation results do not always resemble the predictions of a 3D affine theory, in this intermediate regime, may be attributed to nonaffine deformations. Extracting the exact set of assumptions—such as uniform crosslink density, isotropy, or zero prestress—that are responsible for these discrepancies is left for future investigation.
Experiments (see, e.g., ref. 13, 20, and 21) have shown that in the nonlinear regime the differential modulus scales approximately linearly with the shear stress. We did not find such a regime in our simulations—neither when working with rigid filaments nor when incorporating finite bending stiffness (or enthalpic stretching as done in ref. 19). Therefore, we argue that none of the currently available theories can adequately explain the linear scaling of the differential modulus observed experimentally. It could possibly be that the WLC model does not accurately describe the elastic response of a single crosslink throughout the whole experimentally accessible regime. We speculate, however, that the linear scaling might be due to thermal fluctuations of the filaments, which have not been considered so far.
A Derivation of scaling relations for the shear modulus
A.1 1D network
The integral eqn (3) for the total energy of a single filament can be solved to give | (18) |
 , which is therefore the only one that we need to consider for the asymptotic scaling analysis in 2D and 3D.
A.2 3D network
To approximate the solution of the integral in eqn (12) we first carry out the ϕ integration analytically and obtain | (19) |
 as a constant because it takes finite values around the pole. Since we are interested in the regime close to the divergence of the integrand, we expand sin2
![[thin space (1/6-em)]](https://www.rsc.org/images/entities/char_2009.gif) 2θ up to the second order in ν: = θ − π/4. We arrive at
2θ up to the second order in ν: = θ − π/4. We arrive at | (20) |
![[thin space (1/6-em)]](https://www.rsc.org/images/entities/char_2009.gif) 2θ are negligible, regarding the asymptotics, because the integrand diverges right at the center of the interval. Now we define μ: = 1 − γ/γd and drop all terms higher than the first order in μ, since we are interested in the behavior close to γ = γd. With η2: = 4ν2 and δ: = 2μ, we obtain
2θ are negligible, regarding the asymptotics, because the integrand diverges right at the center of the interval. Now we define μ: = 1 − γ/γd and drop all terms higher than the first order in μ, since we are interested in the behavior close to γ = γd. With η2: = 4ν2 and δ: = 2μ, we obtain | (21) |
 | (22) |
∼ −ln![[thin space (1/6-em)]](https://www.rsc.org/images/entities/char_2009.gif) δ, δ, | (23) |
| ∼ −ln(1 − γ/γd), | (24) |
Acknowledgements
The authors would like to thank Fred MacKintosh for fruitful discussions. This work was funded by the Deutsche Forschungsgemeinschaft (DFG) within the collaborative research center SFB 755, project A3. We would like to thank the anonymous reviewers for their detailed suggestions for improving our manuscript.References
- P. A. Janmey, U. Euteneuer, P. Traub and M. Schliwa, J. Cell Biol., 1991, 113, 155–160 CrossRef CAS.
- F. C. MacKintosh and P. A. Janmey, Curr. Opin. Solid State Mater. Sci., 1997, 2, 350–357 CrossRef CAS.
- J. Xu, D. Wirtz and T. D. Pollard, J. Biol. Chem., 1998, 273, 9570–9576 CrossRef CAS PubMed.
- M. L. Gardel, J. H. Shin, F. C. MacKintosh, L. Mahadevan, P. Matsudaira and D. A. Weitz, Science, 2004, 304, 1301–1305 CrossRef CAS PubMed.
- M. L. Gardel, J. H. Shin, F. C. MacKintosh, L. Mahadevan, P. A. Matsudaira and D. A. Weitz, Phys. Rev. Lett., 2004, 93, 1–4 CrossRef.
- C. Storm, J. J. Pastore, F. C. Mackintosh, T. C. Lubensky and P. A. Janmey, Nature, 2005, 435, 191–194 CrossRef CAS PubMed.
- A. R. Bausch and K. Kroy, Nat. Phys., 2006, 2, 231–238 CrossRef CAS.
- G. H. Koenderink, M. Atakhorrami, F. C. MacKintosh and C. F. Schmidt, Phys. Rev. Lett., 2006, 96, 138307 CrossRef CAS.
- O. Chaudhuri, S. H. Parekh and D. A. Fletcher, Nature, 2007, 445, 295–298 CrossRef CAS PubMed.
- P. A. Janmey, M. E. McCormick, S. Rammensee, J. L. Leight, P. C. Georges and F. C. MacKintosh, Nat. Mater., 2007, 6, 48–51 CrossRef CAS PubMed.
- K. E. Kasza, A. C. Rowat, J. Liu, T. E. Angelini, C. P. Brangwynne, G. H. Koenderink and D. A. Weitz, Curr. Opin. Cell Biol., 2007, 19, 101–107 CrossRef CAS PubMed.
- J. Liu, G. H. Koenderink, K. E. Kasza, F. C. MacKintosh and D. A. Weitz, Phys. Rev. Lett., 2007, 98, 198304 CrossRef CAS.
- M. L. Gardel, F. Nakamura, J. H. Hartwig, J. C. Crocker, T. P. Stossel and D. A. Weitz, Proc. Natl. Acad. Sci. U. S. A., 2006, 103, 1762–1767 CrossRef CAS PubMed.
- M. L. Gardel, F. Nakamura, J. Hartwig, J. C. Crocker, T. P. Stossel and D. A. Weitz, Phys. Rev. Lett., 2006, 96, 088102 CrossRef CAS.
- B. A. DiDonna and A. J. Levine, Phys. Rev. E: Stat., Nonlinear, Soft Matter Phys., 2007, 75, 041909 CrossRef CAS.
- C. P. Broedersz, C. Storm and F. C. MacKintosh, Phys. Rev. Lett., 2008, 101, 118103 CrossRef CAS.
- P. Dalhaimer, D. E. Discher and T. C. Lubensky, Nat. Phys., 2007, 3, 354–360 CrossRef CAS.
- H. Lee, B. Pelz, J. M. Ferrer, T. Kim, M. J. Lang and R. D. Kamm, Cell. Mol. Bioeng., 2009, 2, 28–38 CrossRef CAS.
- A. Sharma, M. Sheinman, K. M. Heidemann and F. C. MacKintosh, Phys. Rev. E: Stat., Nonlinear, Soft Matter Phys., 2013, 88, 052705 CrossRef CAS.
- K. E. Kasza, G. H. Koenderink, Y. C. Lin, C. P. Broedersz, W. Messner, F. Nakamura, T. P. Stossel, F. C. MacKintosh and D. A. Weitz, Phys. Rev. E: Stat., Nonlinear, Soft Matter Phys., 2009, 79, 041928 CrossRef CAS.
- K. E. Kasza, C. P. Broedersz, G. H. Koenderink, Y. C. Lin, W. Messner, E. A. Millman, F. Nakamura, T. P. Stossel, F. C. Mackintosh and D. A. Weitz, Biophys. J., 2010, 99, 1091–1100 CrossRef CAS PubMed.
- C. Bustamante, J. F. Marko, E. D. Siggia and S. Smith, Science, 1994, 265, 1599–1600 CAS.
- J. F. Marko and E. D. Siggia, Macromolecules, 1995, 28, 8759–8770 CrossRef CAS.
- I. Schwaiger, A. Kardinal, M. Schleicher, A. A. Noegel and M. Rief, Nat. Struct. Mol. Biol., 2004, 11, 81–85 CAS.
- S. Furuike, T. Ito and M. Yamazaki, FEBS Lett., 2001, 498, 72–75 CrossRef CAS.
- C. P. Broedersz, C. Storm and F. C. MacKintosh, Phys. Rev. E: Stat., Nonlinear, Soft Matter Phys., 2009, 79, 61914 CrossRef CAS.
- L. Landau and E. Lifshitz, Elasticity theory, Pergamon Press, 1975 Search PubMed.
- A. Wächter and L. T. Biegler, Math. Program., 2005, 106, 25–57 CrossRef.
- A. W. Lees and S. F. Edwards, J. Phys. C: Solid State Phys., 1972, 5, 1921–1928 CrossRef.
- J. Wilhelm and E. Frey, Phys. Rev. Lett., 2003, 91, 108103 CrossRef.
- D. A. Head, A. J. Levine and F. C. MacKintosh, Phys. Rev. Lett., 2003, 91, 2–5 CrossRef.
- P. R. Onck, T. Koeman, T. van Dillen and E. van der Giessen, Phys. Rev. Lett., 2005, 95, 19–22 CrossRef.
- R. Connelly and A. Back, Am. Sci., 1998, 86, 142 CrossRef.
- A. Pugh, An introduction to tensegrity, University of California Pr, 1976 Search PubMed.
- S. Alexander, Phys. Rep., 1998, 296, 65–236 CrossRef CAS.
- C. Heussinger and E. Frey, Eur. Phys. J. E: Soft Matter Biol. Phys., 2007, 1–8 CAS.
- E. M. Huisman, T. van Dillen, P. R. Onck and E. Van der Giessen, Phys. Rev. Lett., 2007, 99, 2–5 CrossRef.
- G. Zagar, P. R. Onck and E. Van der Giessen, Macromolecules, 2011, 44, 7026–7033 CrossRef CAS.
- G. H. Koenderink, Z. Dogic, F. Nakamura, P. M. Bendix, F. C. MacKintosh, J. H. Hartwig, T. P. Stossel and D. A. Weitz, Proc. Natl. Acad. Sci. U. S. A., 2009, 106, 15192–15197 CrossRef CAS PubMed.
Footnotes |
| † More precisely, it is a free energy, which includes both energetic (bending) and entropic terms for the crosslinks (not for the filaments). |
| ‡ We neither take into account fluctuations of the filaments nor excluded-volume effects. |
| § Note that our notion of prestress is not to be confused with the constant prestress externally applied in bulk rheology experiments, which is a shear stress in general. |
| ¶ Although we could in principle define total prestress as the normal component of the stress acting on any plane in our system we prefer to use the shear plane as this simplifies the forthcoming analysis. |
| || Note that individual crosslinks are still under tension; however, the total normal force acting on the shear plane vanishes. |
| This journal is © The Royal Society of Chemistry 2015 |


![[small tau, Greek, macron]](https://www.rsc.org/images/entities/i_char_e0d4.gif)

