 Open Access Article
 This Open Access Article is licensed under a
 Creative Commons Attribution 3.0 Unported Licence
Driving a planar model system into the 3rd dimension: generation and control of curved pore-spanning membrane arrays†
Martin
Gleisner
a,
Ingo
Mey
a,
Mariam
Barbot
b,
Christina
Dreker
b,
Michael
Meinecke
bc and
Claudia
Steinem
*a
aInstitute of Organic and Biomolecular Chemistry, University of Göttingen, Tammannstrasse 2, 37077 Göttingen, Germany. E-mail: csteine@gwdg.de
bDepartment of Cellular Biochemistry, University of Göttingen, Humboldtallee 23, 37073 Göttingen, Germany
cEuropean Neuroscience Institute, 37073 Göttingen, Germany
First published on 27th June 2014
Abstract
The generation of a regular array of micrometre-sized pore-spanning membranes that protrude from the underlying surface as a function of osmotic pressure is reported. Giant unilamellar vesicles are spread onto non-functionalized Si/SiO2 substrates containing a highly ordered array of cavities with pore diameters of 850 nm, an interpore distance of 4 μm and a pore depth of 10 μm. The shape of the resulting pore-spanning membranes is controlled by applying an osmotic pressure difference between the bulk solution and the femtoliter-sized cavity underneath each membrane. By applying Young–Laplace's law assuming moderate lateral membrane tensions, the response of the membranes to the osmotic pressure difference can be theoretically well described. Protruded pore-spanning membranes containing the receptor lipid PIP2 specifically bind the ENTH domain of epsin resulting in an enlargement of the protrusions and disappearance as a result of ENTH-domain induced defects in the membranes. These results are discussed in the context of an ENTH-domain induced reduction of lateral membrane tension and formation of defects as a result of helix insertion of the protein in the bilayer.
Introduction
Arrays of lipid membranes attached to a support have attained great attention over the years, as they provide a high-throughput platform to analyse membrane-confined processes.1–3 In general, three major membrane architectures can be distinguished: (i) solid supported membranes, (ii) freestanding membranes and, (iii) immobilized vesicles. Patterning of solid supported membranes has been pioneered by Boxer et al. using lithographically fabricated corrals.4 Since then, a variety of approaches have been utilised to form planar lipid bilayer arrays by generating barriers to confine the individual membrane patches. Among others,5 examples are mechanical scratching,6,7 prepatterned substrates,8–10 direct UV exposure,11 blotting or stamping,12,13 and microfluidics.14–17 Arrays of freestanding planar lipid bilayers, termed pore-spanning membranes, have been preferentially generated on highly ordered nano- and microporous substrates.3,18–22 These membranes have the advantage over solid supported ones that they separate two aqueous compartments, which allows to optically and electrically address both aqueous phases being a prerequisite for the investigation of protein-mediated transport processes23–26 and the development of (electro)chemical gradients.27In addition to these planar membrane geometries, self-assembled nanocontainers, i.e. unilamellar lipid vesicles, have gathered broad interest as highly curved model membranes and as biochemical reaction vessels with small volumes.28,29 To produce such vesicle arrays, they first need to be immobilized on a solid substrate without rupturing them. Specific immobilization onto a surface is generally achieved by different binding pairs, e.g. biotin/streptavidin, DNA hybridization or histidine/nitrilotriacetic acid. To prevent non-specific interactions between individual vesicles, repulsive forces must be introduced based on charged lipids (electrostatic repulsion) or polyethyleneglycol lipid conjugates (repulsive forces of entropic origin) in the membrane. Using a homogeneous surface functionalization, bound vesicles will be randomly distributed on the surface. An ordered array of single vesicles can be achieved by using high-resolution micro contact printing to define vesicle binding sites with dimensions of the spots similar to the size of the subsequently bound vesicles.30 Such vesicle arrays have been used to investigate protein transmembrane channels like aquaglyceroporin.31 One disadvantage of vesicle arrays arises from the fact that the vesicle size varies, which impacts membrane curvature as well as the inner volume of the compartments. In some applications, this variation can be turned into an advantage if curvature-sensing proteins are analysed.32 However, experiments that rely on a defined membrane curvature and inner volume cannot be performed with high precision using vesicle arrays.
We aimed at a membrane system that provides slightly curved membranes, which are long-term stable, free-standing, well localised on a surface, and entrap a defined aqueous volume. We established planar and curved pore-spanning membranes that suspend a highly ordered array of cavities with pore diameters of 850 nm in a Si/SiO2 substrate, which separate an aqueous, well-defined compartment (Fig. 1). If an osmotic gradient is applied across the planar membranes, the bilayers start protruding leading to curved membranes with a defined femtoliter-sized compartment underneath as depicted in Fig. 1.
 | ||
| Fig. 1 Scheme of pore-spanning membranes sealing femtoliter-sized compartments of a porous substrate. Osmotic pressure differences lead to bulging of the pore-spanning membranes from the surface forming regularly shaped protrusions. The size of the protruded pore-spanning membranes can be controlled by the applied osmotic gradient. | ||
By using different osmotic gradients, the heights of the protruded membranes can be controlled. The produced membrane structures are long-term stable and are well suited to be studied by means of fluorescence microscopy and scanning ion conductance microscopy. The biological applicability of these membrane structures has been shown by the specific interaction of the ENTH domain of epsin to PIP2-containing membranes and the results are discussed in terms of a modulation of the bilayer's lateral tension.
Results and discussion
Preparation of pore-spanning membranes and protrusions
Pore-spanning membranes were prepared on non-functionalized substrates composed of silicon with a native silicon dioxide layer atop containing highly ordered arrays of cavities with pore diameters of 850 nm, an interpore distance of 4 μm (Fig. S1, ESI†) and a pore depth of 10 μm by spreading of giant unilamellar vesicles (GUVs) composed of 1-palmitoyl-2-oleoyl-sn-glycero-3-phosphocholine (POPC). Fig. 2 shows z-stack fluorescence microscopy images of pore-spanning POPC membranes labelled with 0.5% Texas Red DHPE in isoosmolar buffer (160 mM KCl, 10 mM MOPS, pH 7.4, 308 mOsmol L−1), i.e. the osmolarity inside the cavities matches that of the bulk solution. The top view fluorescence image (x–y-plane, Fig. 2A) shows an array of planar pore-spanning membranes, similar to what has been observed previously on functionalized porous silicon nitride substrates with open pore geometries.18,33 As there is only a native silicon dioxide layer atop the silicon substrate, the Texas Red DHPE fluorescence is partly quenched on the pore rims.34,35 Each membrane separates a cavity volume of 6.5 fL from the bulk solution as specified by the manufacturer. From the confocal z-stack fluorescence image (z-profile, Fig. 2A), it becomes obvious that the membranes are almost planar. The shape of these membranes can be modulated by applying an osmotic pressure difference.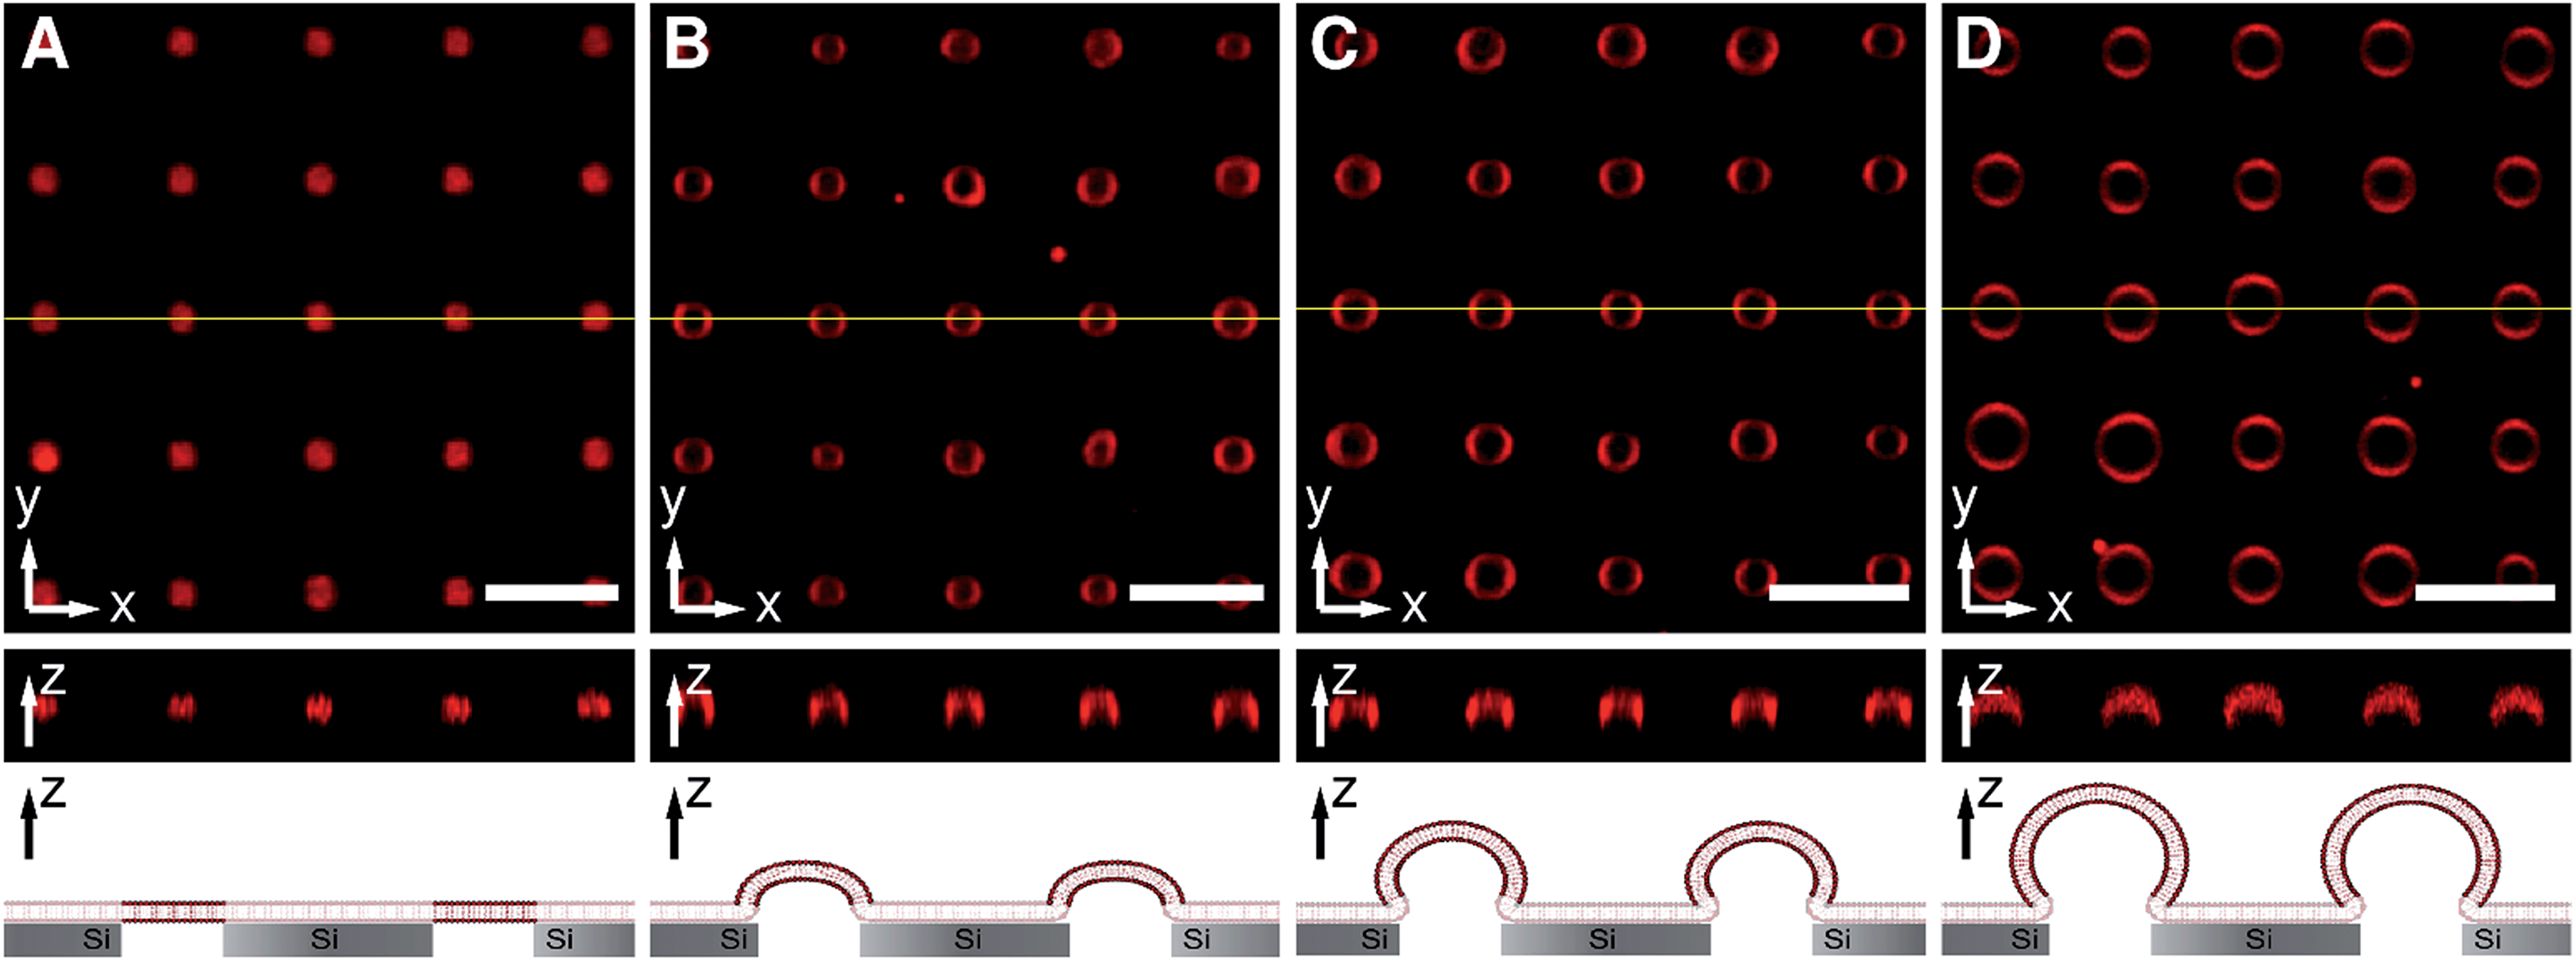 | ||
| Fig. 2 Confocal z-stack fluorescence microscopy images of an array of Texas Red DHPE labelled pore-spanning POPC membranes at different osmolarity gradients. The yellow lines in the top view images (x–y-plane) show the positions of the z-profiles depicted below. The schematic drawings at the bottom illustrates the different stages of membrane protrusions as a function of osmotic pressure difference. The following osmolarity gradients were applied: (A) 0 mOsmol L−1, (B) 9.5 mOsmol L−1, (C) 19 mOsmol L−1, and (D) 29 mOsmol L−1. The osmolarity gradients led to pore-spanning membranes protruding into the bulk solution. The Texas Red DHPE fluorescence on the pore rims is quenched due to the close contact to the silicon substrate. Scale bars: 5 μm, height of z-sections: 5 μm. | ||
Upon replacing the bulk solution by buffer with lower osmolarity resulting in a gradient of 9.5 mOsmol L−1, the membranes start bulging from the substrate as a result of an immediate water influx into the cavities (Fig. 2B). Fluorescence images taken 1–5 min after the osmolarity gradient was applied, show ring-shaped structures in the top view image (x–y-plane), while in the z-profile image a hemispherical structure is observed indicating the protrusion of the membrane. By further increasing the osmolarity gradient to 19 mOsmol L−1 (Fig. 2C) and 29 mOsmol L−1 (Fig. 2D) the pore-spanning membranes protrude even further. From the top view as well as from the z-profile images, it becomes obvious that, at larger osmolarity gradients, the diameter of the protrusions exceeds the diameter of the pore cavity. If the osmolarity gradient is reduced again, the membrane protrusions shrink, indicating that this process is reversible (data not shown).
From the top view images, the radii of the protruded pore-spanning membranes were quantified for the different osmolarity gradients using a threshold-based particle tracking method. The focus was adjusted to the position of maximum expansion of the pore-spanning membranes in the x–y-plane, and the area that is surrounded by the pore-spanning membrane was measured. From the area, the radius was calculated assuming a circle for each individual pore-spanning membrane. The resulting radii were cast into a histogram and a Gaussian function was fit to the radii distribution. Fig. 3 shows the determined radii of the protrusions as a function of the applied osmolarity gradients.
 | ||
| Fig. 3 Radii of membrane protrusions determined from top view fluorescence images as a function of the osmolarity gradient. Y-Error values are the standard deviations of the Gaussian fits. X-Error values show the uncertainty of the osmometric measurements. | ||
If the pore-spanning membranes protrude in the third dimension upon an increasing osmolarity gradient, membrane material has to be recruited from the membrane patch, which is expected to result in shrinkage of the lateral dimensions of the patch. To investigate whether this is indeed the case, we took fluorescence micrographs of an entire membrane patch before and after application of an osmolarity gradient of 29 mOsmol L−1. We chose the largest applied osmolarity gradient of 29 mOsmol L−1 to be able to observe gross changes of the membrane patch (Fig. 4).
The fluorescence micrographs clearly demonstrate that the overall lateral dimension of the membrane patch is reduced. While the border of the membrane patch is still visible (compare left side of the membrane patch in Fig. 4A and B), the membrane is detached from that border if the osmolarity gradient has been applied. Moreover, defects that were already in the membrane patch also grow and small water reservoirs underneath the membrane resulting from the surface roughness bulged from the surface. The visualization of membrane defects in the centre region was limited by the resolution of the fluorescence micrograph.
 | ||
| Fig. 4 Confocal fluorescence microscopy images of a Texas Red DHPE labelled pore-spanning POPC membrane patch A. before and B. after applying an osmolarity gradient of 29 mOsmol L−1. The contours of the membrane patch before (green) and after (blue) applying the osmotic pressure difference are highlighted in the images. Scale bars: 20 μm. | ||
To quantitatively determine the height of the protrusions, fluorescence z-profiles were evaluated (see Fig. 2, centre image of each osmolarity gradient). A Gaussian function was fit to the fluorescence intensity profiles in the centre of each pore-spanning membrane, and at the pore rim to determine the maximum fluorescence intensity, i.e. the position of the membrane. The height of the protrusion was determined as the difference of the two maxima of the Gaussian functions. A Gaussian function was then fit to the resulting height distribution obtained from the individual pore-spanning membranes. The obtained average heights as a function of the osmolarity gradient are plotted in Fig. 5 (black circles).
 | ||
| Fig. 5 Heights of the protrusions of pore-spanning POPC membranes as a function of different osmolarity gradients as obtained by confocal laser scanning fluorescence microscopy (black circles). Heights of the protrusions of pore-spanning DPhPC membranes for different osmolarity gradients as obtained by scanning ion conductance microscopy (green diamonds). Y-Error values are the standard deviations of the Gaussian fits. X-Error bars are the uncertainties of the osmotic gradients during the respective experiment. Blue, red and yellow lines show theoretically calculated heights as a function of osmolarity gradients assuming different lateral membrane tensions. The purple dashed line is the fitting result using eqn (5) and (6) to the fluorescence data resulting in a lateral membrane tension of 2.1 mN m−1. For further details see text. | ||
To independently determine the height of the protrusions, scanning ion conductance microscopy (SICM) images were taken. As the membranes are freestanding, a contact-free scanning probe technique applicable in aqueous solution is required to ensure that the membranes are not deformed upon imaging, which is the case for atomic force microscopy imaging.33,36 To be able to stably image the membranes, 1,2-diphytanoyl-sn-glycero-3-phosphocholine (DPhPC) was used instead of POPC.37Fig. 6 shows the topography of a membrane covered porous surface at an osmolarity gradient of 15 mOsmol L−1. Again, the membranes protrude from the surface with a height of 0.6 ± 0.1 μm (n = 64). The obtained heights for the different osmolarity gradients are plotted in Fig. 5 (green diamonds).
 | ||
| Fig. 6 Scanning ion conductance microscopy image of protruded pore-spanning DPhPC membranes after applying an osmolarity gradient of 15 mOsmol L−1. | ||
Theoretical calculations
To theoretically calculate the extension in z-direction, i.e. the height of the membrane protrusion as a function of the osmotic pressure difference, the Young–Laplace equation can be applied: | (1) |
 | (2) |
The geometry of the membrane protrusion is approximated as a spherical cap. In this case, the Young–Laplace radius is defined as:
 | (3) |
 | (4) |
Eqn (4) can be rearranged to obtain:
 | (5) |
In eqn (5) all parameters are known except for the lateral membrane tension. To evaluate whether the simple model agrees with the measured heights h as a function of various initial osmotic pressure differences, we plotted the heights as a function of the initial osmolarity gradients ΔO assuming an ideal solution with low concentration by using the Morse equation:
 | (6) |
By simulating various lateral membrane tensions (σ = 0.02–5 mN m−1, Fig. 5) it becomes obvious that all data points are within this range. Fitting the combination of eqn (5) and (6) to the data obtained from the fluorescence images results in a mean lateral membrane tension of 2.1 mN m−1. We have shown previously that the membrane tension is primarily governed by the interaction of the membrane with the pore rims.18 A membrane tension of 2 mN m−1 appears reasonable given the fact that pore-spanning solvent-free lipid bilayers on hydrophilic OH-terminated substrates exhibit very similar lateral membrane tensions of =2.0 mN m−1.33 In the setup used here, the membranes are also solvent-free and attached to a hydrophilic OH-terminated silicon dioxide substrate and presumably experience similar interactions with the substrate as those prepared on mercaptoethanol-functionalized gold-covered silicon nitride surfaces.
The experiments clearly demonstrate that the presented system provides flexible free-standing three dimensional lipid bilayers, which are still attached to a planar support. The architecture allows the control of membrane curvature from a non-curved membrane to a slightly curved one with moderate lateral membrane tension. Thus, we asked the question whether such membrane system is suited to investigate proteins that are capable of remodelling flexible membranes such as curvature sensing or curvature inducing proteins.
Interaction of the ENTH domain with pore-spanning membranes
To analyse the applicability of our membrane system, we have chosen the epsin N-terminal homology domain (ENTH domain). The ENTH domain is a structural domain that is found in proteins involved in endocytosis.38,39 It is known that the ENTH domain of epsin-1 binds specifically to the receptor lipid PIP2 (ref. 40–42) resulting in tubulation or even vesiculation.43,44 To visualize the specific binding of the ENTH domain to PIP2-containing pore-spanning membranes and analyse its remodelling properties, the protein was fluorescently labelled with Alexa488 (Fig. 7A) and added to protruded pore-spanning DPhPC membranes doped with 1 mol% PIP2 and labelled with Texas Red DHPE (Fig. 7B). | ||
Fig. 7 Time series (0 min, 16 min, 23 min, 29 min) of confocal fluorescence microscopy top view images of protruded pore-spanning DPhPC–PIP2 (99![[thin space (1/6-em)]](https://www.rsc.org/images/entities/char_2009.gif) :1) membranes labelled with Texas Red DHPE after applying an osmolarity gradient of 19 mOsmol L−1. The fluorescence between the pores is quenched due to the close contact of the fluorophores to the silicon substrate. The Alexa488 labelled ENTH domain was added at t = 1 min (c = 3 μM). (A) Alexa488 fluorescence, (B) Texas Red DHPE fluorescence. Over time, the Alexa488 fluorescence intensity increases and the protrusions grow and partially disappear (compare position marked by an arrow at t = 23 min and t = 29 min). Scale bars: 5 μm. :1) membranes labelled with Texas Red DHPE after applying an osmolarity gradient of 19 mOsmol L−1. The fluorescence between the pores is quenched due to the close contact of the fluorophores to the silicon substrate. The Alexa488 labelled ENTH domain was added at t = 1 min (c = 3 μM). (A) Alexa488 fluorescence, (B) Texas Red DHPE fluorescence. Over time, the Alexa488 fluorescence intensity increases and the protrusions grow and partially disappear (compare position marked by an arrow at t = 23 min and t = 29 min). Scale bars: 5 μm. | ||
Upon ENTH domain addition, an increase in green Alexa488 fluorescence of the ENTH domain (Fig. 7A) was detected, which co-localized with the red Texas Red DHPE fluorescence of the membrane (Fig. S2, ESI†) indicating binding of the protein domain to the membrane. Within the resolution limit of the fluorescence micrographs no inhomogeneous protein binding to specific membrane areas was deduced.
Besides ENTH binding, we also observed morphological changes of the protruded pore-spanning membranes upon incubation with the protein domain (Fig. 7). Of note, the protrusions of the pore-spanning membranes first grew considerably owing to ENTH domain-membrane interaction, in part resulting in the disappearance of individual pore-spanning membranes.
As several tenths of pore-spanning membranes can be observed simultaneously in one fluorescence micrograph, a statistical evaluation of the ENTH domain induced processes on the membrane protrusions can be readily performed over time. We monitored the average change in radius of pore-spanning protruded DPhPC–PIP2 (99:1) membranes as a function of time after the addition of 3 μM ENTH domain (Fig. 8A1, for individual curves see Fig. S3, ESI†). This concentration has been shown to provide the largest vesiculation activity on small unilamellar vesicles.43 Our results clearly demonstrate that a growth of the protrusions only occurs upon a specific binding of the ENTH domain to PIP2. In the absence of PIP2 the radii of the protrusions even slightly decrease, which can be attributed to evaporation of water from the bulk solution resulting in a slight decrease in the osmolarity gradient. We also counted the number of disappearing membranes over time (Fig. 8A2).
 | ||
| Fig. 8 (1) Mean change of relative radius of pore-spanning membranes as a function of time for different lipid compositions with (red) and without (black) PIP2 (A1, B1 and C1). An increase in radii for DPhPC–PIP2 (99:1, r0 = 0.57 μm, n0 = 73, A1) membranes and for POPC–cholesterol–PIP2 (79:20:1, r0 = 0.49 μm, n0 = 45, B1) after protein addition (c = 3 μM, t = 0 min) was observed, while for POPC–PIP2 (99:1, r0 = 0.51 μm, n0 = 38, C1) no change in radii was detected. In absence of PIP2 a decrease in radii after ENTH domain addition for all lipid compositions was measured (DPhPC, r0 = 0.68 μm, n0 = 219, A1; POPC, r0 = 0.49 μm, n0 = 103, B1; POPC–cholesterol 80:20 r0 = 0.64 μm, n0 = 92, C1). Normalized number of pore-spanning membranes (A2, B2 and C2) shows the disappearance of individual pore-spanning membranes due to protein interaction for PIP2 containing lipid compositions, whereas pore-spanning membranes lacking PIP2 showed no response to ENTH domain addition. An osmolarity gradient of 19 mOsmol L−1 was applied in all experiments. | ||
Protruded pore-spanning membranes composed of DPhPC without PIP2 remained intact upon protein addition within the observation time window of about 30–40 min. However, if the ENTH domain was added to PIP2-doped DPhPC membranes, some membranes disappeared.
As we have shown that protruded pore-spanning membranes can also be prepared from POPC, a lipid that is found in natural lipid membranes, we performed the same experiments but replaced DPhPC by POPC. Interestingly, even though these membranes were stable over time either in the absence of the ENTH domain or in the presence of the ENTH domain but without PIP2 in the membrane, they immediately started to disappear upon specific protein binding to PIP2 (Fig. 8B2). This observation explains why a growth of the protrusions in case of ENTH domain binding to POPC–PIP2 (99:1) membranes is barely detected (Fig. 8B1), as the disappearance of the membranes prevails growth. Apparently, growth of the protrusions can only be observed if the membrane stability/integrity is large enough to withstand ENTH domain-induced membrane disappearance. To increase the stability of the POPC–PIP2 (99:1) membranes, we added cholesterol and performed again the experiments on POPC–cholesterol–PIP2 (79:20:1) membranes. It is known that POPC membranes containing 20 mol% cholesterol have a larger rupture tension and an increased area compression modulus.37 Indeed, the radii of the cholesterol containing membranes increase over time (Fig. 8C1), not all membranes disappeared within the observation time frame and they started disappearing at a later time point (Fig. 8C2).
As we only observe a growth as well as a disappearance of the protrusions upon ENTH domain addition to PIP2 containing membranes, we conclude that the protein itself is responsible for the observed morphological changes of the membranes. It has been reported that binding of the ENTH domain to its receptor lipid PIP2 results in a conformational change of the ENTH domain tertiary structure resulting in the insertion of an α-helix (H0) into the upper leaflet of the membrane.45,46 Recent EPR studies further showed that the α-helix inserts with an angle of 11° into the membrane.42 The insertion of the helix is believed to induce an asymmetry between the two monolayers resulting in bending of the membrane.
We have shown that the height of the protruded bilayer array is only governed by the lateral tension of the membrane (Fig. 5). If the initial osmolarity gradient ΔO is constant, the only parameter that can explain a change in the height of the protrusions is the lateral membrane tension. If this were the case, an increase in height upon ENTH domain binding would suggest that the lateral membrane tension decreases upon ENTH domain binding and helix insertion (see Fig. S4, ESI†).
If, however, the insertion of the helix leads to and stabilizes defects in the membrane, the osmolarity gradient would be cancelled and the membrane protrusion would deflate resulting in the observed disappearance of the protrusion from the focal plane. To support this idea, we used spinning disc confocal fluorescence microscopy to observe morphological changes of the membranes in three dimensions on a fast time scale (Movie S1, ESI†). After addition of the ENTH domain both processes, protrusion growing (Fig. 9A) as a result of a reduced lateral membrane tension as well as deflating (Fig. 9B) owing to the formation of ENTH induced membrane defects could be visualized. We did not observe vesiculation of the membrane so that we rule out that the disappearance of the membranes is a result of vesicles released into the bulk solution. We can only speculate about the position of the lipid material after its disappearance as quenching of the fluorophores prevents us from localizing the membrane. However, we suggest that the membrane is attached to the silicon substrate atop or within the cavities.
 | ||
| Fig. 9 Time series of confocal fluorescence z-stacks of (A) a growing and (B) a shrinking pore-spanning membrane (DPhPC–PIP2 99:1, labelled with Texas Red DHPE after applying an osmolarity gradient of 19 mOsmol L−1) depicted as a surface rendered three dimensional image. The position of the substrate is highlighted as a red line. ENTH was added at t = 0 s. Scale bars: 1 μm. | ||
Atomistic simulations have shown that amphipathic helices insert in membrane bilayer defects and that the number of defects increases with increasing positive curvature, whereas on flat or concave structures only few small defects exist.47 This observation would explain why defects are formed in general upon insertion of the ENTH helix and might also explain why a preferential binding of the ENTH domain to positively curved membranes is observed.48 Studies on liposomes further demonstrated that curvature-sensing is mediated by a larger density of binding sites and not by higher affinity.49
Of note, the influence of lateral membrane tension on endo- and exocytosis has been demonstrated in various studies in vivo. It is known that cells use membrane tension to control exo- and endocytotic pathways.50 In K562 cells, endocytosis was completely suppressed under hypoosmotic conditions.51 Studies on 2H3 cells showed a decrease in endocytotic activity and secretion after increasing the lateral tension of the cells by osmotic swelling. Furthermore, a drop in membrane tension was measured when the cells were stimulated to secrete.52 These observations might suggest that the insertion of the ENTH helix into the upper monolayer might indeed decrease the lateral membrane tension to overcome the force required for membrane deformation.
Conclusions
Solvent-free flexible pore-spanning membranes were generated in an array format allowing the formation of planar as well as moderately curved bilayers. The observed height of these membranes can be modelled by applying Young–Laplace's law assuming membranes with moderate and constant lateral membrane tension. Specific PIP2-mediated binding of the ENTH domain to these slightly curved pore-spanning membranes results in the growth of the protrusions, which could be explained by a release of lateral membrane tension upon insertion of the α-helix (H0) of the ENTH domain into the upper monolayer. The eventual disappearance of the protrusions is attributed to ENTH domain-induced membrane defects leading to a release of the osmotic pressure difference and hence a deflating. The presented slightly curved membrane array offers an easy to handle platform to analyse protein binding concomitant with protein-induced membrane modulations on quasi-freestanding bilayers.Experimental section
Preparation of giant unilamellar vesicles
Lipids dissolved in CHCl3 of desired composition were deposited on indium tin oxide (ITO) coated cover slips (V = 50 μL, c = 0.8 mg mL−1). The solvent was removed under reduced pressure for 3 h at ambient temperature and giant unilamellar vesicles (GUVs) were produced by electroformation (AC, U = 3 V, f = 5 Hz, t = 2 h) in 0.3 M sucrose solution (308 mOsmol L−1).Preparation of pore-spanning membranes
Silicon substrates with a native silicon dioxide layer containing highly ordered cavities (pore diameter: 0.85 μm, interpore distance: 4 μm, pore depth: 10 μm, Nanospot GmbH, Münster, Germany) were cleaned using argon plasma (P = 70%, p = 0.4 mbar, t = 2 min, Zepto, Diener electronic GmbH + Co. KG, Ebhausen, Germany). 10 μL of the GUV suspension, diluted by a factor of 42.5 in isoosmolaric KCl buffer (160 mM KCl, 10 mM MOPS, pH 7.4, 308 mOsmol L−1) or phosphate buffered saline (PBS, 1.5 mM KH2PO4, 8.1 mM Na2HPO4, 2.7 mM KCl, 136.9 mM NaCl, pH 7.4), were then added to the substrate. After 10 min, non-spread vesicles were removed by carefully rinsing with buffer used for the dilution.ENTH domain expression and labeling
The ENTH domain of rat epsin1 (residues 1–164) was cloned into pGEX-6P1. The protein was expressed in BL21 cells for 3 h at 37 °C. Cells were lysed using Emulsiflex C3, spun at 140000 × g for 30 min at 4 °C in a Beckman Ti45 rotor, and the supernatant was bound to glutathione beads for 30 min. The beads were washed 6 times with 150 mM NaCl, 20 mM HEPES, pH 7.4, 2 mM DTT, 2 mM EDTA, with two washes at 700 mM NaCl in between. The GST-tag was cleaved using PreScission proteases, and cleaved proteins were further purified by Superdex 200 gel filtration.
Fluorescence labelling of the ENTH domain was performed using an Invitrogen Alexa Fluor® 488 protein labelling kit (Invitrogen Ltd, Paisley, UK) and a G-25 DNA Grade column (GE Healthcare UK Limited, Little Chalfont, UK) for purification. ENTH domain in PBS (c = 1.7 mg mL−1) was added to the pore-spanning membranes at ambient temperature while stirring the solution.
Confocal laser scanning microscopy
Fluorescence images were obtained using an upright confocal laser scanning microscope (Examiner Z.1 equipped with LSM 710, Carl Zeiss AG, Jena, Germany) equipped with a water immersion objective W Plan-Apochromat 63×/1.0 NA VIS-IR (Carl Zeiss AG, Jena, Germany). Texas Red DHPE was excited at λ = 561 nm, Alexa488 at λ = 488 nm. The detection range for Alexa488 was set to 499–557 nm, for Texas Red DHPE 569–699 nm. Image analysis was performed using ImageJ (version 1.45s) and Matlab. For each data point (black circles, Fig. 5) 300–1500 pore-spanning membranes were analysed.Spinning disk confocal fluorescence setup
Fluorescence images were obtained using a spinning disc confocal microscope (stand: Olympus custom made, Olympus Deutschland GmbH, Hamburg, Germany; spinning disc unit: Yokogawa CSU-X, Rota Yokogawa GmbH & Co. KG, Wehr, Germany; camera: iXON 897Ultra, Andor Technology Ltd., Belfast, UK; piezo: P-721-CDQ, Physik Instrumente (PI) GmbH & Co. KG, Karlsruhe/Palmbach, Germany) equipped with a water immersion objective CFI Plan 100XW 100×/1.1 (Nikon GmbH, Düsseldorf, Germany). Texas Red DHPE was excited at λ = 561 nm and a ZET561NF emission filter (AHF analysentechnik AG, Tübingen, Germany) was used. Data were visualised with the program IMARIS (version 7.6.5, Bitplane AG, Zurich, Switzerland). A Gaussian filter (width = 0.133 μm) was used for smoothing. 3D surface rendering was performed using standard parameters of IMARIS.Scanning ion conductance microscopy (SICM)
SICM images were obtained using an ICnano microscope (Ionscope, London, UK) and glass pipettes (boro silica-glass, inner diameter: 0.58 mm, outer diameter: 1.0 mm, Science Products, Hofheim, Germany). To manufacture the pipettes, a brown-flaming electrode puller was used (P-97, Sutter Instruments, Novato, CA, USA). For image recording, a constant potential difference of 200 mV was applied between two Ag/AgCl–electrodes. All measurements were performed in hopping mode. For each data point (green diamonds, Fig. 5), 14–66 pore-spanning membranes were analysed.Acknowledgements
We would like to thank the DFG (SFB 803) for financial support.Notes and references
- M. Bally, K. Bailey, K. Sugihara, D. Grieshaber, J. Vörös and B. Städler, Small, 2010, 6, 2481–2497 CrossRef CAS PubMed.
- X. Han, G. Qi, X. Xu and L. Wang, Lipid Bilayer Membrane Arrays: Fabrication and Applications, Springer, Berlin/Heidelberg, 2012, pp. 1–32 Search PubMed.
- M. Zagnoni, Lab Chip, 2012, 12, 1026–1039 RSC.
- J. T. Groves, N. Ulman and S. G. Boxer, Science, 1997, 275, 651–653 CrossRef CAS.
- Y. Zhang, L. Wang, X. Wang, G. Qi and X. Han, Eur. J. Chem., 2013, 19, 9059–9063 CrossRef CAS PubMed.
- P. S. Cremer, J. T. Groves, L. A. Kung and S. G. Boxer, Langmuir, 1999, 15, 3893–3896 CrossRef CAS.
- J. T. Groves, S. G. Boxer and H. M. McConnell, J. Phys. Chem. B, 2000, 104, 11409–11415 CrossRef CAS.
- X. Han, A. S. Achalkumar, R. J. Bushby and S. D. Evans, Eur. J. Chem., 2009, 15, 6363–6370 CrossRef CAS PubMed.
- A. T. A. Jenkins, N. Boden, R. J. Bushby, S. D. Evans, P. F. Knowles, R. E. Miles, S. D. Ogier, H. Schönherr and G. J. Vancso, J. Am. Chem. Soc., 1999, 121, 5274–5280 CrossRef CAS.
- K. Morigaki, T. Baumgart, A. Offenhäusser and W. Knoll, Angew. Chem., Int. Ed., 2001, 40, 172–174 CrossRef CAS.
- C. K. Yee, M. L. Amweg and A. N. Parikh, J. Am. Chem. Soc., 2004, 126, 13962–13972 CrossRef CAS PubMed.
- J. S. Hovis and S. G. Boxer, Langmuir, 2001, 17, 3400–3405 CrossRef CAS.
- S. Majd and M. Mayer, Angew. Chem., Int. Ed., 2005, 44, 6697–6700 CrossRef CAS PubMed.
- D. Dutta, A. Pulsipher and M. N. Yousaf, Langmuir, 2010, 26, 9835–9841 CrossRef CAS PubMed.
- S. Faiss, S. Schuy, D. Weiskopf, C. Steinem and A. Janshoff, J. Phys. Chem. B, 2007, 111, 13979–13986 CrossRef CAS PubMed.
- S. Künneke and A. Janshoff, Angew. Chem., Int. Ed., 2002, 41, 314–316 CrossRef.
- J. D. Taylor, K. S. Phillips and Q. Cheng, Lab Chip, 2007, 7, 927–930 RSC.
- I. Mey, C. Steinem and A. Janshoff, J. Mater. Chem., 2012, 22, 19348–19356 RSC.
- E. Reimhult and K. Kumar, Trends Biotechnol., 2008, 26, 82–89 CrossRef CAS PubMed.
- H. Suzuki and S. Takeuchi, Anal. Bioanal. Chem., 2008, 391, 2695–2702 CrossRef CAS PubMed.
- M. E. Warkiani, A. A. S. Bhagat, B. L. Khoo, J. Han, C. T. Lim, H. Q. Gong and A. G. Fane, ACS Nano, 2013, 7, 1882–1904 CrossRef CAS PubMed.
- B. Zhu, J. Li and D. Xu, Phys. Chem. Chem. Phys., 2011, 13, 10584–10592 RSC.
- S. Demarche, K. Sugihara, T. Zambelli, L. Tiefenauer and J. Vöös, Analyst, 2011, 136, 1077–1089 RSC.
- A. Janshoff and C. Steinem, Anal. Bioanal. Chem., 2006, 385, 433–451 CrossRef CAS PubMed.
- R. Peters, Annu. Rev. Biophys. Biomol. Struct., 2003, 32, 47–67 CrossRef CAS PubMed.
- M. Urban, A. Kleefen, N. Mukherjee, P. Seelheim, B. Windschiegl, M. Vor der Brüggen, A. Koçer and R. Tampé, Nano Lett., 2014, 14, 1674–1680 CrossRef CAS PubMed.
- D. Frese, S. Steltenkamp, S. Schmitz and C. Steinem, RSC Adv., 2013, 3, 15752–15761 RSC.
- V. K. Bhatia, N. S. Hatzakis and D. Stamou, Semin. Cell Dev. Biol., 2010, 21, 381–390 CrossRef CAS PubMed.
- S. M. Christensen and D. G. Stamou, Sensors, 2010, 10, 11352–11368 CrossRef CAS PubMed.
- D. Stamou, C. Duschl, E. Delamarche and H. Vogel, Angew. Chem., Int. Ed., 2003, 42, 5580–5583 CrossRef CAS PubMed.
- M. Brändén, S. R. Tabaei, G. Fischer, R. Neutze and F. Höök, Biophys. J., 2010, 99, 124–133 CrossRef PubMed.
- V. K. Bhatia, K. L. Madsen, P.-Y. Bolinger, A. Kunding, P. Hedeg, U. Gether and D. Stamou, EMBO J., 2009, 28, 3303–3314 CrossRef CAS PubMed.
- M. Kocun, T. D. Lazzara, C. Steinem and A. Janshoff, Langmuir, 2011, 27, 7672–7680 CrossRef CAS PubMed.
- T. Engel, Surf. Sci. Rep., 1993, 18, 93–144 CrossRef.
- L. Gu, M. Orosco and M. J. Sailor, Phys. Status Solidi A, 2009, 206, 1374–1376 CrossRef CAS.
- J. Rheinlaender, N. A. Geisse, R. Proksch and T. E. Schäffer, Langmuir, 2011, 27, 697–704 CrossRef CAS PubMed.
- D. Needham and R. S. Nunn, Biophys. J., 1990, 58, 997–1009 CrossRef CAS.
- V. Legendre-Guillemin, S. Wasiak, N. K. Hussain, A. Angers and P. S. McPherson, J. Cell Sci., 2004, 117, 9–18 CrossRef CAS PubMed.
- R. Lundmark and S. R. Carlsson, Semin. Cell Dev. Biol., 2010, 21, 363–370 CrossRef CAS PubMed.
- S. Rozovsky, M. B. Forstner, H. Sondermann and J. T. Groves, J. Phys. Chem. B, 2012, 116, 5122–5131 CrossRef CAS PubMed.
- R. V. Stahelin, F. Long, B. J. Peter, D. Murray, P. De Camilli, H. T. McMahon and W. Cho, J. Biol. Chem., 2003, 278, 28993–28999 CrossRef CAS PubMed.
- Y. Yoon, J. Tong, P. J. Lee, A. Albanese, N. Bhardwaj, M. Källberg, M. A. Digman, H. Lu, E. Gratton, Y.-K. Shin and W. Cho, J. Biol. Chem., 2010, 285, 531–540 CrossRef CAS PubMed.
- E. Boucrot, A. Pick, G. Camdere, N. Liska, E. Evergren, H. T. McMahon and M. M. Kozlov, Cell, 2012, 149, 124–136 CrossRef CAS PubMed.
- E. J. Ungewickell and L. Hinrichsen, Curr. Opin. Cell Biol., 2007, 19, 417–425 CrossRef CAS PubMed.
- C. A. J. Horvath, D. Vanden Broeck, G. A. V. Boulet, J. Bogers and M. J. S. De Wolf, Int. J. Biochem. Cell Biol., 2007, 39, 1765–1770 CrossRef CAS PubMed.
- D.-H. Kweon, Y.-K. Shin, J. Y. Shin, J.-H. Lee, J.-B. Lee, J.-H. Seo and Y. S. Kim, Mol. Cells, 2006, 21, 428–435 CAS.
- H. Cui, E. Lyman and G. A. Voth, Biophys. J., 2011, 100, 1271–1279 CrossRef CAS PubMed.
- T. Baumgart, B. R. Capraro, C. Zhu and S. L. Das, Annu. Rev. Phys. Chem., 2011, 62, 483–506 CrossRef CAS PubMed.
- N. S. Hatzakis, V. K. Bhatia, J. Larsen, K. L. Madsen, P.-Y. Bolinger, A. H. Kunding, J. Castillo, U. Gether, P. Hedegård and D. Stamou, Nat. Chem. Biol., 2009, 5, 835–841 CrossRef CAS PubMed.
- G. J. Doherty and H. T. McMahon, Annu. Rev. Biophys., 2008, 37, 65–95 CrossRef CAS PubMed.
- C. Rauch and E. Farge, Biophys. J., 2000, 78, 3036–3047 CrossRef CAS.
- J. Dai, H. P. Ting-Beall and M. P. Sheetz, J. Gen. Physiol., 1997, 110, 1–10 CrossRef CAS.
Footnote |
| † Electronic supplementary information (ESI) available: Scanning electron microscopy image of porous substrate, confocal fluorescence images of the co-localization of Alexa488-labelled ENTH domain and Texas Red DHPE; individual time series for protrusion growth; calculated dependency of the height of the protrusions as a function of lateral membrane tension; movie of the growing and shrinking of the protrusions as a function of ENTH domain addition. See DOI: 10.1039/c4sm00702f |
| This journal is © The Royal Society of Chemistry 2014 |