 Open Access Article
Combining luminescence spectroscopy, parallel factor analysis and quantum chemistry to reveal metal speciation – a case study of uranyl(VI) hydrolysis†
Björn
Drobot
*a,
Robin
Steudtner
a,
Johannes
Raff
ab,
Gerhard
Geipel
a,
Vinzenz
Brendler
a and
Satoru
Tsushima
 *a
*a
aHelmholtz Zentrum Dresden Rossendorf, Institute of Resource Ecology, Bautzner Landstraße 400, 01328 Dresden, Germany. E-mail: b.drobot@hzdr.de; s.tsushima@hzdr.de
bHelmholtz Zentrum Dresden Rossendorf, Helmholtz Institute Freiberg for Resource Technology, Halsbrücker Straße 34, 09599 Freiberg, Germany
First published on 28th October 2014
Abstract
This study of aqueous metal speciation is an advanced combination of theoretical and experimental methods. Continuous wave (CW) and time-resolved laser-induced fluorescence spectroscopy (TRLFS) data of uranyl(VI) hydrolysis were analyzed using parallel factor analysis (PARAFAC). Distribution patterns of five major species were thereby derived under a fixed uranyl concentration (10−5 M) over a wide pH range from 2 to 11. UV (180 nm to 370 nm) excitation spectra were extracted for individual species. Time-dependent density functional theory (TD-DFT) calculations revealed ligand excitation (water, hydroxo, oxo) in this region and ligand-to-metal charge transfer (LMCT) responsible for luminescence. Thus excitation in the UV region is extreme ligand sensitive and specific. Combining findings from PARAFAC and DFT the [UO2(H2O)5]2+ cation (aquo complex 1![[thin space (1/6-em)]](https://www.rsc.org/images/entities/char_2009.gif) :
:![[thin space (1/6-em)]](https://www.rsc.org/images/entities/char_2009.gif) 0) and four hydroxo complexes (1
0) and four hydroxo complexes (1![[thin space (1/6-em)]](https://www.rsc.org/images/entities/char_2009.gif) :
:![[thin space (1/6-em)]](https://www.rsc.org/images/entities/char_2009.gif) 1, 3
1, 3![[thin space (1/6-em)]](https://www.rsc.org/images/entities/char_2009.gif) :
:![[thin space (1/6-em)]](https://www.rsc.org/images/entities/char_2009.gif) 5, 3
5, 3![[thin space (1/6-em)]](https://www.rsc.org/images/entities/char_2009.gif) :
:![[thin space (1/6-em)]](https://www.rsc.org/images/entities/char_2009.gif) 7 and 1
7 and 1![[thin space (1/6-em)]](https://www.rsc.org/images/entities/char_2009.gif) :
:![[thin space (1/6-em)]](https://www.rsc.org/images/entities/char_2009.gif) 3) were identified. The methodological concept used here is applicable to luminescent metals in general and thus enables acquisition of refined structural and thermodynamical data of lanthanide and actinide complexation.
3) were identified. The methodological concept used here is applicable to luminescent metals in general and thus enables acquisition of refined structural and thermodynamical data of lanthanide and actinide complexation.
Introduction
The environmental impact of metals depends on their concentration and more importantly their speciation. A broad variety of methods can be applied to determine speciation, e.g. separation by ion exchange,1 solvent extraction methods,2,3 as well as diffusive gradients in thin films.4 Enthalpic data (ΔrS, ΔrH and ΔrCp) is often derived from either potentiometric5 or calorimetric6 titrations. However, it is far from trivial to derive a unique set of chemical species with correct stoichiometries and structure from such experiments. Most often a couple of sensible species sets are tested against the experimental results. Then the model yielding the smallest overall deviation between fitted and real values (χ2 minimization) is considered to be the best. In contrast, techniques such as ESI-TOF provide direct stoichiometric information but no thermodynamic data.7,8 Whereas both thermodynamic and structural parameters can be obtained from luminescence spectroscopy, a correlation of spectral shape and structure is usually not possible. Increased computational power makes quantum chemical calculations a helpful complementary method. Spectral features thus obtained can be correlated to structural information. This work intends to exploit current capabilities of state-of-the-art combinations of spectroscopy, quantum chemistry, and data processing.Uranyl(VI) hydrolysis is selected as an ideal system for a proof of concept. It is the elementary uranium aqueous ligand system and constitutes the basis for all more complex natural systems. The formation of oligomeric complexes makes uranyl(VI) hydrolysis one of the most diverse systems in aqueous heavy metal chemistry. Although uranyl(VI) speciation has been studied for decades a clear determination and complete understanding is still missing. The current general conception is represented by the updated thermochemical database (TDB) of the Nuclear Energy Agency (NEA).9 Recent studies prove there are still some open questions especially about polynuclear species.6,10
The major part of thermodynamic uranyl(VI) data is based on potentiometric or calorimetric titrations.11–13 For the acidic as well as for the alkaline pH range complementary spectroscopic methods like IR,14 EXAFS,15,16 Raman17 and NMR18 are applicable. For all of them relatively high concentrations up to several millimolar are required. This limits the use of these methods because of low uranyl(VI) solubility in the circumneutral pH range. Luminescence spectroscopic methods with their high sensitivity offer a solution for this problem. The detection limit depends on the experimental setup and quantum yield of the complexes and can reach the nanomolar level. Since luminescence spectra lack direct structural information their assignment to complexes is mainly based on comparison with a thermodynamic database.
Discrimination of several components in a single fluorescence signal is a challenging problem. In previous works, time as an additional dimension was used for uranyl(VI) spectra deconvolution.19–22 But due to the lack of unique analysis methods and different experimental setups results of deconvolution are often not consistent. Site selective excitation is another method to discriminate between luminescence spectra of individual species. It was successfully applied to Cm(III) and Eu(III) cryo spectroscopy.23,24 However, inhomogeneous broadening leads to a smearing of excitation spectra at room temperature and interpretation becomes difficult.
In this study an advanced combination of luminescence spectroscopic and theoretical methods is proposed and evaluated to get new insights into uranyl(VI) hydrolysis. Time-resolved laser-induced fluorescence spectroscopy (TRLFS) and continuous wave (CW) spectroscopic data are recorded for a wide pH range. Parallel factor analysis (PARAFAC),25,26 a generalization of two-dimensional principal component analysis (PCA) to higher orders, was used to extract detailed and consistent speciation information from spectroscopic data. Electronic absorption spectra were calculated using time-dependent density functional theory (TD-DFT). Comparison of theory and experiment provided spectra-to-complex correlation and also identification of the excitation origin in the UV region.
Theory
Parallel factor analysis (PARAFAC)
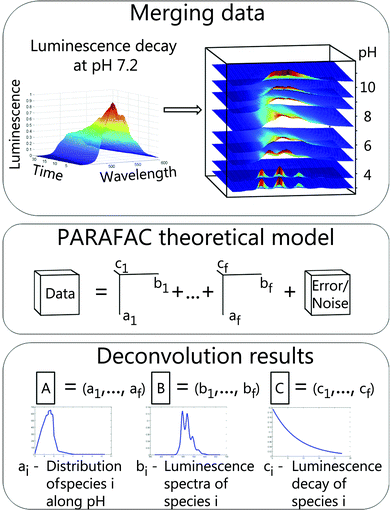
This method was developed as a robust analysis for a direct determination of unique explanatory factors. In this study explanatory factors correspond to chemical species. Anderson and Bro have shown that simultaneous analysis of multi-way data with three or more independent variables measured in a crossed fashion overcomes the rotation problem and a unique solution of such a model could be found.27 It was demonstrated that PARAFAC is a useful tool for selective excitation luminescence spectroscopy28,29 as well as for TRLFS data.30In the following section PARAFAC is illustrated using the example of TRLFS. Raw data were baseline corrected and normalized to a luminescence maximum of one before analysis to ensure equal weighting. Afterwards 2D data (emission wavelength versus time) from measurements at different pH values were stacked to a 3D data cube (Fig. 1, top). This data cube is a linear combination of individual cubes for respective chemical species (1 to f) and additional noise (Fig. 1, middle, adapted from Bro et al.31). Deconvolution with PARAFAC results in three matrices (A–C). The number of matrix columns equals the number of chemical species and the i-th column of each matrix represents the i-th species (Fig. 1, bottom). Therefore the fraction of the i-th chemical species within the data is explained by the vectors ai, bi and ci. Each of the matrices contains intrinsic characteristics of chemical species along particular parameters (here pH, emission wavelength, and time) providing direct access to species distribution, luminescence spectra and luminescence decays.
PARAFAC has already been implemented as the N-way Toolbox27 for the MATLAB software. Toolbox details can be found in literature31–33 and an excellent online tutorial is accessible.34 In this study PARAFAC was used for modelling uranyl(VI) hydrolysis data from TRLFS and CW spectroscopy and thus, chemical species correlate with uranyl(VI) complexes.
Unimodal (one maximum for speciation) and nonnegative (for luminescence spectra) constraints were used for the model as already implemented in the N-way Toolbox 3.31.27 Based on the Optimization Toolbox a monoexponential constraint for the fluorescence decay was additionally implemented. Spectra and lifetimes were normalized directly by the PARAFAC algorithm. All Toolboxes were used with Matlab R2013a.
Quantum-chemical calculations
Calculations were performed in an aqueous phase using the Gaussian 09 program35 employing the density functional theory (DFT) by using a conductor like polarizable continuum model.36,37 Structure optimizations were performed for [UO2(H2O)5]2+ (aquo, 1![[thin space (1/6-em)]](https://www.rsc.org/images/entities/char_2009.gif) :
:![[thin space (1/6-em)]](https://www.rsc.org/images/entities/char_2009.gif) 0), [UO2(OH)(H2O)4]+ (1
0), [UO2(OH)(H2O)4]+ (1![[thin space (1/6-em)]](https://www.rsc.org/images/entities/char_2009.gif) :
:![[thin space (1/6-em)]](https://www.rsc.org/images/entities/char_2009.gif) 1), [(UO2)2(μ2-OH)2(H2O)6]2+ (2
1), [(UO2)2(μ2-OH)2(H2O)6]2+ (2![[thin space (1/6-em)]](https://www.rsc.org/images/entities/char_2009.gif) :
:![[thin space (1/6-em)]](https://www.rsc.org/images/entities/char_2009.gif) 2), and [(UO2)3(μ3-O)(μ2-OH)3(H2O)6]+ (3
2), and [(UO2)3(μ3-O)(μ2-OH)3(H2O)6]+ (3![[thin space (1/6-em)]](https://www.rsc.org/images/entities/char_2009.gif) :
:![[thin space (1/6-em)]](https://www.rsc.org/images/entities/char_2009.gif) 5) at B3LYP level38,39 followed by vibrational frequency analysis at the same level to confirm the absence of imaginary frequencies. For the calculations of the electronic absorption spectra, nonequilibrium time-dependent DFT (TD-DFT) calculations40,41 were applied in the aqueous phase producing only singlet excited states. One hundred (aquo and 1
5) at B3LYP level38,39 followed by vibrational frequency analysis at the same level to confirm the absence of imaginary frequencies. For the calculations of the electronic absorption spectra, nonequilibrium time-dependent DFT (TD-DFT) calculations40,41 were applied in the aqueous phase producing only singlet excited states. One hundred (aquo and 1![[thin space (1/6-em)]](https://www.rsc.org/images/entities/char_2009.gif) :
:![[thin space (1/6-em)]](https://www.rsc.org/images/entities/char_2009.gif) 1) and two hundred (2
1) and two hundred (2![[thin space (1/6-em)]](https://www.rsc.org/images/entities/char_2009.gif) :
:![[thin space (1/6-em)]](https://www.rsc.org/images/entities/char_2009.gif) 2 and 3
2 and 3![[thin space (1/6-em)]](https://www.rsc.org/images/entities/char_2009.gif) :
:![[thin space (1/6-em)]](https://www.rsc.org/images/entities/char_2009.gif) 5) singlet excited states were determined using the ground states geometries of each uranyl(VI) complex. For the absorption spectra, the half-width at half-height was defined as 0.2 eV. The energy-consistent small-core effective core potential and the corresponding basis set suggested by Küchle et al.42 were used for uranium. The most diffuse basis functions on uranium with the exponent 0.005 (all s, p, d, and f type functions) were omitted as in previous studies.43,44 For oxygen and hydrogen, the valence triple-ζ plus polarization basis was used.45 The spin–orbit effects and basis set superposition error corrections were neglected. Coordinates of all complexes are given in the ESI.†
5) singlet excited states were determined using the ground states geometries of each uranyl(VI) complex. For the absorption spectra, the half-width at half-height was defined as 0.2 eV. The energy-consistent small-core effective core potential and the corresponding basis set suggested by Küchle et al.42 were used for uranium. The most diffuse basis functions on uranium with the exponent 0.005 (all s, p, d, and f type functions) were omitted as in previous studies.43,44 For oxygen and hydrogen, the valence triple-ζ plus polarization basis was used.45 The spin–orbit effects and basis set superposition error corrections were neglected. Coordinates of all complexes are given in the ESI.†
Material and experimental
Material
Sample preparation was carried out in an inert gas glove box (nitrogen) to avoid carbonate complexation. Uranyl(VI) solutions (10−5 M U(VI) in 10−2 M NaClO4 (Merck), unless stated otherwise) were prepared directly before the experiment. Same solutions without uranyl(VI) were used as blank. No precipitation was visually observed during the measurements. Pure water was degassed with nitrogen and stored in a glove box. Uranyl(VI) stock solution (10−1 M in 0.1 M HClO4) was prepared from solid UO2(NO3)2·6H2O (Chemapol) as previously described.46 NaClO4 solution was prepared before each experimental series. The sample pH ranged from 2 to 11 and was adjusted by adding suitable amounts of NaOH and HClO4 (Merck). The pH was measured directly after the luminescence measurements, to avoid quenching by chloride from the electrode. The pH measurements were carried out with a glass electrode (SenTix Mic, WTW), which was calibrated with 3 buffer solutions (NIST/PTB standard buffers).Time-resolved laser-induced fluorescence spectroscopy (TRLFS)
A quadrupled (266 nm) Nd:YAG laser (minilite, Continuum) with 0.3 mJ per 4 ns pulse was used for excitation of the sample in a quartz glass cuvette. A light guide was used for transmission of emitted light to the spectrometer (Horiba, slit width 200 μm). A 100 lines per mm grate produced monochromatic light (resolution circa 0.5 nm) that was detected by a cooled (−20 °C) ICCD camera (Horiba). The initial delay was set to 0.1 μs and an aperture of 4 μs was used. An average of 75 accumulations was collected and the baseline correction was performed with the software LabSpec 5 (Horiba). A 150 ns step size for 148 spectra (setup 25 °C) and a 70 ns step size for 101 spectra (setup 1 °C) were used, respectively. Sample temperature was fixed with a controlled Peltier element (TC125 Temperature Control, Quantum Northwest).Continuous wave (CW) spectroscopy
Photoluminescence measurements were performed on a fluorescence spectrofluorometer (QuantaMaster 40) equipped with a 75 W xenon arc lamp. Wavelengths were chosen by motorized excitation and emission monochromators with a bandwidth of 10 nm and 2 nm, respectively. Spectra were recorded by scanning emission with 1 nm resolution at each excitation wavelength. This procedure was iterated for the entire excitation range with 5 nm resolution. An integration time of 1 s was chosen. Sample temperature was fixed with a controlled Peltier element (identical to the previous). Data from CW spectroscopy were baseline corrected with the recorded blanks.Results and discussion
Three independent series of luminescence spectroscopic experiments were performed. TRLFS experiments were run at 25 °C, making them comparable to literature (see Table 1). For two additional series (TRLFS and CW spectroscopy) a temperature of 1 °C was chosen where the quantum yield of the uranyl(VI) aquo ion is 3.8 times higher compared to 20 °C (see Fig. 2).| Complex | Peak positions (nm) | Lifetime (μs) 25 °C | Lifetime (μs) 1 °C | Excitation maximum (nm) | Reference | ||||||
|---|---|---|---|---|---|---|---|---|---|---|---|
| UO22+ | 472 | 486 | 508 | 532 | 559 | 588 | 270 | CW spectroscopy | |||
| 472 | 486 | 509 | 533 | 560 | 590 | 4.5 | TRLFS 1 °C | ||||
| 471 | 486 | 508 | 532 | 559 | 589 | 0.8 | TRLFS 25 °C | ||||
| 470 | 488 | 509 | 533 | 559 | 588 | 2 | 19 | ||||
| 2.2 | 51 | ||||||||||
| 470 | 488 | 510 | 533 | 2.3 | 53 | ||||||
| 470 | 488 | 510 | 534 | 560 | 588 | 7.9 | 60 | ||||
| 489 | 510 | 535 | 560 | 1.7 | 62 | ||||||
| 488 | 509 | 534 | 560 | 0.9 | 63 | ||||||
| 478 | 488 | 510 | 533 | 1.55 | 64 | ||||||
| 473 | 488 | 510 | 534 | 560 | 587 | 1.9 | 65 | ||||
| UO2OH+ | 481 | 495 | 517 | 541 | 567 | 596 | 285 | CW spectroscopy | |||
| 480 | 495 | 517 | 541 | 567 | 595 | 42.8 | TRLFS 1 °C | ||||
| 480 | 496 | 517 | 541 | 567 | 595 | 7.9 | TRLFS 25 °C | ||||
| 480 | 497 | 519 | 544 | 570 | 598 | 80 | 50 | ||||
| 39.3 | 51 | ||||||||||
| 33.8 | 52 | ||||||||||
| 496 | 518 | 542 | 566 | 32.8 | 62 | ||||||
| 494 | 515 | 538 | 564 | 10.5 | 64 | ||||||
| 8.3 | 66 | ||||||||||
| (UO2)3(OH)5+ | 496 | 511 | 533 | 556 | 582 | 300 | CW spectroscopy | ||||
| 496 | 511 | 533 | 557 | 584 | 183 | TRLFS 1 °C | |||||
| 495 | 511 | 533 | 558 | 585 | 21.6 | TRLFS 25 °C | |||||
| 479 | 496 | 514 | 535 | 556 | 584 | 613 | 23 | 19 | |||
| 25.3 | 51 | ||||||||||
| 479 | 498 | 514 | 533 | 33.3 | 53 | ||||||
| 479 | 496 | 515 | 536 | 556 | 584 | 613 | 6.6 | 62 | |||
| 479 | 500 | 516 | 533 | 554 | 584 | 613 | 7 | 64 | |||
| (UO2)3(OH)7− | 489 | 505 | 525 | 548 | 572 | 325 | CW spectroscopy | ||||
| 488 | 507 | 528 | 551 | 575 | 603 | 17.5 | TRLFS 1 °C | ||||
| 488 | 504 | 525 | 548 | 574 | 601 | 7.6 | TRLFS 25 °C | ||||
| 487 | 508 | 528 | 549 | 577 | 606 | 230 | 19 | ||||
| 487 | 503 | 523 | 547 | 574 | 606 | 10 | 62 | ||||
| UO2(OH)3− | 498 | 518 | 539 | 562 | 587 | 270 | CW spectroscopy | ||||
| 482 | 499 | 519 | 540 | 563 | 4.2 | TRLFS 1 °C | |||||
| 482 | 501 | 522 | 544 | 569 | 1.4 | TRLFS 25 °C | |||||
| 482 | 499 | 519 | 543 | 567 | 594 | 0.8 | 19 | ||||
| 482 | 506 | 524 | 555 | 568 | 594 | 0.4 | 62 | ||||
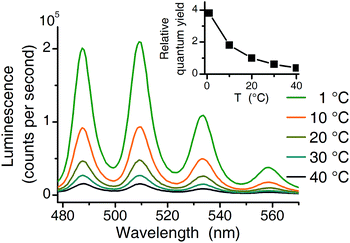 | ||
| Fig. 2 Temperature effect (1 °C to 40 °C) on luminescence intensity (10−4 M U(VI), 10−2 M NaClO4, pH 2.5 excitation at 270 nm). Inset shows the relative quantum yield normalized to 20 °C value. | ||
Results from all three experimental series are compared with the thermodynamic speciation. Speciation calculation for 25 °C was performed with the EQ3/6 package47 using the most updated thermodynamic data from NEA TDB.9
Data matrices for distinct pH values were collected individually for each experimental setup. Deconvolution according to Fig. 1 (section Experimental) results in the output of three matrices (A–C) for each experimental series. Five complexes were found to consistently explain the models. Explained variance (>99%) as well as the core consistency diagnostics (>60%)32 support the five complexes model.
The columns of matrices A correlate with the luminescence distribution along the pH scale (Fig. 3). Since PARAFAC yields only the distribution of complexes but no information on stoichiometry and structures, we assigned the complexes in a way that it reproduces best the computed thermodynamic speciation. At pH around 5 to 6 both UO2OH+ (1![[thin space (1/6-em)]](https://www.rsc.org/images/entities/char_2009.gif) :
:![[thin space (1/6-em)]](https://www.rsc.org/images/entities/char_2009.gif) 1) and (UO2)2(OH)22+ (2
1) and (UO2)2(OH)22+ (2![[thin space (1/6-em)]](https://www.rsc.org/images/entities/char_2009.gif) :
:![[thin space (1/6-em)]](https://www.rsc.org/images/entities/char_2009.gif) 2) may prevail, according to the speciation calculation. However, only one complex was found and tentatively assigned to 1
2) may prevail, according to the speciation calculation. However, only one complex was found and tentatively assigned to 1![[thin space (1/6-em)]](https://www.rsc.org/images/entities/char_2009.gif) :
:![[thin space (1/6-em)]](https://www.rsc.org/images/entities/char_2009.gif) 1 (see below for a more detailed discussion).
1 (see below for a more detailed discussion).
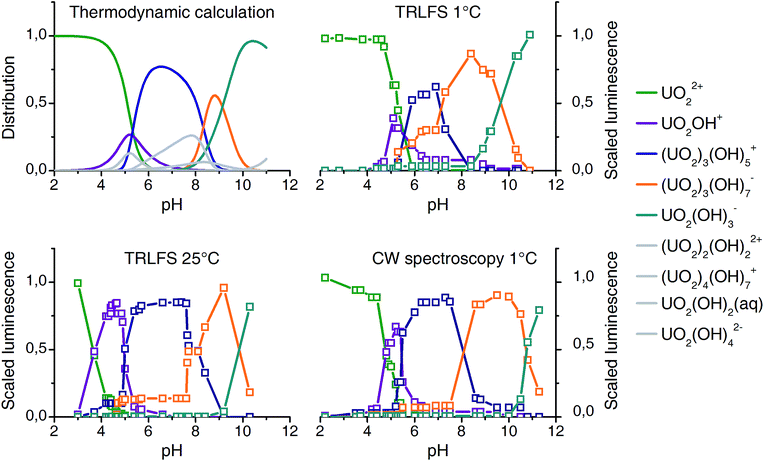 | ||
| Fig. 3 Comparison of thermodynamic speciation (top left, 25 °C) with experimental distribution based on luminescence spectroscopy and PARAFAC deconvolution (10−5 M U(VI), 10−2 M NaClO4). | ||
The matrices B contain emission spectra of detected complexes. Spectra of different experiments (CW spectroscopy and TRLFS) were compared among themselves (Fig. 4) and found to be in good agreement. Each spectrum belongs to one complex in the pH distribution curves in Fig. 3. Thus the pH distributions combined with the shape of corresponding spectra clearly demonstrate the identity of extracted complexes within our three experiments.
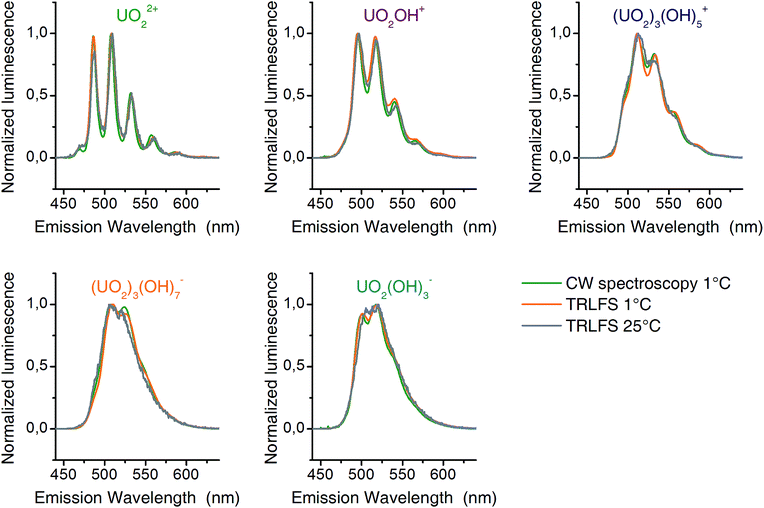 | ||
| Fig. 4 Luminescence spectra (normalized to maximum amplitude) of detected uranyl(VI) complexes from CW-spectroscopy (1 °C – green) and TRLFS (1 °C – orange; 25 °C – gray). | ||
The distribution patterns thus derived are very similar to those obtained from speciation modeling. Some minor complexes (colored gray in Fig. 3) could not be reproduced. Significant differences in quantum yields could explain this.48 Nevertheless a detailed and consistent uranyl(VI) speciation over a wide pH range under a fixed uranium concentration is characterized by luminescence spectroscopy for the first time. Peak positions obtained are listed in Table 1, together with literature values.
The third parameter differs for TRLFS (time) and CW spectroscopy (excitation wavelength). Thus columns of matrices C represent the luminescence decay for TRLFS and the excitation spectra for CW spectroscopy. As mentioned before a monoexponential restriction was used for PARAFAC with TRLFS data. Therefore extraction of standard deviation for lifetimes is not possible. Lifetimes for both 1 °C and 25 °C are given in Table 1. As expected the lifetimes increase with decreasing temperatures.12 Extracted lifetimes are often shorter than those described in the literatures. The difference can be attributed to the differences in ionic strength.49 For the complexes 1![[thin space (1/6-em)]](https://www.rsc.org/images/entities/char_2009.gif) :
:![[thin space (1/6-em)]](https://www.rsc.org/images/entities/char_2009.gif) 1 (UO2OH+) and 2
1 (UO2OH+) and 2![[thin space (1/6-em)]](https://www.rsc.org/images/entities/char_2009.gif) :
:![[thin space (1/6-em)]](https://www.rsc.org/images/entities/char_2009.gif) 2 ((UO2)2(OH)22+) reported lifetimes are contradictory. Longer lifetimes for the 1
2 ((UO2)2(OH)22+) reported lifetimes are contradictory. Longer lifetimes for the 1![[thin space (1/6-em)]](https://www.rsc.org/images/entities/char_2009.gif) :
:![[thin space (1/6-em)]](https://www.rsc.org/images/entities/char_2009.gif) 1 complex (80 μs,50 39.4 μs,51 33.8 μs (ref. 52)) compared to those of the 2
1 complex (80 μs,50 39.4 μs,51 33.8 μs (ref. 52)) compared to those of the 2![[thin space (1/6-em)]](https://www.rsc.org/images/entities/char_2009.gif) :
:![[thin space (1/6-em)]](https://www.rsc.org/images/entities/char_2009.gif) 2 complex (9 μs,50 13.4 μs,51 11.1 μs (ref. 52)) were listed. Kirishima et al. proposed the opposite, 11.3 μs for the 1
2 complex (9 μs,50 13.4 μs,51 11.1 μs (ref. 52)) were listed. Kirishima et al. proposed the opposite, 11.3 μs for the 1![[thin space (1/6-em)]](https://www.rsc.org/images/entities/char_2009.gif) :
:![[thin space (1/6-em)]](https://www.rsc.org/images/entities/char_2009.gif) 1 complex and 17.8 μs for the 2
1 complex and 17.8 μs for the 2![[thin space (1/6-em)]](https://www.rsc.org/images/entities/char_2009.gif) :
:![[thin space (1/6-em)]](https://www.rsc.org/images/entities/char_2009.gif) 2 complex.53 Because of the proposed similar shape of spectra (Moulin et al. and references therein19) this problem could not be solved here.
2 complex.53 Because of the proposed similar shape of spectra (Moulin et al. and references therein19) this problem could not be solved here.
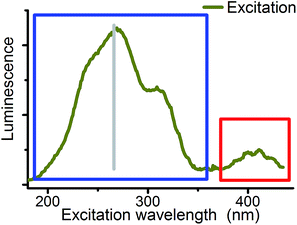
Excitation wavelength was used as the third parameter for the deconvolution of CW spectroscopic data. Site selective excitation of uranyl(VI) was previously rudimentarily performed in the fingerprint region54,55 shown in Fig. 5 (red sector). Theoretical studies were focused on the same region.56,57
Although differences in UV absorption below 370 nm were observed for several uranyl complexes, the common assumption is that this absorption is structureless and not specific.58 Therefore systematic studies on site selectivity of uranyl excitation are missing. Wang et al. have shown that the luminescence intensity of solid state uranyl compounds depends on excitation wavelength59 and Moulin et al. mentioned in 1998 that studies in this direction are in progress.19 The present study is focused on the wavelength range from 180 to 370 nm (blue sector in Fig. 5) to start systematic investigations on this field.
Differences in excitation spectra can easily be demonstrated with the sample from pH 5. At this pH mainly the uranyl(VI) aquo ion and the 1![[thin space (1/6-em)]](https://www.rsc.org/images/entities/char_2009.gif) :
:![[thin space (1/6-em)]](https://www.rsc.org/images/entities/char_2009.gif) 1 complex (see pH distribution from CW spectroscopy in Fig. 3) should be present. Selected normalized luminescence spectra from raw data at this pH are shown in Fig. 6 (right side). These spectra are a superposition of pure spectra of the uranyl(VI) aquo ion and the 1
1 complex (see pH distribution from CW spectroscopy in Fig. 3) should be present. Selected normalized luminescence spectra from raw data at this pH are shown in Fig. 6 (right side). These spectra are a superposition of pure spectra of the uranyl(VI) aquo ion and the 1![[thin space (1/6-em)]](https://www.rsc.org/images/entities/char_2009.gif) :
:![[thin space (1/6-em)]](https://www.rsc.org/images/entities/char_2009.gif) 1 complex (see Fig. 4). The ratio of these two complexes differs depending on the excitation wavelength. This is caused by differences in excitation spectra of uranyl(VI) aquo ion and 1
1 complex (see Fig. 4). The ratio of these two complexes differs depending on the excitation wavelength. This is caused by differences in excitation spectra of uranyl(VI) aquo ion and 1![[thin space (1/6-em)]](https://www.rsc.org/images/entities/char_2009.gif) :
:![[thin space (1/6-em)]](https://www.rsc.org/images/entities/char_2009.gif) 1 complex.
1 complex.
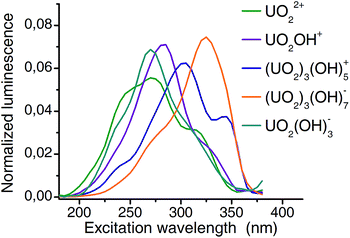
Extracted emission spectra as well as pH distribution pattern from CW spectroscopy are consistent with those from TRLFS measurements. The structure of PARAFAC deconvolution implies that the columns of the third matrix are directly connected to the first two matrices. Therefore the extracted excitation spectra (Fig. 7) belong to the previous defined complexes. Excitation maxima shift from 270 nm (aquo ion) to 325 nm (3![[thin space (1/6-em)]](https://www.rsc.org/images/entities/char_2009.gif) :
:![[thin space (1/6-em)]](https://www.rsc.org/images/entities/char_2009.gif) 7 complex) and thus, a remarkable difference of more than 50 nm is observed. It should be noted, that the resolution (5 nm with 10 nm bandwidth) of excitation wavelength allows an estimation of maxima with an accuracy of 5 nm.
7 complex) and thus, a remarkable difference of more than 50 nm is observed. It should be noted, that the resolution (5 nm with 10 nm bandwidth) of excitation wavelength allows an estimation of maxima with an accuracy of 5 nm.
A summary of all luminescence spectroscopic parameters from this work together with literature values is given in Table 1. The presented data of this study are within variation of previously published results. Different experimental conditions (ionic strength, temperature) as well as equipment setup limit the comparability of luminescence decay times.60,61
In order to examine whether the tentative assignment of the species is realistic, time-dependent DFT (TD-DFT) calculations were performed. TD-DFT was previously applied on actinide complexes to study UV-vis absorption spectra67 and X-ray absorption spectra.68,69
In the calculated spectra of pure water cluster ([(H2O)11]) and hydroxo ion cluster ([(OH)2(H2O)9]2−) strong absorption were found below 170 nm and 220 nm, respectively. Therefore calculated uranyl hydroxo absorption features below 220 nm do not contribute to luminescence and were excluded from the spectra. Hence, the term ‘excitation spectra’ is used for all calculated absorption spectra to avoid confusions in comparing experiment and calculation.
Large manifold of states between 200 nm and 300 nm creates overall broad excitation in the calculated excitation spectra of the uranyl(VI) aquo ion. Among them, there are four major peaks at 272 nm (excited state #7), 252 nm (#16), 232 nm (#33), and 219 nm (#39). Peak #7 occurs via electron transfer from the molecular orbital (MO) 47 to MO 51. The MO 47 consists mainly of oxygen 2p atomic orbital (AO) of coordinating water molecule, whereas MO 51 consists primarily of uranium 5fδ AO. Therefore the excitation #7 can be described as ligand-to-metal charge transfer (LMCT) state by electron transfer from coordinating water to uranium. Similarly, other excitation states (#16, #33, #39) occur also by water to U 5fδ/5fϕ charge transfer. In the calculated excitation spectra of the aquo ion there are four major states of similar origin. They are degenerate because of slightly different orientation of water-to-uranium coordination.
Two major features at around 300 nm and 250 nm dominate the calculated spectra of the 1![[thin space (1/6-em)]](https://www.rsc.org/images/entities/char_2009.gif) :
:![[thin space (1/6-em)]](https://www.rsc.org/images/entities/char_2009.gif) 1 (UO2OH+) species. Both consist of superposition of several excitations. The former (which appears as a shoulder) consists mainly of the excited state #8 which originates from MO 47 to MO 51 transition. The two MOs consist primarily of O 2p from OH− ligand and U 5fδ/5fϕ, respectively. Therefore an OH− to U charge transfer is responsible for this shoulder. The strong excitation at around 250 nm consists essentially of excited state #18 (MO 45 to MO 50 transition) which represents ligand water to U charge transfer. Spectra shape and relative position (compared to uranyl(VI) aquo ion) show, that the experimental obtained lifetime around 8 μs is connected to the 1
1 (UO2OH+) species. Both consist of superposition of several excitations. The former (which appears as a shoulder) consists mainly of the excited state #8 which originates from MO 47 to MO 51 transition. The two MOs consist primarily of O 2p from OH− ligand and U 5fδ/5fϕ, respectively. Therefore an OH− to U charge transfer is responsible for this shoulder. The strong excitation at around 250 nm consists essentially of excited state #18 (MO 45 to MO 50 transition) which represents ligand water to U charge transfer. Spectra shape and relative position (compared to uranyl(VI) aquo ion) show, that the experimental obtained lifetime around 8 μs is connected to the 1![[thin space (1/6-em)]](https://www.rsc.org/images/entities/char_2009.gif) :
:![[thin space (1/6-em)]](https://www.rsc.org/images/entities/char_2009.gif) 1 but not the 2
1 but not the 2![[thin space (1/6-em)]](https://www.rsc.org/images/entities/char_2009.gif) :
:![[thin space (1/6-em)]](https://www.rsc.org/images/entities/char_2009.gif) 2 complex (see ESI†).
2 complex (see ESI†).
In the calculated spectra of the 3![[thin space (1/6-em)]](https://www.rsc.org/images/entities/char_2009.gif) :
:![[thin space (1/6-em)]](https://www.rsc.org/images/entities/char_2009.gif) 5 species there are three main excitation features at around 310 nm, 280 nm, and 240 nm. The first peak can be assigned to excitations from OOH MO to U MO. Both additional spectral features result from an analogous ligand-to-metal charge transfer from Ocentral and OH2O, respectively.
5 species there are three main excitation features at around 310 nm, 280 nm, and 240 nm. The first peak can be assigned to excitations from OOH MO to U MO. Both additional spectral features result from an analogous ligand-to-metal charge transfer from Ocentral and OH2O, respectively.
The presence and orientation of second shell waters significantly affect the calculated excitation spectra of negatively charged uranyl(VI) species. However, the orientation of such water is not at all obvious and requires input from molecular dynamics simulations.70–72 Therefore exclusively spectra of positively charged species are compared in Fig. 8 (complexes 1![[thin space (1/6-em)]](https://www.rsc.org/images/entities/char_2009.gif) :
:![[thin space (1/6-em)]](https://www.rsc.org/images/entities/char_2009.gif) 3 and 3
3 and 3![[thin space (1/6-em)]](https://www.rsc.org/images/entities/char_2009.gif) :
:![[thin space (1/6-em)]](https://www.rsc.org/images/entities/char_2009.gif) 7 not shown).
7 not shown).
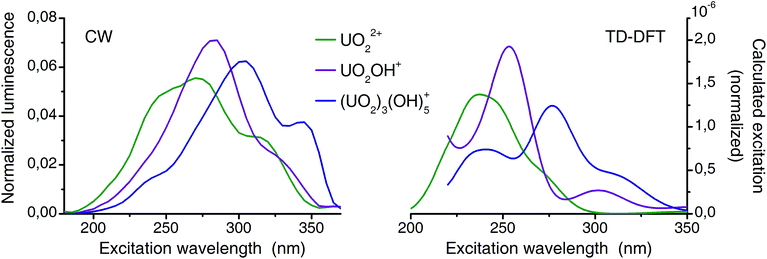 | ||
| Fig. 8 Comparison of deconvoluted (from CW-spectroscopy) and calculated (TD-DFT) excitation spectra (normalized to area). | ||
Previously TD-DFT was used to study the photoexcitation of bare UO22+ ion73 as well as its coordination complexes.74–76 Generally the performance of TD-DFT method is rather poor in predicting the excitation energies of uranyl(VI) especially of higher excited states. This is presumably due to the neglect of double excitations in the scheme of single-determinant method. In the present investigation, in which the higher excited states are concerned, the TD-DFT method has an intrinsic limitation. Although absolute energy has a discrepancy in the order of several thousands of wavenumbers experimental excitation features are overall well reproduced by the TD-DFT calculations (Fig. 8). Since all excitation bands shown here are the LMCT states and do not involve the U–Oax bond, there is minimal effect of neglecting double excitations. Summarized, the calculated spectra reproduce the features of the corresponding experimental spectra very well and confirmed that the experimental excitation spectra truly belong to the assigned species (aquo, 1![[thin space (1/6-em)]](https://www.rsc.org/images/entities/char_2009.gif) :
:![[thin space (1/6-em)]](https://www.rsc.org/images/entities/char_2009.gif) 1, and 3
1, and 3![[thin space (1/6-em)]](https://www.rsc.org/images/entities/char_2009.gif) :
:![[thin space (1/6-em)]](https://www.rsc.org/images/entities/char_2009.gif) 5).
5).
Conclusions
In this study a powerful and advanced combination of experimental (TRLFS and CW-spectroscopy) and theoretical (PARAFAC and TD-DFT) methods was proposed for the speciation of luminescent metals. It has been demonstrated to be successful for uranyl(VI) hydrolysis without contradictions to the literature. A consistent spectroscopic detection as well as identification of species distribution of major hydrolysis species (uranyl(VI) aquo ion, 1![[thin space (1/6-em)]](https://www.rsc.org/images/entities/char_2009.gif) :
:![[thin space (1/6-em)]](https://www.rsc.org/images/entities/char_2009.gif) 1, 3
1, 3![[thin space (1/6-em)]](https://www.rsc.org/images/entities/char_2009.gif) :
:![[thin space (1/6-em)]](https://www.rsc.org/images/entities/char_2009.gif) 5, 3
5, 3![[thin space (1/6-em)]](https://www.rsc.org/images/entities/char_2009.gif) :
:![[thin space (1/6-em)]](https://www.rsc.org/images/entities/char_2009.gif) 7, 1
7, 1![[thin space (1/6-em)]](https://www.rsc.org/images/entities/char_2009.gif) :
:![[thin space (1/6-em)]](https://www.rsc.org/images/entities/char_2009.gif) 3) within one experimental setup (fixed uranyl(VI) concentration [U] = 10−5 M, pH 2 to 11) was achieved for the first time. Spectra shape and lifetimes were found to be well comparable with those in the literature.
3) within one experimental setup (fixed uranyl(VI) concentration [U] = 10−5 M, pH 2 to 11) was achieved for the first time. Spectra shape and lifetimes were found to be well comparable with those in the literature.
Deconvolution of strong overlapping excitation spectra is not straightforward. As before, PARAFAC has demonstrated its validity and robustness. Therefore the deconvolution of heavy metal luminescence data, based on differences in excitation, can be applied at room temperature. Individual excitation spectra of detected uranyl(VI) hydrolysis species were extracted for a UV range from 180 nm to 370 nm. This impressively demonstrates for the first time that excitation in this region is highly sensitive and specific. According to the TD-DFT calculations, excitation in this spectral range is due to ligand-to-metal charge transfer (LMCT) and the spectra features are ligand specific (water, hydroxo, oxo). Therefore even the shape of the uranyl(VI) excitation spectra is indicative of complex stoichiometry.
Luminescence decay is an excellent parameter to discriminate between several uranyl(VI) complexes. However, a correlation with structure is difficult and reported lifetimes are often inconsistent.60 Moreover the choice of the laser wavelength for TRLFS measurements can directly influence the results. A better discrimination of several uranyl(VI) compounds with accessible structural information might be achieved by the ‘site sensitive excitation’ here proposed. Therefore further elucidation of the thermodynamics of uranyl(VI) polynuclear species becomes possible.
This combination of experimental and theoretical methods can be applied for better understanding the speciation of luminescent metals in general. In addition to actinides (e.g. Np, U, Am, Cm) an application area is coordination chemistry of rare earth elements (e.g. Ce, Nd, Eu, Tb) which are of strategic importance for high-technology products world-wide.
Acknowledgements
The authors thank Frank Bok for the EQ3/6 calculations. All quantum-chemical calculations were performed using PC-Farm Atlas at the Center for Information Services and High Performance Computing (ZIH) at the Technische Universität Dresden, Germany, using the library program Gaussian 09.References
- R. Xie, W. Johnson, S. Spayd, G. S. Hall and B. Buckley, Anal. Chim. Acta, 2006, 578, 186–194 CrossRef CAS PubMed
.
- J. Bayona, Trends Anal. Chem., 2000, 19, 107–112 CrossRef CAS
.
- H. Sodaye, S. Nisan, C. Poletiko, S. Prabhakar and P. Tewari, Desalination, 2009, 235, 9–32 CrossRef CAS PubMed
.
- W. Li, J. Zhao, C. Li, S. Kiser and R. Jack Cornett, Anal. Chim. Acta, 2006, 575, 274–280 CrossRef CAS PubMed
.
- A. C. Fournier, K. L. Shafran and C. C. Perry, Anal. Chim. Acta, 2008, 607, 61–73 CrossRef CAS PubMed
.
- P. L. Zanonato, D. B. Plinio and I. Grenthe, Dalton Trans., 2014, 43, 2378–2383 RSC
.
- C. Walther, M. Fuss and S. Buchner, Radiochim. Acta, 2008, 96, 411–426 CrossRef CAS
.
- H. Zhao, H. Liu and J. Qu, J. Colloid Interface Sci., 2009, 330, 105–112 CrossRef CAS PubMed
.
-
R. Guillaumont, T. Fanghänel, V. Neck, J. Fuger, D. A. Palmer, I. Grenthe and M. H. Rand, Update on the chemical thermodynamics of uranium, neptunium, plutonium, americium and technetium, Elsevier Amsterdam, 2003 Search PubMed
.
- K. Müller, V. Brendler and H. Foerstendorf, Inorg. Chem., 2008, 47, 10127–10134 CrossRef PubMed
.
- P. L. Brown, Radiochim. Acta, 2002, 90, 589–593 CrossRef CAS
.
- P. Zanonato, P. Di Bernardo, A. Bismondo, G. Liu, X. Chen and L. Rao, J. Am. Chem. Soc., 2004, 126, 5515–5522 CrossRef CAS PubMed
.
- L. Rao, Chem. Soc. Rev., 2007, 36, 881–892 RSC
.
- K. Müller, H. Foerstendorf, S. Tsushima, V. Brendler and G. Bernhard, J. Phys. Chem. A, 2009, 113, 6626–6632 CrossRef PubMed
.
- H. Moll, A. Rossberg, R. Steudtner, B. Drobot, K. Müller and S. Tsushima, Inorg. Chem., 2014, 53, 1585–1593 CrossRef CAS PubMed
.
- D. L. Clark, S. D. Conradson, R. J. Donohoe, D. W. Keogh, D. E. Morris, P. D. Palmer, R. D. Rogers and C. D. Tait, Inorg. Chem., 1999, 38, 1456–1466 CrossRef CAS
.
- F. Quilès, C. Nguyen-Trung, C. Carteret and B. Humbert, Inorg. Chem., 2011, 50, 2811–2823 CrossRef PubMed
.
- Z. Szabó and I. Grenthe, Inorg. Chem., 2010, 49, 4928–4933 CrossRef PubMed
.
- C. Moulin, I. Laszak, V. Moulin and C. Tondre, Appl. Spectrosc., 1998, 52, 528–535 CrossRef CAS
.
- Z. Wang, J. M. Zachara, W. Yantasee, P. L. Gassman, C. Liu and A. G. Joly, Environ. Sci. Technol., 2004, 38, 5591–5597 CrossRef CAS
.
- J. Tits, G. Geipel, N. Macé, M. Eilzer and E. Wieland, J. Colloid Interface Sci., 2011, 359, 248–256 CrossRef CAS PubMed
.
- D. Beltrami, F. Mercier-Bion, G. Cote, H. Mokhtari, B. Courtaud, E. Simoni and A. Chagnes, J. Mol. Liq., 2014, 190, 42–49 CrossRef CAS PubMed
.
- M. Marques Fernandes, M. Schmidt, T. Stumpf, C. Walther, D. Bosbach, R. Klenze and T. Fanghänel, J. Colloid Interface Sci., 2008, 321, 323–331 CrossRef CAS PubMed
.
- K. Holliday, C. Babelot, C. Walther, S. Neumeier, D. Bosbach and T. Stumpf, Radiochim. Acta, 2012, 100, 189–195 CrossRef CAS
.
- J. Carroll and J.-J. Chang, Psychometrika, 1970, 35, 283–319 CrossRef
.
- R. A. Harshman, UCLA Working Papers in Phonetics, 1970, 16, 1–84 Search PubMed
.
- C. A. Andersson and R. Bro, Chemom. Intell. Lab. Syst., 2000, 52, 1–4 CrossRef CAS
.
- N. P. Sanchez, A. T. Skeriotis and C. M. Miller, Water Res., 2013, 47, 1679–1690 CrossRef CAS PubMed
.
- J. Schott,
et al.
, Dalton Trans., 2014, 43, 11516–11528 RSC
.
- T. Saito, H. Sao, K. Ishida, N. Aoyagi, T. Kimura, S. Nagasaki and S. Tanaka, Environ. Sci. Technol., 2010, 44, 5055–5060 CrossRef CAS PubMed
.
- R. Bro, Chemom. Intell. Lab. Syst., 1997, 38, 149–171 CrossRef CAS
.
- R. Bro and H. A. L. Kiers, J. Chemom., 2003, 17, 274–286 CrossRef CAS
.
- R. Bro and A. K. Smilde, J. Chemom., 2003, 17, 16–33 CrossRef CAS
.
-
R. Bro, The N-way on-line course on PARAFAC and PLS, http://www.models.life.ku.dk/courses, 1998–2002 Search PubMed
.
-
M. J. Frisch, et al., Gaussian 09 Revision A.2, Gaussian Inc., Wallingford CT, 2009 Search PubMed
.
- V. Barone and M. Cossi, J. Phys. Chem. A, 1998, 102, 1995–2001 CrossRef CAS
.
- M. Cossi, N. Rega, G. Scalmani and V. Barone, J. Comput. Chem., 2003, 24, 669–681 CrossRef CAS PubMed
.
- A. D. Becke, J. Chem. Phys., 1993, 98, 5648–5652 CrossRef CAS PubMed
.
- C. Lee, W. Yang and R. G. Parr, Phys. Rev. B: Condens. Matter Mater. Phys., 1988, 37, 785 CrossRef CAS
.
- M. E. Casida, C. Jamorski, K. C. Casida and D. R. Salahub, J. Chem. Phys., 1998, 108, 4439–4449 CrossRef CAS PubMed
.
- R. E. Stratmann, G. E. Scuseria and M. J. Frisch, J. Chem. Phys., 1998, 109, 8218–8224 CrossRef CAS PubMed
.
- W. Küchle, M. Dolg, H. Stoll and H. Preuss, J. Chem. Phys., 1994, 100, 7535–7542 CrossRef PubMed
.
- S. Tsushima, Dalton Trans., 2011, 40, 6732–6737 RSC
.
- S. Tsushima, Inorg. Chem., 2012, 51, 1434–1439 CrossRef CAS PubMed
.
- R. Krishnan, J. Binkley, R. Seeger and J. Pople, J. Chem. Phys., 1980, 72, 650–654 CrossRef CAS PubMed
.
- R. Steudtner, T. Arnold, G. Geipel and G. Bernhard, J. Radioanal. Nucl. Chem., 2010, 284, 421–429 CrossRef CAS PubMed
.
-
T. J. Wolery, EQ3/6: a software package for geochemical modeling of aqueous systems: package overview and installation guide (version 7.0), Lawrence Livermore National Laboratory, Livermore, CA, 1992 Search PubMed
.
- G. Meinrath, S. Lis, Z. Stryla and C. Noubactep, J. Alloys Compd., 2000, 300–301, 107–112 CrossRef CAS
.
- M. Moriyasu, Y. Yokoyama and S. Ikeda, J. Inorg. Nucl. Chem., 1977, 39, 2211–2214 CrossRef CAS
.
- C. Moulin, P. Decambox, V. Moulin and J. G. Decaillon, Anal. Chem., 1995, 67, 348–353 CrossRef CAS
.
- V. Eliet, I. Grenthe and G. Bidoglio, Appl. Spectrosc., 2000, 54, 99–105 CrossRef CAS
.
- T. Kimura, R. Nagaishi, M. Arisaka, T. Ozaki and Z. Yoshida, Radiochim. Acta, 2002, 90, 715–720 CrossRef CAS
.
- A. Kirishima, T. Kimura, O. Tochiyama and Z. Yoshida, J. Alloys Compd., 2004, 374, 277–282 CrossRef CAS PubMed
.
- C. D. Flint, P. A. Tanner, R. Reisfeld and H. Tzehoval, Chem. Phys. Lett., 1983, 102, 249–253 CrossRef CAS
.
- K. Murata and M. Morita, J. Lumin., 1984, 29, 381–387 CrossRef CAS
.
- G. Liu and M. Jensen, Chem. Phys. Lett., 2010, 499, 178–181 CrossRef CAS PubMed
.
- G. Liu, L. Rao and G. Tian, Phys. Chem. Chem. Phys., 2013, 15, 17487–17495 RSC
.
- G. Meinrath, J. Radioanal. Nucl. Chem., 1997, 224, 119–126 CrossRef CAS
.
- G. Wang, Y. Su and D. L. Monts, J. Phys. Chem. A, 2008, 112, 10502–10508 CrossRef CAS PubMed
.
- I. Billard,
et al.
, Appl. Spectrosc., 2003, 57, 1027–1038 CrossRef CAS
.
- G. Budylin, E. Shirshin, V. Fadeev, V. Petrov and S. Kalmykov, Opt. Express, 2013, 21, 20517–20528 CrossRef PubMed
.
- V. Eliet, G. Bidoglio, N. Omenetto, L. Parma and I. Grenthe, J. Chem. Soc., Faraday Trans., 1995, 91, 2275–2285 RSC
.
- Y. Kato, G. Meinrath, T. Kimura and Z. Yoshida, Radiochim. Acta, 1994, 64, 107–112 CAS
.
- G. Bernhard, G. Geipel, V. Brendler and H. Nitsche, Radiochim. Acta, 1996, 74, 87–92 CAS
.
- G. Meinrath, Y. Kato and Z. Yoshida, J. Radioanal. Nucl. Chem., 1993, 174, 299–314 CrossRef CAS
.
- G. Geipel, A. Brachmann, V. Brendler, G. Bernhard and H. Nitsche, Radiochim. Acta, 1996, 75, 199–204 CAS
.
- J. Wiebke, A. Moritz, M. Glorius, H. Moll, G. Bernhard and M. Dolg, Inorg. Chem., 2008, 47, 3150–3157 CrossRef CAS PubMed
.
- S. A. Kozimor,
et al.
, Inorg. Chem., 2008, 47, 5365–5371 CrossRef CAS PubMed
.
- S. A. Kozimor,
et al.
, J. Am. Chem. Soc., 2009, 131, 12125–12136 CrossRef CAS PubMed
.
- M. Bühl, R. Diss and G. Wipff, J. Am. Chem. Soc., 2005, 127, 13506–13507 CrossRef PubMed
.
- M. Bühl, G. Schreckenbach, N. Sieffert and G. Wipff, Inorg. Chem., 2009, 48, 9977–9979 CrossRef PubMed
.
- M. Bühl and G. Schreckenbach, Inorg. Chem., 2010, 49, 3821–3827 CrossRef PubMed
.
- F. Réal, V. Vallet, C. Marian and U. Wahlgren, J. Chem. Phys., 2007, 127, 214302 CrossRef PubMed
.
- J. Wiebke, A. Weigand, D. Weissmann, M. Glorius, H. Moll, G. Bernhard and M. Dolg, Inorg. Chem., 2010, 49, 6428–6435 CrossRef CAS PubMed
.
- S. Tsushima, Inorg. Chem., 2009, 48, 4856–4862 CrossRef CAS PubMed
.
- S. Tsushima, C. Goetz and K. Fahmy, Chem.–Eur. J., 2010, 16, 8029–8033 CrossRef CAS PubMed
.
Footnote |
† Electronic supplementary information (ESI) available: Calculated excitation spectra (including 2![[thin space (1/6-em)]](https://www.rsc.org/images/entities/char_2009.gif) : :![[thin space (1/6-em)]](https://www.rsc.org/images/entities/char_2009.gif) 2 complex) and atomic coordinates used for TD-DFT. See DOI: 10.1039/c4sc02022g 2 complex) and atomic coordinates used for TD-DFT. See DOI: 10.1039/c4sc02022g |
| This journal is © The Royal Society of Chemistry 2015 |

