 Open Access Article
Creative Commons Attribution 3.0 Unported Licence
Which conformations make stable crystal structures? Mapping crystalline molecular geometries to the conformational energy landscape†
Hugh P. G.
Thompson
a and
Graeme M.
Day
*b
aDepartment of Chemistry, University of Cambridge, Lensfield Road, Cambridge CB2 1EW, UK
bSchool of Chemistry, University of Southampton, Highfield, Southampton, SO17 1BJ, UK. E-mail: G.M.Day@soton.ac.uk
First published on 13th May 2014
Abstract
The ability to anticipate the shape adopted by flexible molecules in the solid state is crucial for engineering and predicting crystal packing and, hence, properties. In this study, the conformations adopted by flexible molecules in their crystal structures are assessed in terms of their relationship to the calculated global conformational landscape. The study quantifies the limits on molecular strain that can be induced by intermolecular interactions in single-component crystal structures of molecules with no intramolecular hydrogen bonding, demonstrating that some molecules are distorted by up to 20 kJ mol−1 by crystal packing forces. Furthermore, we find that crystallisation often selects high energy conformers, but only when the high energy conformer is more extended than the lower energy options, allowing for greater intermolecular stabilisation. Based on these observations, we propose that the crystallisability of conformers is assessed in terms of their energies and surface areas. We formulate this as a parameterised pseudo-energy related to molecular surface area, which leads to a dramatic improvement in our ability to predict the conformations adopted by molecules in their crystal structures.
1 Introduction
Crystal engineering involves the design of crystal structures and the deliberate targeting of solid-state properties through our understanding of structure–property relationships. Successful crystal engineering relies, in part, on a knowledge of the overall shape of molecular building-blocks, as well as the relative arrangement of functional groups within a molecule that can participate in structure-directing interactions. Molecular shape can be easily predicted for rigid molecules, but becomes more challenging to anticipate as molecular flexibility is increased and the molecules of interest have a choice of conformer when self-assembling into a crystal. Conformation determines the overall molecular shape and position of functional groups, so different conformers may lead to very different crystal packing arrangements, ultimately influencing the properties of the crystal. Therefore, conformational flexibility can be seen as a potential obstacle to crystal engineering. This is particularly relevant for the engineering of pharmaceutical materials, where solid form properties of active pharmaceutical ingredients may be manipulated, either by selection between polymorphs, or the design of multi-component crystals, such as salts or cocrystals.Here, we address the issue of predicting which conformation will be adopted in a flexible molecule's crystal structure. We approach this problem from the point of view of computationally-guided crystal engineering and the development of methods for crystal structure prediction (CSP). CSP, as applied to organic molecules, has made substantive progress over the past decade.1–3 The most commonly applied CSP method is based upon a global search of the lattice energy surface.4 The main assumption is that the most likely observable crystal structures correspond to the lowest energy minima. This approach has been successfully applied to the prediction of both single-5–8 and multi-component6,7,9 molecular crystal structures, sometimes guiding experimental efforts towards the discovery of new solid forms.10,11
In terms of crystal engineering and crystal structure modelling, a rigid molecule should be defined as a molecule that has a single conformation and where that conformation is unaffected by crystal packing forces. For a rigid molecule, CSP requires an exploration of possible structures as a function of unit cell dimensions, molecular positions and orientations. Once a set of crystal structures is generated, their ranking by relative energies requires the calculation of intermolecular interactions only. Putative crystal structures are often separated by small energy differences, and the goal of CSP has encouraged the development of accurate models for intermolecular interactions.12
The challenges involved with extending the capabilities of CSP methods to dealing with flexible molecules have hindered applications to pharmaceutical molecules, and are apparent in the results of the CSP blind tests,2,3 where success rates for flexible molecules are low. The two principle difficulties associated with molecular flexibility are that:
1. The flexibility of intramolecular degrees of freedom means that the molecular geometry may be distorted under the influence of intermolecular interactions in a crystal structure, to reach the optimum balance between inter- and intramolecular energies. Therefore, the impact of the crystalline environment on the molecular geometry must be modelled.
2. Conformational degrees of freedom increase the dimensionality of the energy landscape that must be explored when generating crystal structures.
The distortion of molecules away from their gas phase structures has recently been discussed in the context of conformational polymorphism.13 Off-the-shelf force field methods for modelling intramolecular interactions do not provide a sufficiently accurate description of the associated energetic cost.14 Therefore, the high demands of CSP for flexible molecules have required either solid-state electronic structure based approaches15,16 or hybrid energy models, where intramolecular degrees of freedom are treated quantum mechanically and atom–atom models are used for intermolecular interactions.17–21
The problem of sampling conformational phase space and predicting the relevant molecular geometries is less well developed. Conformational degrees of freedom can be sampled concurrently with packing parameters, but for highly flexible molecules it can be advantageous to split the high dimensional global optimisation problem into two smaller problems: a search for relevant conformers followed by a crystal packing search for each. Apart from reducing the dimensionality of the search space, this approach leaves room for additional selection criteria when assessing which molecular conformations might lead to the most stable crystal structures.22,23
A purpose of this work is to study the conformational energy landscapes of a large set of flexible, pharmaceutical-like molecules, to investigate the relationship between the ensemble of possible conformers of the isolated molecules and the molecular geometries seen in their observed crystal structures. These comparisons should provide insight into conformational preferences in crystal packing and inform the future development of structure prediction methods for flexible molecules. Therefore, we have carried out a series of calculations to address the following questions:
• Which conformation will a molecule adopt, and where on the energy landscape of the isolated molecule is this conformation found?
• Apart from energy, can other molecular properties be identified that predict which conformation will be observed in crystal structures?
A starting assumption in this work is that the geometry adopted by a molecule in its crystal structure will be close to that of one of the conformers of the isolated molecule. However, in comparing the energy landscape of the isolated molecule to its crystalline geometry, we also investigate to what extent molecular geometries are distorted away from the geometry of the isolated conformer by intermolecular forces. The results will help quantify the importance of considering distortions away from idealised molecular geometries when attempting to predict the crystalline arrangement of organic molecules, in a general crystal engineering context as well as for the specific goal of ab initio CSP.
2 Methods
The aim of this investigation is to compare the geometries that organic molecules adopt in their crystal structures to the landscape of possible conformers of the isolated molecule. For molecules whose crystal structures have been determined, the crystalline molecular geometries are obtained from the atomic coordinates in the crystal structure. However, an exhaustive set of conformers is only available from computational methods. The methods used for conformational searches and energy calculations on the observed and calculated molecular geometries are described below.2.1 Crystal structure optimisations
The first aim is to obtain an accurate geometry and energy for all conformations of a molecule in all of its observed crystal structures. The energies of the molecular geometries observed in the known crystal structures were evaluated after lattice energy minimisation of the experimentally determined crystal structures, removing the influence of experimental errors in atomic coordinates.For consistency, we apply the same level of theory in an atomic basis set method for crystal and molecular energy calculations: we use dispersion-corrected density functional theory (DFT-D), which has been shown to provide an accurate description of the structures and energies of molecular organic crystals.15,24,25 All DFT-D calculations were performed using the CRYSTAL09 (ref. 26 and 27) software, with the B3LYP hybrid functional,28,29 6-31G* basis set, and the rescaled empirical dispersion correction suggested by Civalleri et al.30 All atomic positions were relaxed during lattice energy minimisation, with unit cell dimensions constrained at experimentally determined values. All single molecule calculations were also performed in CRYSTAL09, using the same functional, basis set, DFT integration grid and optimisation thresholds as the periodic lattice energy minimisations. Full details of DFT-D calculations are provided in the ESI.†
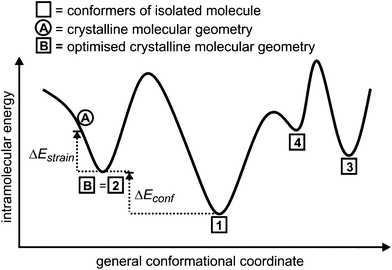
All symmetry-independent molecules were extracted from the optimised crystal structures and single-point molecular energy calculations were performed to give the energies of the molecules in their crystalline geometry (see point A in Fig. 1). These molecular geometries were also taken as starting points for unconstrained molecular geometry optimisations, yielding the local energy minimum on the conformational energy surface associated with the crystalline molecular geometry (point B, Fig. 1). We refer to the energy difference between the single-point and optimised molecular geometries as the intramolecular strain energy, ΔEstrain.
2.2 Conformational searches
We applied a low-mode conformational search (LMCS31,32) method, as implemented in MacroModel,33 to generate as complete and unbiased sets of conformers as possible for each molecule studied. LMCS is a mode-following algorithm – a starting molecular geometry is perturbed along one or a combination its calculated normal modes before re-minimising. Full details of the search parameters used here are available in the ESI.†All unique conformers resulting from an initial search using the OPLS2005 (ref. 34) force field were re-optimised using DFT-D, applying the same computational parameters described above for the crystalline molecular geometries. The result should be a complete set of low energy conformers for each molecule (points 1–4 in Fig. 1), assuming that the conformer search was complete and that all local minima on the conformational energy surface described by DFT-D have a corresponding local minimum on the force field described energy surface. The predicted conformations were re-clustered to remove duplicates after DFT-D re-optimisation and, in most cases, additional structures were removed at this stage, suggesting that the DFT-D conformational energy surface is smoother than the OPLS surface.
Geometric comparisons were performed to locate the optimised conformations taken from the observed crystal structures in the sets of predicted conformers (e.g. point B = point 2 in Fig. 1). We refer to the energy difference between the conformer corresponding to the crystalline geometry and the lowest energy computer-generated conformer as the relative conformational energy, ΔEconf (Fig. 1).
As further characterisation of the conformational energy landscape, the Connolly surface area of each DFT-D-optimised conformer was calculated using Material Studio35 with a probe radius of 1.8 Å.
2.3 Choice of molecules
The molecules included in the study were chosen to explore a range of molecular size and flexibility. To focus on pharmaceutical-like molecules, we restricted ourselves to molecules that satisfy Lipinski's rule of five,36 placing limits on molecular mass, number of hydrogen bond donors and acceptors and predicted octanol–water partition coefficient. Molecules with the potential for intramolecular hydrogen bonding are excluded to focus on molecules without strong, directional non-bonded intramolecular interactions. The influence of intramolecular hydrogen bonding on the conformations adopted in crystal structures is the subject of an on-going study.Molecular flexibility was measured by the number of rotatable (exocyclic) single bonds in the molecule, excluding terminal methyl groups. Three molecules were chosen with each of 4, 5, 6, 7 and 8 such rotatable bonds, yielding a test set of 15 molecules. While their presence was not used as a criterion for the selection of molecules, the set also includes molecules with flexible ring systems, whose flexibility is sampled during the low-mode conformational search.
All chosen molecules have experimentally determined crystal structures and the molecules were selected to include diversity in known polymorphic behaviour. For each level of flexibility, one molecule was chosen with known conformational polymorphism, one with known packing polymorphism (alternative crystal packings of the same molecular conformation) and one molecule with no reported polymorphism. To maximise the data obtained from each molecule, molecules with the most reported polymorphs at each level of flexibility were selected. For molecules with the same number of known polymorphs, and for the non-polymorphic molecules, the molecule with the highest quality reported crystal structure (as measured by the R factor) was chosen. To our knowledge, no solvate structures have been reported for the molecules in our set, so the study includes only single-component crystal structures. We refer to molecules by their 6-letter Cambridge Structural Database (CSD)37 REFCODE family names which are provided, along with chemical diagrams, in Table 1.
3 Results and discussion
3.1 Intramolecular strain energy
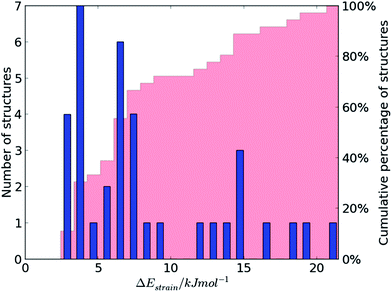
Any distortion in the crystal structure away from the molecular geometry of the isolated molecule must involve an increase in intramolecular energy, ΔEstrain, which we calculate with reference to the nearest local minimum on the isolated molecule's energy surface (see Fig. 1).The distribution of ΔEstrain is summarised in Fig. 2 for the 36 distinct molecular geometries in the 29 lattice energy minimised crystal structures of the 15 molecules (see Table S1 in ESI†), including molecular geometries from different polymorphs and independent molecules within the same crystal structure (for structures with multiple molecules in the asymmetric unit).
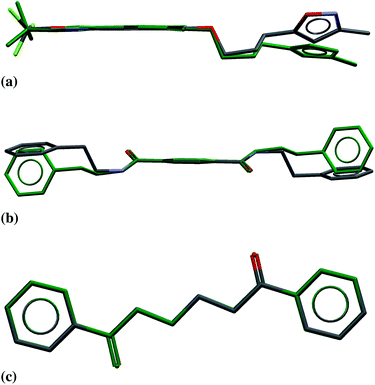
There is a correlation, albeit weak, between ΔEstrain and the geometrical distortion of the crystalline molecular geometry away from the geometry of the isolated molecule (see Fig. S3 and S4 in ESI†). However, there are cases where a large molecular strain energy results from very small changes to stiff intramolecular degrees of freedom or where large geometry changes come at a relatively low energetic cost. The latter typically correspond to rotation about soft dihedrals (for example, see Fig. 3a).
The majority (75%) of molecules are strained by less than 10 kJ mol−1 and it is unsurprising in these cases that the increase in intramolecular energy can be compensated by improved intermolecular interactions in the crystal. However, we find several cases of surprisingly high strain energies. The highest values calculated for the molecules studied here are ΔEstrain = 18.3 and 21.6 kJ mol−1 in the two polymorphs FIBKUW01 and FIBKUW02 and ΔEstrain = 19.0 mol−1 in the monoclinic polymorph of N,N′-di(phenylethyl)terephthalamide (CELHIL01, see Fig. 3b). One important observation is that high intramolecular strain energies are not restricted to large molecules: two of the smallest molecules in our set show large strain in their crystal structures: SIKRIN (ΔEstrain = 14.6 kJ mol−1) and HIBGUV (ΔEstrain = 14.4 kJ mol−1, in its monoclinic beta polymorph). The results that we find here are in broad agreement with those recently reported for a large set of conformational polymorphs.13
At the low energy end of the ΔEstrain distribution, we note that none of the molecules are completely unaffected by crystal packing. The smallest calculated value is ΔEstrain = 2.4 kJ mol−1 for the triclinic polymorph of 1,4-dibenzoylbutane (CSD REFCODE GALCAX01), corresponding to an all-atom RMS difference in atomic positions of 0.03 Å between gas and solid phase molecular geometries (Fig. 3c). From a structure prediction perspective, these results demonstrate the limitations of any rigid-molecule treatment of even moderately flexible molecules, where the molecule in the crystal structure is assumed to be undistorted from its gas phase geometry. Energy contributions of 2–3 kJ mol−1 to the relative stability of crystal structures can be crucial in the context of CSP, where energy separations between computer-generated crystal structures are often 1 kJ mol−1 or less.4
3.2 Which conformation is adopted in a crystal structure? Energetics
Molecules are not restricted to their lowest energy conformer during crystallisation and the best balance of inter- and intramolecular interactions sometimes involves a higher energy conformer. We compare the conformers observed in known crystal structures with the sets of predicted conformers to investigate the frequency with which higher energy conformers are adopted in the crystal structures of flexible organic molecules.We define the conformer associated with the crystalline molecular geometry as the structure reached after DFT-D optimisation of the molecule extracted from the crystal structure. From our initial set of 36 independent molecular geometries, we find only 21 distinct conformers because some molecular geometries (e.g. of the packing polymorphs) converge to the same conformer on the gas phase molecular energy surface.
For all molecules apart from one, we find a corresponding conformer in the sets generated by the conformation search. For the remaining molecule, SEVJAF, the original LMCS search failed to return the conformation obtained from the known crystal structure. However, the observed conformer was obtained after initiating a second, longer, search from the geometrically closest conformer in the initial set. For the purposes of this study, we assume that the initial set of SEVJAF conformers is representative of the conformational surface, despite being incompletely explored, and we proceed with the original set of SEVJAF conformers supplemented by the conformer corresponding to the observed crystalline molecular geometry.
The results are summarised in Table 2 using the quantity ΔEconf (Fig. 1), the energy difference between the conformer corresponding to the crystalline molecular geometry and the global minimum conformer found by the conformational search. Surprisingly, only 6 of the 15 molecules adopt the global minimum conformer in one of their known crystal structures. Two of these 6 molecules display conformational polymorphism, adopting a non-global minimum conformer in one polymorph. Therefore, a non-global energy minimum conformer is observed in the crystal structures of 11 of the 15 molecules.
| Molecule | N26 | ΔEconf | Rank | ΔEconf,biased | Rank |
|---|---|---|---|---|---|
| a Rankings and ΔE may be larger than reported for SEVJAF, due to an incomplete sampling of conformations (see text). | |||||
| HIBGUV1 | 10 | 4.83 | 7 | 1.55 | 7 |
| HIBGUV2 | 10 | 4.17 | 5 | 0.74 | 4 |
| MABZNA | 2 | 0.00 | 1 | 0.00 | 1 |
| SIKRIN | 1 | 0.00 | 1 | 0.00 | 1 |
| FAHNOR1 | 13 | 4.40 | 5 | 0.00 | 1 |
| FAHNOR2 | 13 | 0.00 | 1 | 0.99 | 2 |
| ODNPDS | 4 | 0.00 | 1 | 0.00 | 1 |
| COCAIN | 7 | 1.23 | 2 | 0.43 | 2 |
| VEMTOW1 | 12 | 0.35 | 3 | 0.55 | 4 |
| VEMTOW2 | 12 | 0.00 | 1 | 0.00 | 1 |
| FIBKUW | 35 | 5.88 | 10 | 0.00 | 1 |
| NEQNIG | 105 | 0.00 | 1 | 0.00 | 1 |
| HAJYUN1 | 124 | 15.01 | 67 | 4.29 | 29 |
| HAJYUN2 | 124 | 13.85 | 52 | 2.15 | 9 |
| GALCAX | 73 | 18.55 | 27 | 0.00 | 1 |
| SEVJAF | 623 | 21.25 | ≥283a | 3.70 | ≥49a |
| DANQEP1 | 115 | 3.54 | 34 | 2.12 | 12 |
| DANQEP2 | 115 | 2.18 | 18 | 1.82 | 11 |
| DANQEP3 | 115 | 1.46 | 12 | 0.58 | 7 |
| CELHIL | 142 | 22.11 | 108 | 4.81 | 37 |
| DADNUR | 30 | 25.54 | 28 | 4.87 | 5 |
It is clear from these results that a range of molecular conformers must be considered when assessing which molecular conformation will be adopted in the solid state. In the majority of cases, the crystalline geometry is energetically close to the most stable conformer of the isolated molecule: of the 21 conformers in this study, the crystalline conformation is within 5.9 kJ mol−1 of the global minimum in 15 cases. The remaining 6 are more interesting, ranging from ΔEconf = 13.9 to 25.6 kJ mol−1; the highest energy observed conformer in this set of molecules is ΔEconf = 25.6 kJ mol−1 in crystal structure DADNUR. These values suggest that, for a flexible organic molecule, conformations up to about ΔEconf = 26 kJ mol−1 must be considered as possibilities for what will be observed in the solid state.
These results are discouraging for structure prediction and crystal engineering: such an energy window can encompass large numbers of conformers (Table 2), whose shapes and arrangement of functional groups can vary greatly. Using the molecular energy as a sole selection criterion, any conformer within this range should be considered a possibility for what will be observed in a molecule's crystal structure. This raises the question of whether non-energetic descriptors of molecular conformers can be found that highlight those conformers that are most likely to form low energy crystal structures, or filter out those that will not lead to stable crystal structures.
Molecular symmetry may be beneficial for close packing and it has been shown that molecules that adopt a centrosymmetric geometry in their crystal structure almost exclusively crystallise with molecules on crystallographic special positions.38,39 However, it is not clear what role symmetry plays in determining the conformer that a molecule adopts. Here, we observe that, of the six molecules with potential centrosymmetry (FAHNOR, ODNPDS, FIBKUW, GALCAX, CELHIL SIKRIN), five adopt centrosymmetric or nearly centrosymmetric conformations in their crystal structures. For SIKRIN and one polymorph of FAHNOR, the observed centrosymmetric conformer is the global minimum conformer. In all other cases, the global minimum energy conformer lacks centrosymmetry. FIBKUW adopts its lowest energy centrosymmetric conformer, while CELHIL and GALCAX adopt centrosymmetric conformers that are high in energy, in favour of alternative, lower energy centrosymmetric and non-symmetric conformers. The sample is too small to judge the overall importance of centrosymmetry in conformer selection, and further studies focussed on symmetry could be interesting.
3.3 Molecular surface area as a non-energetic criterion for conformer selection
One consequence of molecular flexibility for many of the molecules studied here is the possibility of both compact and extended conformers. The lowest energy conformers tend to be relatively compact, stabilising the conformer by bringing structurally remote atoms into non-bonded contact (e.g.Fig. 4a). Extended, open conformations lack this intramolecular stabilisation, while making more molecular surface area available for intermolecular interactions in the solid state. The observed conformer in crystal structures must represent a balance between these intra- and intermolecular non-bonded interactions.Indeed, in analysing the sets of observed and computer-generated conformers, we find that the conformer that is found in a molecule's crystal structure tends to have a relatively extended geometry (e.g.Fig. 4b). Similar observations have been made regarding a preference for extended conformations of ligands bound to proteins.40 The potential for a molecule to form close intermolecular interactions is limited, at a basic level, by its accessible surface area – the surface area that can be brought into contact with an adjacent molecule. Therefore, to quantitatively compare conformers, we calculated the Connolly surface area41 of all predicted conformers of each molecule, providing the contact surface mapped out by a spherical probe rolling across the van der Waals surface of the molecule. We used a probe radius of 1.8 Å, the approximate radius of a methyl group, to provide a measure of the molecular surface area that is accessible for close intermolecular contact with other copies of itself in a crystal structure.
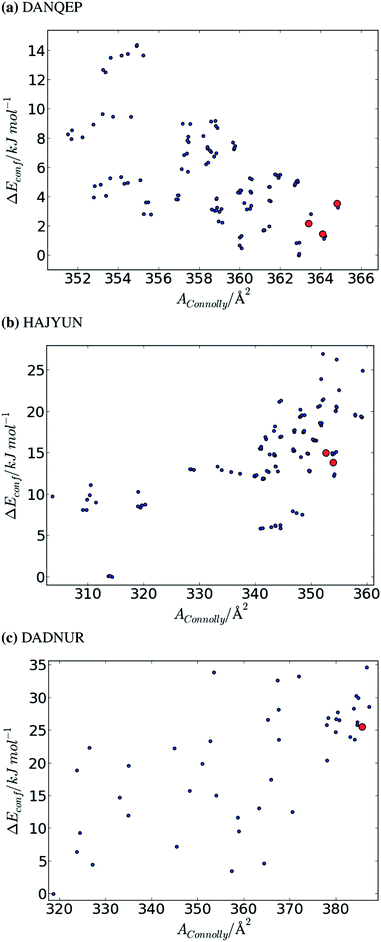
The results for three of the most flexible molecules are summarised in Fig. 5, as plots of relative conformational energy against Connolly surface area. It is clear from these results that conformers with large surface areas are favoured in the crystal structures of flexible molecules. The molecules summarised in Fig. 5 adopt conformers with low (DANQEP, Fig. 5a), middling (HAJYUN, Fig. 5b) and large (DADNUR, Fig. 5c) ΔEconf, while in each case the crystalline conformers are amongst those with the largest possible accessible surface areas.
This observation is not limited to these three molecules; for all 15 molecules, a high energy conformer is adopted in the crystal structure only if it has a larger surface area than that of the global minimum energy conformer (surface area vs. energy plots for all remaining molecules are available in the ESI, Fig. S5–S9†). On the basis of these observations, it appears that compact high-energy conformations are unlikely to occur in crystal structures.
3.4 Relating intermolecular interaction energies to molecular surface area
To further explore the notion that accessible surface area is an indicator of the stabilisation that can be achieved by intermolecular interactions in the crystal, we examined the variation in measured sublimation enthalpies of a series of small, rigid organic molecules as a function of their calculated surface areas. We believe that increased stabilisation due to higher surface area is dominated by dispersion interactions. To focus on dispersion contributions, rather than more specific electrostatic contributions to lattice energies, we limited this study to hydrocarbon crystal structures: details of the molecules and their measured sublimation enthalpies can be found in Table S2 in the ESI.†The relationship between sublimation enthalpy and molecular surface area is remarkably linear (Fig. 6) with very little scatter about a linear regression with a gradient of mEvsSA = 0.75 kJ mol−1 Å−2. This suggests that the increase in intermolecular contributions to lattice energy with increasing molecular surface area should be predictable, at least in the absence of strong, specific intermolecular interactions.
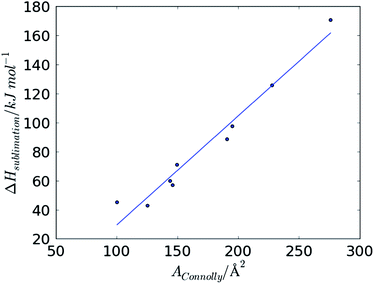 | ||
| Fig. 6 Variation in measured ΔHsublimation with molecular AConnolly for a set of small rigid hydrocarbon crystal structures. | ||
Fig. 7 summarises the energies and surface areas for all conformers of the 15 molecules in our test set; each conformer is represented by its relative energy and relative Connolly surface area, calculated with respect to the energy and surface area of the lowest energy conformer of the same molecule. The gradient, mEvsSA derived from the sublimation enthalpies of rigid hydrocarbons is superimposed on the energy/surface area distribution. We note that all conformers found in the observed crystal structures (highlighted in red, Fig. 7) fall below and to the right of the mEvsSA line, where the expected intermolecular stabilisation due to greater surface area outweighs the higher intramolecular energy than the global minimum conformer.
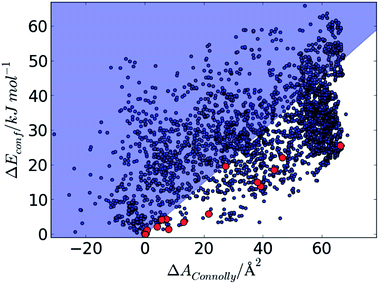 | ||
| Fig. 7 Plot of ΔEconf against relative Connolly surface area, ΔAConnolly for all predicted conformers of the 15 molecules. Conformers that are observed in the known crystal structures are highlighted in red. The diagonal line represents the gradient of energy vs. surface area derived from Fig. 6. | ||
The calculated molecular surface area seems to be predictive of what conformers will be found in crystal structures and we propose that conformers falling in the shaded area (Fig. 7) – compact, high energy conformers whose higher intramolecular energy is not compensated by their expected intermolecular stabilisation – are unlikely to be observed.
We propose that this observation can be formulated as a biasing term added to the calculated conformational energy:
| ΔEconf,biased = ΔEconf + ΔEpseudo,inter | (1) |
| ΔEconf,biased = ΔEDFT-D + mEvsSAΔAConnolly | (2) |
3.5 Re-ranking of predicted conformers
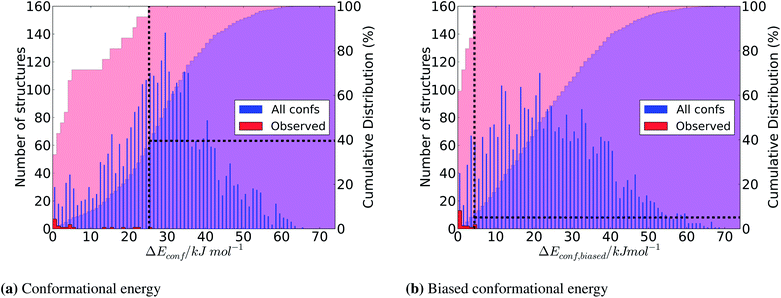
Comparing the distributions of all predicted conformers distributed according to the bare DFT-D energy (Fig. 8a) and Econf,biased (Fig. 8b), we find that the surface area correction term does not dramatically perturb the total distribution of energies. Epseudo,inter has little effect on the total range in energies, while skewing the distribution of structures slightly towards lower relative energies.Most importantly, the location within the overall ensemble of the conformers that are adopted in the crystal structures (red bars in Fig. 8) is changed dramatically. The application of the Epseudo,inter correction leads to a significant enrichment of the observed conformers in the low energy region of the distribution. This is evident from a comparison of the cumulative distribution functions in Fig. 8: all crystalline conformers are found within the first 7.1% of the overall distribution of Econf,biased, while they range over a much greater proportion (39.5%) of the overall distribution of pure Econf.
The improvement is also reflected in the ranking of the observed conformers for each individual molecule (Table 2). The ranking of all of the high energy conformers is dramatically improved after applying the pseudo-intermolecular energy correction. Furthermore, the energy difference, ΔEconf,biased from the global minimum is decreased in almost every case.
Practically, this demonstrates that the combined consideration of calculated intramolecular energy and molecular surface area can narrow the ensemble of conformers that must be considered as likely candidates for what will be found in crystal structures. Specifically, the application of the surface area pseudo-energy correction that we propose here means that the conformers that are seen in observed crystal structures are found much nearer the top of ranked lists of possible conformers than when ranking is based on the calculated energy of the isolated molecule.
In terms of applications to CSP, this extends the size of molecule that can be practically studied, by focussing computing effort on the smaller set of conformers that are able to achieve the best balance of inter- and intramolecular energies in the solid state. In the more general context of crystal engineering, the combined criteria based on calculated energies and molecular surface area can help anticipate the molecular shape and spatial arrangement of functional groups on a molecule, which determines the mutual arrangement of molecules in the solid state, and therefore many materials properties of interest.
3.6 Conclusions
One important conclusion from this study is that flexible molecules frequently do not adopt their lowest energy (global minimum) conformer in their crystal structures, but often assume a higher energy conformer to optimise the balance of inter- and intramolecular interactions. The observed crystalline conformer is usually energetically close to the global minimum, but in several cases molecules are found to adopt high energy conformers, up to 25 kJ mol−1 above the most stable gas phase conformer. As a general rule, high energy conformers are only adopted when there is an associated increase in accessible surface area, increasing the molecule's potential to form stabilising intermolecular interactions.We propose that the relative conformational stabilisation due to intermolecular interactions in a crystal can be estimated from an empirical linear relationship with accessible molecular surface area. This relationship has been parameterised from the variation of measured sublimation enthalpies with molecular surface area for a series of rigid hydrocarbons. By adding this pseudo-energy to the calculated intramolecular energies of conformers, we achieve a dramatic enrichment in the ranking of observed conformers in the low energy range of the global conformational landscape.
A further observation is that, for any molecule with moderate flexibility, there is some molecular distortion away from the gas phase geometry due to intermolecular interactions in a crystal structure: ΔEstrain is never zero and can be as large as about 20 kJ mol−1 for some molecules. This is important for anticipating overall molecular shape when considering how a molecule might pack in its crystal structures. Molecular geometries can be significantly distorted by the close-packed environment in a crystal structure.
The findings are clearly relevant to CSP, where conformational diversity can quickly become the bottleneck in fully exploring structural space for large, flexible molecules. Any narrowing down of the conformational space that must be considered improves the efficiency of global structure searching, reduces the resources that are required to perform predictions for a given molecule and effectively increases the range of these methods. The observations made here are also relevant in more traditional crystal engineering approaches, where the geometrical attributes of a molecule, particularly the arrangement and relative orientation of functional groups, must be anticipated in order to use their interactions to direct the arrangement of molecules in the solid state.
Acknowledgements
We thank Drs Cheryl Doherty and Yuriy Abramov for advice with the study, Dr Aurora Cruz-Cabeza for help in the selection of molecules, and the CCDC for code which helped in conformational clustering. HGPT thanks Pfizer funding via the Pfizer Institute for Pharmaceutical Materials Science. GMD thanks the Royal Society and European Research Council (grant ERC-StG-2012-307358-ANGLE) for funding. Via our membership of the UK's HPC Materials Chemistry Consortium, which is funded by EPSRC (EP/L000202), this work made use of the facilities of HECToR, the UK's national high-performance computing service.References
- G. M. Day, W. D. S. Motherwell, H. L. Ammon, S. X. M. Boerrigter, R. G. Della Valle, E. Venuti, A. Dzyabchenko, J. D. Dunitz, B. Schweizer, B. P. van Eijck, P. Erk, J. C. Facelli, V. E. Bazterra, M. B. Ferraro, D. W. M. Hofmann, F. J. J. Leusen, C. Liang, C. C. Pantelides, P. G. Karamertzanis, S. L. Price, T. C. Lewis, H. Nowell, A. Torrisi, H. A. Scheraga, Y. A. Arnautova, M. U. Schmidt and P. Verwer, Acta Crystallogr., Sect. B: Struct. Sci., 2005, 61, 511–527 CAS.
- G. M. Day, T. G. Cooper, A. J. Cruz-Cabeza, K. E. Hejczyk, H. L. Ammon, S. X. M. Boerrigter, J. S. Tan, R. G. Della Valle, E. Venuti, J. Jose, S. R. Gadre, G. R. Desiraju, T. S. Thakur, B. P. van Eijck, J. C. Facelli, V. E. Bazterra, M. B. Ferraro, D. W. M. Hofmann, M. A. Neumann, F. J. J. Leusen, J. Kendrick, S. L. Price, A. J. Misquitta, P. G. Karamertzanis, G. W. A. Welch, H. A. Scheraga, Y. A. Arnautova, M. U. Schmidt, J. van de Streek, A. K. Wolf and B. Schweizer, Acta Crystallogr., Sect. B: Struct. Sci., 2009, 65, 107–125 CAS.
- D. A. Bardwell, C. S. Adjiman, Y. A. Arnautova, E. Bartashevich, S. X. M. Boerrigter, D. E. Braun, A. J. Cruz-Cabeza, G. M. Day, R. G. Della Valle, G. R. Desiraju, B. P. van Eijck, J. C. Facelli, M. B. Ferraro, D. Grillo, M. Habgood, D. W. M. Hofmann, F. Hofmann, K. V. J. Jose, P. G. Karamertzanis, A. V. Kazantsev, J. Kendrick, L. N. Kuleshova, F. J. J. Leusen, A. V. Maleev, A. J. Misquitta, S. Mohamed, R. J. Needs, M. A. Neumann, D. Nikylov, A. M. Orendt, R. Pal, C. C. Pantelides, C. J. Pickard, S. L. Price, H. A. Scheraga, J. van de Streek, T. S. Thakur, S. Tiwari, E. Venuti and I. K. Zhitkov, Acta Crystallogr., Sect. B: Struct. Sci., 2011, 67, 535–551 CAS.
- G. M. Day, Crystallogr. Rev., 2011, 17, 3–52 CrossRef.
- C. H. Görbitz, B. R. Dalhus and G. M. Day, Phys. Chem. Chem. Phys., 2010, 12, 8466–8477 RSC.
- H. C. S. Chan, J. Kendrick, M. A. Neumann and F. J. J. Leusen, CrystEngComm, 2013, 15, 3799 RSC.
- P. G. Karamertzanis, A. V. Kazantsev, N. Issa, G. W. Welch, C. S. Adjiman, C. C. Pantelides and S. L. Price, J. Chem. Theory Comput., 2009, 5, 1432–1448 CrossRef CAS.
- A. J. Cruz-Cabeza, S. Karki, L. Fábián, T. Friscić, G. M. Day and W. Jones, Chem. Commun., 2010, 46, 2224–2226 RSC.
- A. J. Cruz-Cabeza, G. M. Day and W. Jones, Chem.–Eur. J., 2009, 15, 13033–13040 CrossRef CAS PubMed.
- J.-B. Arlin, S. L. Price and A. J. Florence, Chem. Commun., 2011, 47, 7074–7076 RSC.
- D.-K. Bučar, G. M. Day, I. Halasz, G. G. Z. Zhang, J. R. G. Sander, D. G. Reid, L. R. MacGillivray, M. J. Duer and W. Jones, Chem. Sci., 2013, 4, 4417 RSC.
- S. L. Price, CrystEngComm, 2004, 6, 344 RSC.
- A. J. Cruz-Cabeza and J. Bernstein, Chem. Rev., 2014, 114, 2170–2191 CrossRef CAS PubMed.
- G. M. Day, W. D. S. Motherwell and W. Jones, Phys. Chem. Chem. Phys., 2007, 9, 1693–1704 RSC.
- M. A. Neumann and M.-A. Perrin, J. Phys. Chem. B, 2005, 109, 15531–15541 CrossRef CAS PubMed.
- M. D. King, T. N. Blanton, S. T. Misture and T. M. Korter, Cryst. Growth Des., 2011, 11, 5733–5740 CAS.
- T. G. Cooper, K. E. Hejczyk, W. Jones and G. M. Day, J. Chem. Theory Comput., 2008, 4, 1795–1805 CrossRef CAS.
- G. M. Day and T. G. Cooper, CrystEngComm, 2010, 12, 2443 RSC.
- A. V. Kazantsev, P. G. Karamertzanis, C. S. Adjiman and C. C. Pantelides, J. Chem. Theory Comput., 2011, 7, 1998–2016 CrossRef CAS.
- M. Vasileiadis, A. V. Kazantsev, P. G. Karamertzanis, C. S. Adjiman and C. C. Pantelides, Acta Crystallogr., Sect. B: Struct. Sci., 2012, 68, 677–685 CAS.
- M. Baias, C. M. Widdifield, J.-N. Dumez, H. P. G. Thompson, T. G. Cooper, E. Salager, S. Bassil, R. S. Stein, A. Lesage, G. M. Day and L. Emsley, Phys. Chem. Chem. Phys., 2013, 15, 8069–8080 RSC.
- T. G. Cooper, W. Jones, W. D. S. Motherwell and G. M. Day, CrystEngComm, 2007, 9, 595 RSC.
- A. V. Kazantsev, P. G. Karamertzanis, C. S. Adjiman, C. C. Pantelides, S. L. Price, P. T. A. Galek, G. M. Day and A. J. Cruz-Cabeza, Int. J. Pharm., 2011, 418, 168–178 CrossRef CAS PubMed.
- J. van de Streek and M. A. Neumann, Acta Crystallogr., Sect. B: Struct. Sci., 2010, 66, 544–558 CAS.
- C. M. Zicovich-Wilson, B. Kirtman, B. Civalleri and A. Ramírez-Solís, Phys. Chem. Chem. Phys., 2010, 12, 3289–3293 RSC.
- R. Dovesi, R. Orlando, B. Civalleri, C. Roetti, V. R. Saunders and C. M. Zicovich-Wilson, Z. Kristallogr., 2005, 220, 571–573 CrossRef CAS.
- R. Dovesi, V. R. Saunders, C. Roetti, R. Orlando, F. Pascale, B. Civalleri, K. Doll, N. M. Harrison, I. J. Bush and M. Llunell, C. Science and A. Technologies, Crystal09 2.0.1, 2013 Search PubMed.
- P. J. Stephens, F. J. Devlin, C. F. Chabalowski and M. J. Frisch, J. Phys. Chem., 1994, 98, 11623–11627 CrossRef CAS.
- A. D. Becke, J. Chem. Phys., 1993, 98, 5648 CrossRef CAS PubMed.
- B. Civalleri, C. M. Zicovich-Wilson, L. Valenzano and P. Ugliengo, CrystEngComm, 2008, 1–6 Search PubMed.
- I. Kolossváry and W. C. Guida, Biopolymers, 1996, 7863, 5011–5019 Search PubMed.
- I. Kolossváry and W. C. Guida, J. Comput. Chem., 1999, 20, 1671–1684 CrossRef.
- Schrodinger LLC, New York, NY, MacroModel, V9.0, 2011 Search PubMed.
- W. L. Jorgensen and J. Tirado-Rives, J. Am. Chem. Soc., 1988, 110, 1657–1666 CrossRef CAS.
- Materials Studio v6.10, Accelrys, 2012 Search PubMed.
- C. A. Lipinski, Drug Discovery Today: Technol., 2004, 1, 337–341 CrossRef CAS PubMed.
- F. H. Allen, Acta Crystallogr., Sect. B: Struct. Sci., 2002, 58, 380–388 CrossRef PubMed.
- E. Pidcock, W. D. S. Motherwell and J. C. Cole, Acta Crystallogr., Sect. B: Struct. Sci., 2003, 59, 634–640 Search PubMed.
- A. D. Bond, CrystEngComm, 2010, 12, 2492 RSC.
- E. Perola and P. S. Charifson, J. Med. Chem., 2004, 47, 2499–2510 CrossRef CAS PubMed.
- M. Connolly, J. Appl. Crystallogr., 1983, 16, 548–558 CrossRef CAS.
Footnote |
| † Electronic supplementary information (ESI) available: Details of crystal and molecular structure optimisations, testing of DFT settings, full details of conformational searches, calculated strain energies for all molecules, correlation between strain energy and molecular geometry changes, energy vs. surface area plots for all molecules and sublimation enthalpies of rigid hydrocarbons. See DOI: 10.1039/c4sc01132e |
| This journal is © The Royal Society of Chemistry 2014 |

