DOI:
10.1039/C4RA11301B
(Paper)
RSC Adv., 2015,
5, 2819-2826
Crystallization and dielectric properties of Fe2O3 doped barium strontium titanate borosilicate glass
Received
26th September 2014
, Accepted 21st November 2014
First published on 24th November 2014
Abstract
An attempt has been made to prepare barium strontium titanate borosilicate glasses in the system, 64[(Ba1−xSrx)·TiO3]–30[2SiO2·B2O3]–5[K2O]–1[Fe2O3] (0.4 ≤ x ≤ 1.0), using the conventional melt-quench method. The prepared glasses were characterized by differential thermal analysis, X-ray diffraction, scanning electron microscopy and impedance spectroscopy techniques. On the basis of the DTA results, the glasses were crystallized via regulated heat treatment process. The activation energy for crystallization was 818 ± 1.6 kJ mol−1. A high dielectric constant of about 107![[thin space (1/6-em)]](https://www.rsc.org/images/entities/char_2009.gif) 070 was obtained for the 6 hour heat treated glass ceramic sample. Fe2O3 plays an important role in enhancing crystallization, dielectric constant and retardation of dielectric loss in the samples.
070 was obtained for the 6 hour heat treated glass ceramic sample. Fe2O3 plays an important role in enhancing crystallization, dielectric constant and retardation of dielectric loss in the samples.
1. Introduction
Numerous studies of borosilicate glasses are important in various fields such as optoelectronics, solar energy technology, astronomical reflecting telescope and in microelectromechanical systems.1 The high density and high refractive index of these glasses make them suitable for shielding materials and laboratory glassware.2 The glasses, generally, contain both network formers and modifiers. The alkali and alkaline earth oxides are mainly used to modify the networks of glasses. The silicate network has higher chemical and thermal stability than the borate (B2O3) network.3 Alkaline earth oxides like strontium oxide (SrO) and barium oxide (BaO) improve the glass forming ability and provide good optical properties. The average molar refraction, molar polarizability, electronic polarizability of oxide ions and optical basicity increase with the replacement of SrO in the place of BaO.4 The doping of Fe2O3 in borosilicate glasses plays an important role in the network modification of a triborate unit into a tetraborate unit.5
The crystallization process is widely used in many materials to crystallize glassy or amorphous states. In the crystallization process, nucleating agents play important roles in initiating and controlling the process of crystallization.6 The controlled crystallization of glasses converts the glass into glass ceramics, which offers advantages over conventional ceramics such as finer crystallites and lower levels of porosity.7 The crystallization kinetics and nucleation mechanism of BaxSr1−xTiO3–Al2O3–SiO2,8 BaO–SrO–Nb2O5–B2O3–SiO2–CeO2,9 21BaO–21SrO–18Nb2O5–30SiO2–10B2O3,10 (1 − y)(Ba0.70Sr0.30)TiO3:y(BaO:Al2O3:2SiO2),11 (1 − y)(Ba0.70Sr0.30)TiO3–y(B2O3–xSiO2),12 and (Ba0.6Sr0.4)TiO3]–[2SiO2–B2O3]–[K2O]–La2O3 (ref. 13) have been reported. CeO2 in BaO–SrO–Nb2O5–B2O3–SiO2 reduces the activation energy of crystallization, whereas La2O3 increases the activation energy.
The recent demand to increase the energy storage capability and reliability of capacitors is necessary for future application prospects. In recent years, significant efforts have been made to develop high constant dielectric materials, which are capable of a high energy storage density.14,15 Among all glass ceramic materials investigated, barium strontium titanate (BST) glass ceramics has been found to be a promising candidate for high energy storage.16 BST glass ceramics are currently fabricated mainly in presence of borosilicate and aluminosilicate network forming systems with certain dopants such as CeO2, La2O3 and Nb2O5.17 To the best of our knowledge, no one has attempted to study crystallization kinetics and dielectric behaviour of Fe2O3 doped BST borosilicate glass. In the present article, we report the crystallization and dielectric properties of BST borosilicate glass in the glass system, 64[(Ba1−xSrx)TiO3]–30[2SiO2–B2O3]–5[K2O]–1[Fe2O3].
2. Experimental procedure
Barium strontium titanate borosilicate glasses were prepared in four basic compositions by varying the Ba/Sr ratio using BaCO3 (99%), SrCO3 (99%), TiO2 (99%), SiO2 (99.5%), H3BO3 (99.8%), K2CO3 (99.9%) and Fe2O3 (99.9%) Himedia, India. An appropriate amount of ingredients were melted at 1200 °C into a high-grade alumina crucible in the open air using a programmable electric furnace. The melt was quenched at room temperature in an aluminium mould and immediately transferred to a preheated programmable muffle furnace for annealing at 450 °C for 3 hours to remove the internal residual stresses produced due to the temperature gradient during rapid cooling.
Differential thermal analysis (DTA) was carried out on the coarse powdered glass samples at heating rates of 5, 10, 15 and 20 °C min−1. On the basis of the DTA results, the glass samples were subjected to regulated heat treatment schedules for crystallization. X-ray diffraction (XRD) of the glass and glass ceramic samples was carried out on a Rigaku Miniflex-II X-ray diffractometer using Cu-Kα radiation. SEM images of well-polished glass and glass ceramic samples were taken by a scanning electron microscope (model LEO 430 Camridge Instruments Ltd. U. K.). The dielectric/impedance spectroscopic measurements were taken using Wayne Kerr 6500 P (high frequency LCR Meter, Frequency: 20–5 MHz) over the temperature range of 0 to 150 °C of both side electrode glass ceramic samples over the frequency range from 20 Hz to 100 kHz.
3. Results and discussion
The nomenclature of the prepared glass samples was as follows: BST5K1F0.4, where BST refers to (Ba, Sr)TiO3 borosilicate, 5 K designates 5% of K2O, F indicates Fe2O3 and 0.4 represents the content of SrO. The nomenclature of the glass ceramic samples followed the parent glass sample code, e.g. BST5K1F0.4T844. Here, the letter T refers to the soaking time of crystallization of 3 hours and the last three number digits denote the crystallization temperature of the glass. The nomenclature of the BST borosilicate glass and glass ceramic samples are listed in Table 1.
Table 1 Nomenclature of the glass and glass ceramic samples
| Composition (x) |
Glass sample code |
Holding time (hours) |
Holding temp. (°C) |
Glass ceramic sample code |
| 0.4 |
BST5K1F0.4 |
3 |
844 |
BST5K1F0.4T844 |
| 6 |
844 |
BST5K1F0.4S844 |
| 0.6 |
BST5K1F0.6 |
6 |
878 |
BST5K1F0.6S878 |
| 0.8 |
BST5K1F0.8 |
6 |
860 |
BST5K1F0.8S860 |
| 1.0 |
ST5K1F1.0 |
6 |
872 |
ST5K1F1.0S872 |
3.1. Structure and morphology of glass
The XRD pattern of a glass sample BST5K1F0.4 is shown in Fig. 1(a). Only single diffusive broad peak was observed in the pattern. This shows the short-range ordering of the borate and silicate network structures in the glass, which is characteristic of an amorphous phase. This result was confirmed by the SEM image in Fig. 1(b) by absence any crystallites on the surface of the glass sample. No grain or grain-boundary was detected in the SEM image.
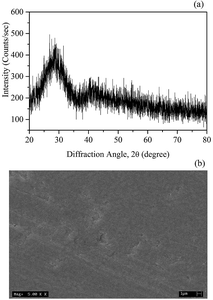 |
| | Fig. 1 (a) X-ray diffraction pattern and (b) SEM image of the glass sample BST5K1F0.4. | |
3.2. Crystallization kinetics
The crystallization kinetics of BST borosilicate glasses were studied by DTA. The DTA pattern of the glass sample BST5K1F0.4 is shown in Fig. 2. The pattern indicates the evolution of the crystallization exotherm dependence on the heating rate. The crystallization temperature, Tcry, of glass increased with increasing heating rate (φ) of DTA. The intensity of the peak also increased with increasing heating rate. This indicates the activation controlled crystallization of glassy matrix, and the heating rate and crystallization temperatures are listed in Table 2.
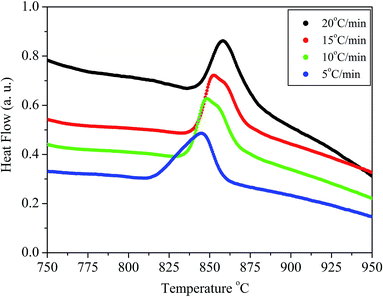 |
| | Fig. 2 DTA patterns of the glass sample BST5K1F0.4 for heating rates 5, 10, 15 and 20 °C min−1. | |
Table 2 Heating rate, crystallization temperatures (Tcry) and crystal growth dimension of glass sample BST5K1F0.4
| φ |
Tcry (K) |
ΔTFWHM |
n |
| 5 |
1117 |
23.92 |
1.36 |
| 10 |
1121 |
19.71 |
1.63 |
| 15 |
1125 |
20.40 |
1.56 |
| 20 |
1131 |
16.18 |
1.96 |
The method reported by Kissinger18 was used to determine the kinetic parameters associated with the crystallization of the BST phase. The Kissinger equation is given as follows:
| |
 | (1) |
where
φ is the heating rate,
Ea is the activation energy of crystallization,
R is the universal gas constant,
A is the pre-exponential frequency factor and
Tcry is the crystallization temperature. The slope of this plot between ln(
φ/
Tcry2) and 1/
Tcry (
Fig. 3) gives −
Ea/
R. The activation energy,
Ea, for crystallization of BST was determined from the slope and was found to be 818 ± 1.6 kJ mol
−1. This value is higher than that reported for BST borosilicate glass (705 kJ mol
−1)
12 and BST borosilicate glass doped with 1 mol% of La
2O
3 (762 kJ mol
−1).
13 This result indicates the sluggish crystallization of the glassy matrix. The observed activation energy was also higher than the dissociation energies of the B–O bonds (515 kJ mol
−1)
19 and Si–O bonds (424 kJ mol
−1).
8 Therefore, the networks of borate and silicate were modified by the addition of 1 mol% Fe
2O
3. Thus, Fe
2O
3 acts as a network modifier and nucleating agent for crystallization.
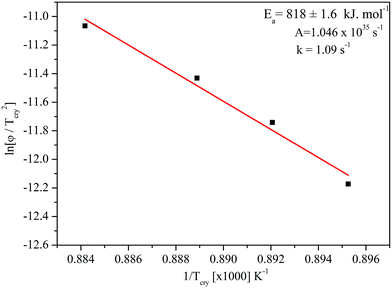 |
| | Fig. 3 Plot of ln(φ/Tcry2) versus 1/Tcry. | |
The possibility of the diffusion of ions, such as Ba2+ (175 kJ mol−1), Sr2+ (165–255 kJ mol−1) in the glass, was also ruled out because the activation energies needed for the diffusivity are much lower than the obtained values. This confirms that grain growth is controlled by interface kinetics, and not diffusion. The pre-exponential frequency factor, A, and reaction rate constant, k, were determined by the Arrhenius equation (k = Ae−Ea/RT). The values at 844 °C were found to be 1.046 × 1035 s−1 and 1.09 s−1, respectively. The reaction rate constant indicates the normal rate of the crystallization in the glass matrix due to 1 mol% doping of Fe2O3. A non-systematic variation of ΔTFWHM corresponding to the scanning rate of the DTA measurement shows that the contribution of surface and volume crystallization in BST glass ceramics is independent of the scanning rate. The non-systematic variation was also observed by Liu et al.10 The dominant nucleation mechanism, as determined by peak profile analysis of crystallization exotherms (as represented by eqn (2)),20 shows the simultaneous surface and volume crystallization occurring in BST glass ceramics because the crystal growth dimension ‘n’ was between 1.36–1.96.11,21 The ‘n’ can be determined by the following relation:11
| |
 | (2) |
where Δ
TFWHM is the full width at half maximum of the crystallization peak.
The DTA patterns of the remaining BST borosilicate glass samples are shown in Fig. 4(a)–(c). The DTA results were explored over the temperature range of 100–1050 °C. Above this temperature, melting of glasses began. For all the glass samples, there was a shift in the baseline within the temperature range of 641–672 °C, depending on the composition. The shift in the baseline represents a change in the specific heat attributed to the glass transition temperature, Tg. The glass transition temperature, Tg, of the different glass samples are listed in Table 3. The glass transition temperature, Tg, of the glassy matrix increased with increasing concentration of SrO. The increase in Tg is related to the increase of the viscosity of the melt with increasing concentration of SrO in the glass melt.32,33 The glass transition temperatures were found to lie between 641 and 672 °C. In all glass samples, there was only one exothermic peak, which corresponds to the crystallization of glass into glass ceramic and is known as the crystallization temperature (Tcry). In the glass samples, BST5K1F0.8 and ST5K1F01.0, the exothermic peak was sharp in comparison to BST5K1F0.4 and Tcry increased with increasing concentration of SrO. The stabilization temperature, ΔT, decreased with increasing SrO content. This suggests that the substitution of SrO promotes the formation of the required crystalline phase.22
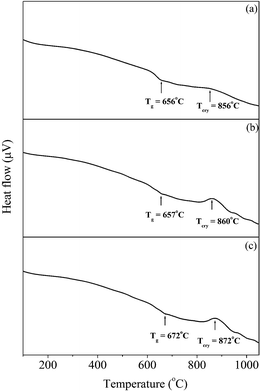 |
| | Fig. 4 DTA patterns of the glass samples (a) BST5K1F0.6, (b) BST5K1F0.8 and (c) ST5K1F1.0. | |
Table 3 Glass transition temperature, Tg and crystallization temperature Tcry of the BST borosilicate glass samples
| Glass sample code |
DTA Peaks (°C) |
ΔT = Tcry − Tg (°C) |
| Tg |
Tcry |
| BST5K1F0.6 |
641 |
878 |
237 |
| BST5K1F0.8 |
657 |
860 |
203 |
| ST5K1F1.0 |
672 |
872 |
200 |
3.3. X-ray diffraction
The glass sample BST5K1F0.4 was crystallized for heat treatment schedules of 3 and 6 hours with a heating rate of 5 °C min−1 at 844 °C. The crystallized samples are named as BST5K1F0.4T844 and BST5K1F0.4S844. The XRD pattern of these samples are shown in Fig. 5. The pattern was indexed to standard JCPDS data file nos 13-0522 (Ba1.91Sr0.09TiO4) and 84-0923 (Ba2TiSi2O8). Fig. 5(a) presents the XRD pattern of the glass ceramic sample, BST5K1F0.4T844. The glass sample crystallized in the major phase of Ba1.91Sr0.09TiO4 along with a secondary phase, Ba2TiSi2O8 (BTS). The major crystalline phase had an orthorhombic structure. The XRD pattern of the 6 hour heat treated glass ceramic sample was similar to that of the 3 hour heat treated sample, and only a slight difference in nucleation and growth was observed. The amount of secondary phase formation in BST5K1F0.4S844 was less than that in BST5K1F0.4T844. This was confirmed in the microstructural studies. The crystallite size was estimated by the Williamson and Hall (WH) plot (inset Fig. 5) as well as the Debye–Scherer method. The crystallite sizes of these two samples were 41.7 nm, 42.8 nm and 44.0 nm 46.7 nm, as determined by the Debye–Scherrer method and (WH) plot, respectively. The lattice parameters were determined to be a = 6.19 Å, b = 10.54 Å, c = 7.64 Å and a = 6.17 Å, b = 10.50 Å, c = 7.66 Å, respectively, for the 3 hour and 6 hour heat treated samples. These values are well matched with the already reported results.23
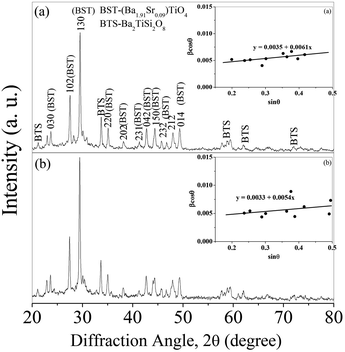 |
| | Fig. 5 X-ray diffraction patterns of the glass ceramic samples (a) BST5K1F0.4T844 and (b) BST5K1F0.4S844, inset (a) and (b) their Williamson and Hall (WH) plots. | |
The XRD patterns of the glass ceramic samples BST5K1F0.6S878, BST5K1F0.8S860 and ST5K1F1.0S872 are shown in Fig. 6(a)–(c). These XRD patterns of the glass ceramic samples, crystallized over the 6 hour heat treatment schedule because the crystallization was found better in the 6 hour heat treated samples. The XRD pattern of BST5K1F0.6S878 was of similar to that of BST5K1F0.4S844. The XRD patterns of BST5K1F0.8S860 and ST5K1F1.0T872 show the major crystalline phase of SrTiO3, ST (JCPDS file no. 73-0661) along with secondary phase formation of Sr2B2O5, SB (JCPDS file no. 89-4488). The d-values corresponding to the XRD peaks were well matched with the standard cubic perovskite SrTiO3 crystalline phase. The crystallite sizes and strain broadening are listed in Table 4. A negative sign indicates compressive strain, whereas a positive sign represents tensile strain. The lattice parameters of the major crystalline phase were also similar to reported results and are listed in Table 4.24,25
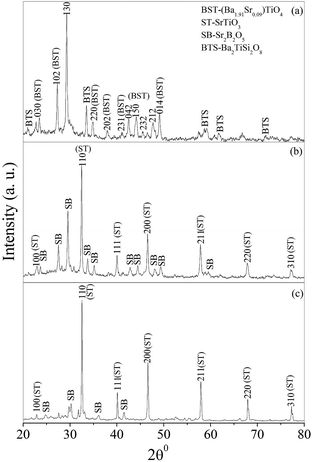 |
| | Fig. 6 X-ray diffraction patterns of glass ceramic samples (a) BST5K1F0.6S878, (b) BST5K1F0.8S860 and (c) ST5K1F1.0S872. | |
Table 4 Major crystalline phase, crystal structure, lattice parameters and crystallite size in the different barium strontium titanate glass ceramic samples
| Glass ceramic sample code |
Major crystalline phase |
Crystal structure |
Lattice parameters (Å) |
Crystallite size (Å) |
Strain (×10−4) |
| a |
b |
c |
tDS |
tWH |
| BST5K1F0.4T844 |
Ba1.91Sr0.09TiO4 |
Orthorhombic |
6.19 |
10.54 |
7.64 |
417 |
440 |
30.5 |
| BST5K1F0.5S844 |
Ba1.91Sr0.09TiO4 |
Orthorhombic |
6.17 |
10.50 |
7.66 |
428 |
467 |
27.0 |
| BST5K1F0.6S878 |
Ba1.91Sr0.09TiO4 |
Orthorhombic |
6.11 |
10.51 |
7.64 |
363 |
481 |
28.5 |
| BST5K1F0.8S860 |
SrTiO3 |
Cubic |
3.93 |
3.93 |
3.93 |
463 |
405 |
−15.0 |
| ST5K1F1.0S872 |
SrTiO3 |
Cubic |
3.95 |
3.95 |
3.95 |
547 |
435 |
−8.0 |
3.4. Microstructural behavior
The microstructure of BST glass does not show any grains, as indicated in Fig. 1(b). When the glass sample was heat treated, nucleation was first started in the form of crystal grains in the glassy matrix. After nucleation, grain growth took place and nearby grains touched each other. Fig. 7(a) and (b) depicts the scanning electron micrographs of BST5K1F0.4T844, and BST5K1F0.4S844. A dendritic microstructure with nonuniform grain growth26 was observed in the 3 hour heat treated sample BST5K1F0.4T844 (Fig. 7(a)), whereas 6 hours heat treatment played an important role in reducing the secondary phase and making a uniform structure. The separation between the grains arises due to a reduction of the secondary phase. The dendritic structure of the crystalline phase is generally formed in diffusion limited cases as a way of preventing any material excluded from the crystal from reducing the growth rates.6 The systematic grains growth is completed in four steps, as shown in Fig. 8. The glass has a smooth amorphous microstructure and there are no crystallites present. During the crystallization of glasses, first, a few nuclei (crystal grains) are formed randomly in the glassy matrix, and then these grains are likely to grow in some particular direction and form a dendritic microstructure.27 Finally, the grains of major crystalline phase and secondary phase begin overlapping. Secondary grain growth was observed in the 6 hour heat treated glass ceramic sample. This may be occur after complete growth when the crystal surface area no longer increases but decreases, as observed in Fig. 7(b). The surface crystal growth is closely related to surface nucleation.6
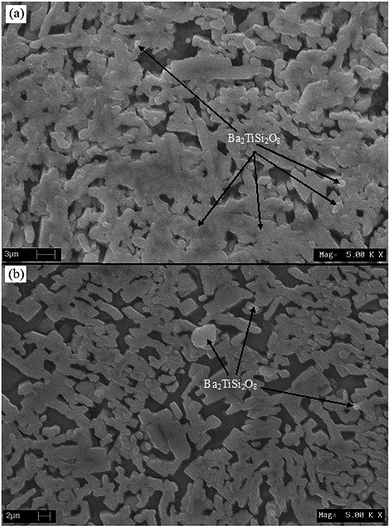 |
| | Fig. 7 Scanning electron micrographs of the glass ceramic sample (a) BST5K1F0.4T844 and (b) BST5K1F0.4S844. | |
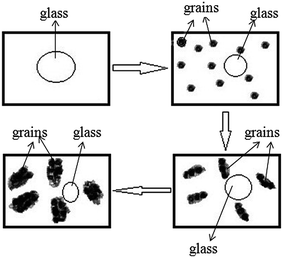 |
| | Fig. 8 Systematic sketch map of the crystallization process for the BST5K1F0.4T844 sample. | |
Fig. 9(a)–(c) depict the SEM images of the samples BST5K1F0.6S878, BST5K1F0.8S860 and ST5K1F1.0S872. The micrograph of BST5K1F0.6S878 shows well developed randomly distributed grains in the glassy matrix. The microstructure of this sample was similar to that of the BST5K1F0.4T844. The surface morphology of BST5K1F0.8T860 shows a clear and randomly distributed dendritic structure. The microstructure of the glass ceramic sample, ST5K1F1.0T872, shows the interconnected grains of perovskite SrTiO3. A secondary phase, Sr2B2O5, was clearly observed in the form of whitish grains (Fig. 9(c)). In this micrograph, some pores were also present. This type of structure was found to be very useful in gas and humidity sensing, because gases or moisture are absorbed by the surface pores, which changes the resistivity of the material.28
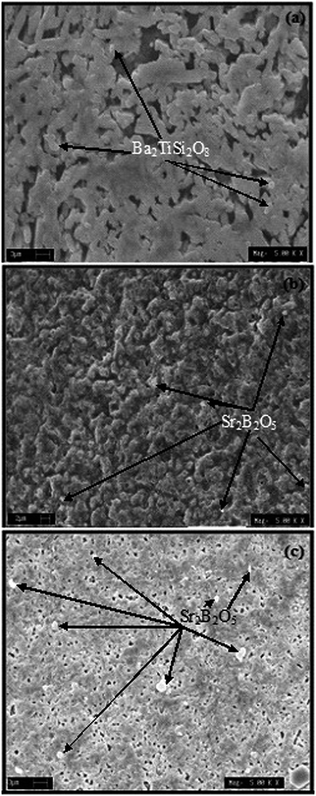 |
| | Fig. 9 Scanning electron micrographs of the glass ceramic samples (a) BST5K1F0.6S878, (b) BST5K1F0.8S860 and (c) ST5K1F1.0S872. | |
3.5. Dielectric behaviour
The variation of the dielectric constant, εr, and dissipation factor, tan![[thin space (1/6-em)]](https://www.rsc.org/images/entities/char_2009.gif) δ, with temperature at few selected frequencies (20, 100 Hz, 1, 10 and 100 kHz) for glass ceramic samples BST5K1F0.4T844 and BST5K1F0.4S844 are shown in Fig. 10 and 11. The dielectric constant increases with increasing temperature at all frequencies up to a particular temperature, known as the Curie temperature, and decreases gradually thereafter with increasing temperature. The dielectric constant was found to be a maximum at a frequency of 20 Hz. At higher frequencies, the dielectric constant decreased due to a reduction of the net polarisation. This can be explained by the Maxwell–Wagner model of the dielectric constant.34 The dielectric loss for BST5K1F0.4T844 was almost independent of temperature (Fig. 10). The dielectric behaviour of the glass ceramics was observed to be independent of the heat treatment process of glass but a difference in the dielectric constant and dielectric loss was found in these two samples. The peak value of dielectric constant for these samples was observed to be 24
δ, with temperature at few selected frequencies (20, 100 Hz, 1, 10 and 100 kHz) for glass ceramic samples BST5K1F0.4T844 and BST5K1F0.4S844 are shown in Fig. 10 and 11. The dielectric constant increases with increasing temperature at all frequencies up to a particular temperature, known as the Curie temperature, and decreases gradually thereafter with increasing temperature. The dielectric constant was found to be a maximum at a frequency of 20 Hz. At higher frequencies, the dielectric constant decreased due to a reduction of the net polarisation. This can be explained by the Maxwell–Wagner model of the dielectric constant.34 The dielectric loss for BST5K1F0.4T844 was almost independent of temperature (Fig. 10). The dielectric behaviour of the glass ceramics was observed to be independent of the heat treatment process of glass but a difference in the dielectric constant and dielectric loss was found in these two samples. The peak value of dielectric constant for these samples was observed to be 24![[thin space (1/6-em)]](https://www.rsc.org/images/entities/char_2009.gif) 250 and 107
250 and 107![[thin space (1/6-em)]](https://www.rsc.org/images/entities/char_2009.gif) 070, respectively. The higher dielectric constant in the 6 hour heat treated sample, BST5K1F0.4S844, was also supported by XRD and SEM. The addition of 1 mol% Fe2O3 to the BST glass promotes crystallization, as discussed earlier in the crystallization kinetics. The Fe3+ ions present in the glassy network are diffused into the crystalline BST at higher temperatures, which make the glass ceramic samples semiconducting. SEM showed that the grains of BST5K1F0.4S844 are well separated by grain boundary in the glassy matrix. Hence, a large conductivity difference is introduced between the semiconducting grains and insulating grain-boundary. The conductivity difference is responsible for space charge polarization and hence the high dielectric constant.17,29 This peak value (εr = 107
070, respectively. The higher dielectric constant in the 6 hour heat treated sample, BST5K1F0.4S844, was also supported by XRD and SEM. The addition of 1 mol% Fe2O3 to the BST glass promotes crystallization, as discussed earlier in the crystallization kinetics. The Fe3+ ions present in the glassy network are diffused into the crystalline BST at higher temperatures, which make the glass ceramic samples semiconducting. SEM showed that the grains of BST5K1F0.4S844 are well separated by grain boundary in the glassy matrix. Hence, a large conductivity difference is introduced between the semiconducting grains and insulating grain-boundary. The conductivity difference is responsible for space charge polarization and hence the high dielectric constant.17,29 This peak value (εr = 107![[thin space (1/6-em)]](https://www.rsc.org/images/entities/char_2009.gif) 070) of the dielectric constant was higher than that reported for La2O3 doped BST glass ceramics.16
070) of the dielectric constant was higher than that reported for La2O3 doped BST glass ceramics.16
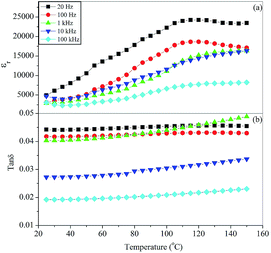 |
| | Fig. 10 Variation of (a) dielectric constant, εr, and (b) dissipation factor, tan![[thin space (1/6-em)]](https://www.rsc.org/images/entities/char_2009.gif) δ, with temperature at different frequencies for the glass ceramic sample BST5K1F0.4T844. δ, with temperature at different frequencies for the glass ceramic sample BST5K1F0.4T844. | |
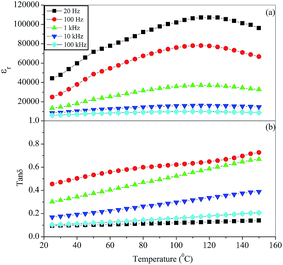 |
| | Fig. 11 Variation of (a) dielectric constant, εr, and (b) dissipation factor, tan![[thin space (1/6-em)]](https://www.rsc.org/images/entities/char_2009.gif) δ, with temperature at different frequencies for the glass ceramic sample BST5K1F0.4S844. δ, with temperature at different frequencies for the glass ceramic sample BST5K1F0.4S844. | |
The variation of the dielectric constant, εr, and dissipation factor, tan![[thin space (1/6-em)]](https://www.rsc.org/images/entities/char_2009.gif) δ, with temperature at few selected frequencies (20, 100 Hz, 1, 10 and 100 kHz) for the BST5K1F0.6S878, BST5K1F0.8S860 and ST5K1F1.0S872 samples, which were crystallized using the 6 hour heat treatment schedules, are shown in Fig. 12, 13 and 14. Fig. 12(a) and (b) depicts the dielectric behaviour of the glass ceramic sample BST5K1F0.6S878. The pattern shows that the dielectric constant increases gradually at 20 and 100 Hz with increasing temperature, and remains invariant at other frequencies. The dielectric loss also increased gradually with increasing temperature. The peak dielectric constant at 20 Hz was 9590. The dielectric constant for the BST5K1F0.8S860 sample was invariant up to 120 °C at lower frequencies and was independent of temperature at 10 and 100 kHz (Fig. 13). Similar behavior in the glass ceramic sample, ST5K1F1.0S872, was also observed. The dielectric constant and loss were not influenced significantly in the glass ceramic samples BST5K1F0.8S860 and ST5K1F1.0S872. The dielectric constant was strongly dependent on the composition, and decreased with the addition of SrO in place of BaO in the glassy matrix. The dielectric constant in the strontium rich sample was 3220, which was higher than the values reported for the CoO and La2O3 doped strontium borosilicate glass ceramics.17 This also supports the previous discussion in this section. The peak dielectric constants are listed in Table 5. The dielectric loss was found to be very low in this glass ceramic system. The low dielectric loss was attributed to the addition of Fe3+ ions in the glassy matrix, which have smaller ionic radii than that of Ti4+ ions. Fe3+ ions acts as acceptor ions and are very useful in reducing Ti4+ ions. Fe3+ ions may even substitute for Ti4+ sites and prevent the reduction of Ti4+ to Ti3+ by neutralizing the donor action of the oxygen vacancies, causing a decrease in the dielectric loss.30,31
δ, with temperature at few selected frequencies (20, 100 Hz, 1, 10 and 100 kHz) for the BST5K1F0.6S878, BST5K1F0.8S860 and ST5K1F1.0S872 samples, which were crystallized using the 6 hour heat treatment schedules, are shown in Fig. 12, 13 and 14. Fig. 12(a) and (b) depicts the dielectric behaviour of the glass ceramic sample BST5K1F0.6S878. The pattern shows that the dielectric constant increases gradually at 20 and 100 Hz with increasing temperature, and remains invariant at other frequencies. The dielectric loss also increased gradually with increasing temperature. The peak dielectric constant at 20 Hz was 9590. The dielectric constant for the BST5K1F0.8S860 sample was invariant up to 120 °C at lower frequencies and was independent of temperature at 10 and 100 kHz (Fig. 13). Similar behavior in the glass ceramic sample, ST5K1F1.0S872, was also observed. The dielectric constant and loss were not influenced significantly in the glass ceramic samples BST5K1F0.8S860 and ST5K1F1.0S872. The dielectric constant was strongly dependent on the composition, and decreased with the addition of SrO in place of BaO in the glassy matrix. The dielectric constant in the strontium rich sample was 3220, which was higher than the values reported for the CoO and La2O3 doped strontium borosilicate glass ceramics.17 This also supports the previous discussion in this section. The peak dielectric constants are listed in Table 5. The dielectric loss was found to be very low in this glass ceramic system. The low dielectric loss was attributed to the addition of Fe3+ ions in the glassy matrix, which have smaller ionic radii than that of Ti4+ ions. Fe3+ ions acts as acceptor ions and are very useful in reducing Ti4+ ions. Fe3+ ions may even substitute for Ti4+ sites and prevent the reduction of Ti4+ to Ti3+ by neutralizing the donor action of the oxygen vacancies, causing a decrease in the dielectric loss.30,31
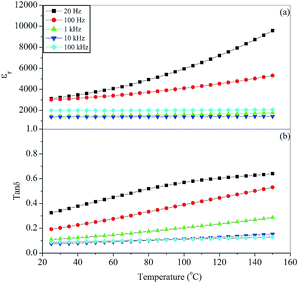 |
| | Fig. 12 Variation of (a) dielectric constant, εr, and (b) dissipation factor, tan![[thin space (1/6-em)]](https://www.rsc.org/images/entities/char_2009.gif) δ, with temperature at different frequencies for the glass ceramic sample BST5K1F0.6S878. δ, with temperature at different frequencies for the glass ceramic sample BST5K1F0.6S878. | |
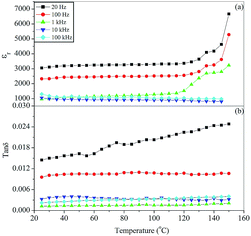 |
| | Fig. 13 Variation of (a) dielectric constant, εr, and (b) dissipation factor, tan![[thin space (1/6-em)]](https://www.rsc.org/images/entities/char_2009.gif) δ, with temperature at different frequencies for the glass ceramic sample BST5K1F0.8S860. δ, with temperature at different frequencies for the glass ceramic sample BST5K1F0.8S860. | |
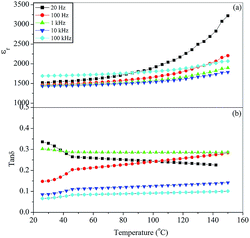 |
| | Fig. 14 Variation of (a) dielectric constant, εr, and (b) dissipation factor, tan![[thin space (1/6-em)]](https://www.rsc.org/images/entities/char_2009.gif) δ, with temperature at different frequencies for the glass ceramic sample ST5K1F1.0S872. δ, with temperature at different frequencies for the glass ceramic sample ST5K1F1.0S872. | |
Table 5 Dielectric constant of various glass ceramic samples in the system 64[(Ba1−xSrx)TiO3]–30[2SiO2·B2O3]–5[K2O]–1[Fe2O3]
| Glass ceramic sample code |
Maximum value of dielectric constant, εr |
| 20 Hz |
100 Hz |
1 kHz |
10 kHz |
100 kHz |
| BST5K1F0.4T844 |
24![[thin space (1/6-em)]](https://www.rsc.org/images/entities/char_2009.gif) 250 250 |
18![[thin space (1/6-em)]](https://www.rsc.org/images/entities/char_2009.gif) 654 654 |
16![[thin space (1/6-em)]](https://www.rsc.org/images/entities/char_2009.gif) 334 334 |
16![[thin space (1/6-em)]](https://www.rsc.org/images/entities/char_2009.gif) 327 327 |
8222 |
| BST5K1F0.4S844 |
107![[thin space (1/6-em)]](https://www.rsc.org/images/entities/char_2009.gif) 070 070 |
78![[thin space (1/6-em)]](https://www.rsc.org/images/entities/char_2009.gif) 129 129 |
37![[thin space (1/6-em)]](https://www.rsc.org/images/entities/char_2009.gif) 061 061 |
16![[thin space (1/6-em)]](https://www.rsc.org/images/entities/char_2009.gif) 294 294 |
10![[thin space (1/6-em)]](https://www.rsc.org/images/entities/char_2009.gif) 021 021 |
| BST5K1F0.6S878 |
9590 |
5313 |
1742 |
1425 |
2059 |
| BST5K1F0.8S860 |
6664 |
5285 |
3228 |
1053 |
1307 |
| ST5K1F1.0S872 |
3220 |
2206 |
1897 |
1786 |
2068 |
4. Conclusions
A series of barium strontium titanate borosilicate glasses with the addition of Fe2O3 were prepared by the conventional melt-quench method. Kinetic studies showed that simultaneous surface and internal volume nucleation occur in the glass matrix. The activation energy for crystallization was observed to be 818 ± 1.6 kJ mol−1. A high dielectric constant of about 107![[thin space (1/6-em)]](https://www.rsc.org/images/entities/char_2009.gif) 070 was found in a 6 hour heat treated glass ceramic sample. The high dielectric constant was due to space charge polarization, which was attributed to the conductivity difference between the semiconducting grains and the insulating grain-boundary in the glass matrix. Fe2O3 plays an important role as a nucleating agent, and it enhances the activation energy; moreover, it reduces the dielectric loss in the samples.
070 was found in a 6 hour heat treated glass ceramic sample. The high dielectric constant was due to space charge polarization, which was attributed to the conductivity difference between the semiconducting grains and the insulating grain-boundary in the glass matrix. Fe2O3 plays an important role as a nucleating agent, and it enhances the activation energy; moreover, it reduces the dielectric loss in the samples.
Acknowledgements
The authors gratefully acknowledge the University Grant Commission (UGC), New Delhi, (India) for financial support under Major Research Project F. no. 37-439/2009 (SR).
References
- T. G. V. M. Rao, A. R. Kumar, K. Neeraja, N. Veeraiah and M. Rami Reddy, J. Alloys Compd., 2013, 557, 209–217 CrossRef CAS PubMed.
- R. Martens and W. Muller-Warmuth, J. Non-Cryst. Solids, 2000, 265, 167–175 CrossRef CAS.
- G. Kaur, O. P. Pandey and K. Singh, J. Non-Cryst. Solids, 2012, 358, 2589–2596 CrossRef CAS PubMed.
- S. Lakshimi, S. Rao, G. Ramadevudu, M. Shareefuddin, A. Hameed, N. M. Chary and M. L. Rao, Int. Trans. J. Eng., Manage., Appl. Sci. Technol., 2012, 4, 25–35 Search PubMed.
- A. K. Yadav and C. R. Gautam, Spectrosc. Lett., 2014 Search PubMed (in press).
- N. Karpukhina, R. G. Hill and R. V. Law, Chem. Soc. Rev., 2014, 43, 2174–2186 RSC.
- A. K. Yadav and C. R. Gautam, Adv. Appl. Ceram., 2014, 113, 193–204 CrossRef PubMed.
- J. Chen, Y. Zhang, C. Deng and X. Dai, Mater. Chem. Phys., 2010, 121, 109–113 CrossRef CAS PubMed.
- T. Y. Liu, G. H. Chen, J. Song and C. L. Yuan, Ceram. Int., 2013, 39, 5553–5559 CrossRef CAS PubMed.
- T. Y. Liu, G. H. Chen, J. Song and C. L. Yuan, Trans. Nonferrous Met. Soc. China, 2014, 24, 729–735 CrossRef CAS.
- P. V. Divya, G. Vignesh and V. Kumar, J. Phys. D: Appl. Phys., 2014, 40, 7804–7810 CrossRef.
- P. V. Divya and V. Kumar, J. Am. Ceram. Soc., 2007, 90, 472–476 CrossRef CAS PubMed.
- A. K. Yadav, C. R. Gautam and P. Singh, New J. Glass Ceram., 2012, 2, 126–131 CrossRef CAS.
- Q. Tan, P. Irwin and Y. Cao, IEEJ Transactions on Fundamentals and Materials, 2006, 126, 1153–1159 CrossRef.
- M. J. Pan and C. A. Randall, IEEE Electr. Insul. Mag., 2010, 26, 44–50 CrossRef.
- Y. Zhang, T. Ma, X. Wang, Z. Yuan and Q. Zhang, J. Appl. Phys., 2011, 109, 084115 CrossRef PubMed.
- A. K. Yadav and C. R. Gautam, J. Mater. Sci.: Mater. Electron., 2014, 25, 5165–5187 CrossRef CAS.
- H. E. Kissinger, J. Res. Natl. Bur. Stand., 1956, 57, 217–221 CrossRef CAS.
- Y. Zeng, X. Qin, S. Jiang, G. Zhang and L. Zhang, J. Am. Ceram. Soc., 2011, 94, 469–473 CrossRef CAS PubMed.
- J. A. Augis and J. E. Bennet, J. Therm. Anal., 1978, 13, 283–292 CrossRef CAS.
- E. P. Gorzkowski, M. J. Pan, B. A. Bender and C. C. M. Wu, J. Am. Ceram. Soc., 2008, 91, 1065–1069 CrossRef CAS PubMed.
- X. Wang, Y. Zhang, J. Zhu, X. Song, R. Lvc, J. Liuc and M. Zhang, Ceram. Int., 2014 Search PubMed (in press).
- W. Kwestroo and H. A. M. Paping, J. Am. Ceram. Soc., 1959, 42, 292–299 CrossRef CAS PubMed.
- S. A. Markgraf, A. Halliyal, A. S. Bhalla, R. E. Newnham and C. T. Prewitt, Ferroelectrics, 1985, 62, 17–26 CrossRef CAS.
- G. M. Meyer, R. J. Nelmes and J. Hutton, Ferroelectrics, 1978, 21, 461–462 CrossRef.
- J. Chen, Y. Zhang, C. Deng, X. Dai and L. Li, J. Am. Ceram. Soc., 2009, 92, 1350–1353 CrossRef CAS PubMed.
- W. Zhang, S. Xue, S. Liu, J. Wang, B. Shen and J. Zhai, J. Alloys Compd., 2014, 617, 740–745 CrossRef CAS PubMed.
- O. Lupan, V. Cretu, M. Deng, D. Gedamu, I. Paulowicz, S. Kaps, Y. K. Mishra, O. Polonskyi, C. Zamponi, L. Kienle, V. Trofim, I. Tiginyanu and R. Adelung, J. Phys. Chem. C, 2014, 118, 15068–15078 CAS.
- D. Kumar, C. R. Gautam and O. Parkash, Appl. Phys. Lett., 2006, 89, 112911 CrossRef PubMed.
- S. B. Herner, F. A. Selmi, V. V. Varadan and V. K. Varadan, Mater. Lett., 1993, 15, 317–324 CrossRef CAS.
- X. Liang, Z. Meng and W. Wu, J. Am. Ceram. Soc., 2004, 87, 2218–2222 CAS.
- C. R. Gautam, D. Kumar and O. Parkash, Adv. Mater. Sci. Eng., 2011, 2011, 1–11 Search PubMed.
- A. Bahrami, Z. Ali Nemati, P. Alizadeh and M. Bolandi, J. Mater. Process. Technol., 2008, 206, 126–131 CrossRef CAS PubMed.
- G. Catalan, D. O. Neill, R. M. Bowman and J. M. Gregg, Appl. Phys. Lett., 2000, 77, 3078–3080 CrossRef CAS PubMed.
|
| This journal is © The Royal Society of Chemistry 2015 |
Click here to see how this site uses Cookies. View our privacy policy here. ![[thin space (1/6-em)]](https://www.rsc.org/images/entities/char_2009.gif) 070 was obtained for the 6 hour heat treated glass ceramic sample. Fe2O3 plays an important role in enhancing crystallization, dielectric constant and retardation of dielectric loss in the samples.
070 was obtained for the 6 hour heat treated glass ceramic sample. Fe2O3 plays an important role in enhancing crystallization, dielectric constant and retardation of dielectric loss in the samples.


![[thin space (1/6-em)]](https://www.rsc.org/images/entities/char_2009.gif) δ, with temperature at few selected frequencies (20, 100 Hz, 1, 10 and 100 kHz) for glass ceramic samples BST5K1F0.4T844 and BST5K1F0.4S844 are shown in Fig. 10 and 11. The dielectric constant increases with increasing temperature at all frequencies up to a particular temperature, known as the Curie temperature, and decreases gradually thereafter with increasing temperature. The dielectric constant was found to be a maximum at a frequency of 20 Hz. At higher frequencies, the dielectric constant decreased due to a reduction of the net polarisation. This can be explained by the Maxwell–Wagner model of the dielectric constant.34 The dielectric loss for BST5K1F0.4T844 was almost independent of temperature (Fig. 10). The dielectric behaviour of the glass ceramics was observed to be independent of the heat treatment process of glass but a difference in the dielectric constant and dielectric loss was found in these two samples. The peak value of dielectric constant for these samples was observed to be 24
δ, with temperature at few selected frequencies (20, 100 Hz, 1, 10 and 100 kHz) for glass ceramic samples BST5K1F0.4T844 and BST5K1F0.4S844 are shown in Fig. 10 and 11. The dielectric constant increases with increasing temperature at all frequencies up to a particular temperature, known as the Curie temperature, and decreases gradually thereafter with increasing temperature. The dielectric constant was found to be a maximum at a frequency of 20 Hz. At higher frequencies, the dielectric constant decreased due to a reduction of the net polarisation. This can be explained by the Maxwell–Wagner model of the dielectric constant.34 The dielectric loss for BST5K1F0.4T844 was almost independent of temperature (Fig. 10). The dielectric behaviour of the glass ceramics was observed to be independent of the heat treatment process of glass but a difference in the dielectric constant and dielectric loss was found in these two samples. The peak value of dielectric constant for these samples was observed to be 24![[thin space (1/6-em)]](https://www.rsc.org/images/entities/char_2009.gif) 250 and 107
250 and 107![[thin space (1/6-em)]](https://www.rsc.org/images/entities/char_2009.gif) 070, respectively. The higher dielectric constant in the 6 hour heat treated sample, BST5K1F0.4S844, was also supported by XRD and SEM. The addition of 1 mol% Fe2O3 to the BST glass promotes crystallization, as discussed earlier in the crystallization kinetics. The Fe3+ ions present in the glassy network are diffused into the crystalline BST at higher temperatures, which make the glass ceramic samples semiconducting. SEM showed that the grains of BST5K1F0.4S844 are well separated by grain boundary in the glassy matrix. Hence, a large conductivity difference is introduced between the semiconducting grains and insulating grain-boundary. The conductivity difference is responsible for space charge polarization and hence the high dielectric constant.17,29 This peak value (εr = 107
070, respectively. The higher dielectric constant in the 6 hour heat treated sample, BST5K1F0.4S844, was also supported by XRD and SEM. The addition of 1 mol% Fe2O3 to the BST glass promotes crystallization, as discussed earlier in the crystallization kinetics. The Fe3+ ions present in the glassy network are diffused into the crystalline BST at higher temperatures, which make the glass ceramic samples semiconducting. SEM showed that the grains of BST5K1F0.4S844 are well separated by grain boundary in the glassy matrix. Hence, a large conductivity difference is introduced between the semiconducting grains and insulating grain-boundary. The conductivity difference is responsible for space charge polarization and hence the high dielectric constant.17,29 This peak value (εr = 107![[thin space (1/6-em)]](https://www.rsc.org/images/entities/char_2009.gif) 070) of the dielectric constant was higher than that reported for La2O3 doped BST glass ceramics.16
070) of the dielectric constant was higher than that reported for La2O3 doped BST glass ceramics.16

![[thin space (1/6-em)]](https://www.rsc.org/images/entities/char_2009.gif) δ, with temperature at different frequencies for the glass ceramic sample BST5K1F0.4T844.
δ, with temperature at different frequencies for the glass ceramic sample BST5K1F0.4T844.
![[thin space (1/6-em)]](https://www.rsc.org/images/entities/char_2009.gif) δ, with temperature at different frequencies for the glass ceramic sample BST5K1F0.4S844.
δ, with temperature at different frequencies for the glass ceramic sample BST5K1F0.4S844.![[thin space (1/6-em)]](https://www.rsc.org/images/entities/char_2009.gif) δ, with temperature at few selected frequencies (20, 100 Hz, 1, 10 and 100 kHz) for the BST5K1F0.6S878, BST5K1F0.8S860 and ST5K1F1.0S872 samples, which were crystallized using the 6 hour heat treatment schedules, are shown in Fig. 12, 13 and 14. Fig. 12(a) and (b) depicts the dielectric behaviour of the glass ceramic sample BST5K1F0.6S878. The pattern shows that the dielectric constant increases gradually at 20 and 100 Hz with increasing temperature, and remains invariant at other frequencies. The dielectric loss also increased gradually with increasing temperature. The peak dielectric constant at 20 Hz was 9590. The dielectric constant for the BST5K1F0.8S860 sample was invariant up to 120 °C at lower frequencies and was independent of temperature at 10 and 100 kHz (Fig. 13). Similar behavior in the glass ceramic sample, ST5K1F1.0S872, was also observed. The dielectric constant and loss were not influenced significantly in the glass ceramic samples BST5K1F0.8S860 and ST5K1F1.0S872. The dielectric constant was strongly dependent on the composition, and decreased with the addition of SrO in place of BaO in the glassy matrix. The dielectric constant in the strontium rich sample was 3220, which was higher than the values reported for the CoO and La2O3 doped strontium borosilicate glass ceramics.17 This also supports the previous discussion in this section. The peak dielectric constants are listed in Table 5. The dielectric loss was found to be very low in this glass ceramic system. The low dielectric loss was attributed to the addition of Fe3+ ions in the glassy matrix, which have smaller ionic radii than that of Ti4+ ions. Fe3+ ions acts as acceptor ions and are very useful in reducing Ti4+ ions. Fe3+ ions may even substitute for Ti4+ sites and prevent the reduction of Ti4+ to Ti3+ by neutralizing the donor action of the oxygen vacancies, causing a decrease in the dielectric loss.30,31
δ, with temperature at few selected frequencies (20, 100 Hz, 1, 10 and 100 kHz) for the BST5K1F0.6S878, BST5K1F0.8S860 and ST5K1F1.0S872 samples, which were crystallized using the 6 hour heat treatment schedules, are shown in Fig. 12, 13 and 14. Fig. 12(a) and (b) depicts the dielectric behaviour of the glass ceramic sample BST5K1F0.6S878. The pattern shows that the dielectric constant increases gradually at 20 and 100 Hz with increasing temperature, and remains invariant at other frequencies. The dielectric loss also increased gradually with increasing temperature. The peak dielectric constant at 20 Hz was 9590. The dielectric constant for the BST5K1F0.8S860 sample was invariant up to 120 °C at lower frequencies and was independent of temperature at 10 and 100 kHz (Fig. 13). Similar behavior in the glass ceramic sample, ST5K1F1.0S872, was also observed. The dielectric constant and loss were not influenced significantly in the glass ceramic samples BST5K1F0.8S860 and ST5K1F1.0S872. The dielectric constant was strongly dependent on the composition, and decreased with the addition of SrO in place of BaO in the glassy matrix. The dielectric constant in the strontium rich sample was 3220, which was higher than the values reported for the CoO and La2O3 doped strontium borosilicate glass ceramics.17 This also supports the previous discussion in this section. The peak dielectric constants are listed in Table 5. The dielectric loss was found to be very low in this glass ceramic system. The low dielectric loss was attributed to the addition of Fe3+ ions in the glassy matrix, which have smaller ionic radii than that of Ti4+ ions. Fe3+ ions acts as acceptor ions and are very useful in reducing Ti4+ ions. Fe3+ ions may even substitute for Ti4+ sites and prevent the reduction of Ti4+ to Ti3+ by neutralizing the donor action of the oxygen vacancies, causing a decrease in the dielectric loss.30,31
![[thin space (1/6-em)]](https://www.rsc.org/images/entities/char_2009.gif) δ, with temperature at different frequencies for the glass ceramic sample BST5K1F0.6S878.
δ, with temperature at different frequencies for the glass ceramic sample BST5K1F0.6S878.
![[thin space (1/6-em)]](https://www.rsc.org/images/entities/char_2009.gif) δ, with temperature at different frequencies for the glass ceramic sample BST5K1F0.8S860.
δ, with temperature at different frequencies for the glass ceramic sample BST5K1F0.8S860.
![[thin space (1/6-em)]](https://www.rsc.org/images/entities/char_2009.gif) δ, with temperature at different frequencies for the glass ceramic sample ST5K1F1.0S872.
δ, with temperature at different frequencies for the glass ceramic sample ST5K1F1.0S872.![[thin space (1/6-em)]](https://www.rsc.org/images/entities/char_2009.gif) 250
250![[thin space (1/6-em)]](https://www.rsc.org/images/entities/char_2009.gif) 654
654![[thin space (1/6-em)]](https://www.rsc.org/images/entities/char_2009.gif) 334
334![[thin space (1/6-em)]](https://www.rsc.org/images/entities/char_2009.gif) 327
327![[thin space (1/6-em)]](https://www.rsc.org/images/entities/char_2009.gif) 070
070![[thin space (1/6-em)]](https://www.rsc.org/images/entities/char_2009.gif) 129
129![[thin space (1/6-em)]](https://www.rsc.org/images/entities/char_2009.gif) 061
061![[thin space (1/6-em)]](https://www.rsc.org/images/entities/char_2009.gif) 294
294![[thin space (1/6-em)]](https://www.rsc.org/images/entities/char_2009.gif) 021
021![[thin space (1/6-em)]](https://www.rsc.org/images/entities/char_2009.gif) 070 was found in a 6 hour heat treated glass ceramic sample. The high dielectric constant was due to space charge polarization, which was attributed to the conductivity difference between the semiconducting grains and the insulating grain-boundary in the glass matrix. Fe2O3 plays an important role as a nucleating agent, and it enhances the activation energy; moreover, it reduces the dielectric loss in the samples.
070 was found in a 6 hour heat treated glass ceramic sample. The high dielectric constant was due to space charge polarization, which was attributed to the conductivity difference between the semiconducting grains and the insulating grain-boundary in the glass matrix. Fe2O3 plays an important role as a nucleating agent, and it enhances the activation energy; moreover, it reduces the dielectric loss in the samples.


