Ionic liquids improve the anticorrosion performance of Zn-rich coatings
M. Echeverría*a,
C. M. Abreua,
F. J. Deiveb,
M. A. Sanrománb and
A. Rodríguezb
aENCOMAT Group, University of Vigo, 36310 Vigo, Spain. E-mail: mayren1980@uvigo.es; Tel: +34 986 812213
bDepartment of Chemical Engineering, University of Vigo, 36310 Vigo, Spain
First published on 3rd November 2014
Abstract
In this work, the suitability of the ionic liquid 1-ethyl-3-methyl imidazolium ethylsulfate (C2C1imC2SO4) for improving the anticorrosive behaviour of zinc rich paints (ZRP) has been demonstrated. The electrochemical performance of the coating has been evaluated by means of electrochemical impedance spectroscopy. These data allowed validating the use of the ionic liquid to measure the water diffusivity during inward and outward processes. The ionic liquid seems to play a positive role in the cathodic protection provided by the ZRP, as concluded from the current density and open circuit potential values. The observed improvement of the cathodic protection was attributed to the ionic liquid, whose presence was confirmed through surface characterization techniques such as FTIR, SEM, EDX and XRF.
Introduction
Over the past years, environmental concerns have highlighted the extensive and increasing importance of implementing more environmentally friendly and efficient industrial processes. In this sense, the emergence of ionic liquids has attracted a great scientific and industrial interest, due to their special properties such as their well-known negligible volatility,1 which completely avoids air pollution typically associated to other conventional solvents, or their tunability, which eases the design of taylor-made solvents by combining cations and anions. This fact has led to their industrial application in some extant processes, so their annual production has already surpassed the tonne magnitude.2 In particular, these molten salts have set the pace for the achievement of truly revolutionary processes in a diversity of fields: be it in biotechnology, analytical chemistry or electrochemistry.3 Within the latter, the use of ionic liquids for metal protection is a subject of particular importance and practical significance, since it may open up new opportunities in the field of corrosion inhibition.4–7Since corrosion involves losses of millions dollars worldwide,8 the pursuit of more efficient protective methods is desired. Among the existing alternatives, epoxy coatings have been widely used in combination with other protective additives (e.g. zinc particles) in different kinds of corrosive environments. In this sense, metallic elements provide the substrate with an additional cathodic protection which reinforces the inherent barrier properties associated to the epoxy coating.9,10 Nonetheless, corrosion products derived from zinc sacrificial protection could penetrate in the coating pores, thus reducing the duration of the cathodic protective effect. Several strategies have hitherto been proposed to improve the performance of zinc rich paints (ZRP), going from reducing the zinc particle size (from micro to nano scale) to the addition of nanoclays additives.9,11 Lately, Kowalczyk and Spychaj (2014) have demonstrated the beneficial effect of ionic liquids in the cathodic protection of ZRP, since they are hypothesized to further the electric contact between zinc particles, and also between them and the metallic substrate.12
Another advantage of ionic liquids is related to their good conductivity at room temperature promoting their application in electrochemistry as non-aqueous medium. In this line, the ease with which water and dissolved corrosive elements like NaCl are able to get through an specific protective coating is crucial for a proper evaluation of its resistance properties against corrosion.13,14 Among the available methods for studying water diffusion in coatings, electrochemical impedance spectroscopy (EIS) makes up the most appealing one, and was thus selected for the present work.15,16 Hence, the use of molten salts makes it possible to evaluate water uptake and desorption through subsequent wetting (in the presence of water) and drying (in the presence of ionic liquid) stages, respectively.
Taking into account the above mentioned, the ionic liquid 1-ethyl-3-methyl imidazolium ethylsulfate (C2C1imC2SO4) was selected for the first time to investigate the diffusivity of a model electrolyte (NaCl) in a ZRP, due to different advantages. For instance, it displays a relatively low viscosity and melting point, a high thermal and chemical stability, and it is considered one of the cheapest molten salts, since it is already synthesized in a halide-free way at an industrial scale.17 The protective effects on a steel substrate, due to the addition of this imidazolium-based ionic liquid, were evaluated by means of EIS measurements for both constant immersion and cyclic tests. Nyquist and Bode diagrams were used to analyse the deterioration process of the epoxy layer. The aforementioned was also supported by potentiodynamic measurements performed on coated samples immersed in a 0.05 M NaCl solution and in pure ionic liquid. Furthermore, several surface characterisation assays were employed to check the presence of the ionic liquid in the coated samples.
Materials and methods
Chemicals
The ionic liquid C2C1imC2SO4 was purchased from IoLiTec (purity higher than 99%), and its structure is shown in Fig. 1. Initially, it was subjected to vacuum drying (P = 2 × 10⁻¹ Pa, T = 313 K) for several days in order to reduce moisture and possible solvents impurities. Besides, the ionic liquid was dried again after three cycles, in order to reduce the water content to a mass fraction lower than 2 × 10⁻⁴, ascertained by means of a 756 Karl Fisher coulometer.Colled rolled low carbon steel panels,18 with dimensions 150 mm × 100 mm × 1 mm and composed of Mn (0.05%), S (0.04%), C (0.12%) and P (0.04%) were the substrate for the ZRP. Possible organic compounds, salts, dust, etc. adhered to the steel samples were removed by the addition of detergent and high pressure fresh water. A surface profile corresponding to Rugotest no. 3 was carried out up to a Sa 2.5.19 The corrosive process was stopped by placing the samples in an oven at 40 °C, until the painting was carried out. A two-component, zinc rich epoxy primer cured with polyamide was applied by the air-less method, and was kindly donated by HEMPEL laboratories (Barcelona, Spain). After drying, they were kept in a desiccator until the beginning of the experiment. Thickness was determined by means of a digital coating thickness gauge (POSITECTOR®. Model 6000-1) where standards of 25, 250 and 1000 μm were used for calibration. The average thickness of the coated samples was 55 ± 5 μm.
Electrochemical impedance spectroscopy measurements
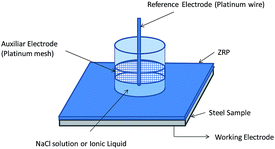
The experimental setup, shown in Fig. 2, consists of a glass circular tube, with an internal exposing area of 9.61 cm2, fixed between two bakelite sheets joined by screws and isolated by a rubber seal (between glass/bakelite). The electrochemical cell includes the reference electrode (a platinum wire), the counter electrode (a platinum mesh), and the working electrode (the substrate). EIS measurements (by duplicate) were carried out by using a potentiostat Autolab® PGSTAT 30 (Eco Chemie) equipped with a frequency response analyser FRA module. Air humidity was avoided by performing the experimental measurements in a desiccator.Constant immersion tests (IT) in the selected ionic liquid were carried out for 10 days to monitor impedance changes at open circuit potential every 6 h in the specimens (duplicate) under study. The signal amplitude was 20 mV rms and the frequency ranged from 1 MHz down to 10 mHz.
Cyclic test (CT) consisted of two subsequent stages (one cycle) of 24 hours in 0.05 M NaCl solution (wetting stage, W) and 24 h in C2C1imC2SO4 (drying stage, D). This procedure was repeated 7 times (cycles) for the painted specimens. The electrochemical cell was disassembled and cleaned with distilled water after each immersion. Every 40 min EIS data were collected at the same frequency range and signal amplitude used for those defined for the IT.
Polarization curves
Cathodic and anodic polarization curves were carried out in the potential range of ±300 mV in relation to Eocp (open circuit potential) at the scan rate of 1 mV s−1. The corrosion potential (Ecorr), the corrosion current density (icorr) and the corrosion rate (CR) were obtained from the Tafel straights by using the electrochemical software (GPES). Potentiodynamic scans were carried out at 2, 24 and 72 h of immersion of the coated samples in the ionic liquid and in the NaCl solution.Surface characterization
Morphology and composition of specimens under investigation were obtained with SEM and EDX assays by using a FE-SEM JEOL JSM6700F model with an energy dispersive X-ray detector EDS Oxford Inca Energy 300. Attenuated Total Reflectance Fourier Transform Infrared Spectroscopy (ATR-FTIR) test was carried out in a Nicolet 6700 spectrometer using a KBr beamsplitter and an DTGS KBr detector in the range from 400 cm−1 to 4000 cm−1. Also, X-ray fluorescence (XRF) tests were performed in a Siemens SRS3000 XRF sequential X-ray spectrometer.Ionic liquid recycling
The density of the ionic liquid was determined with an Anton Paar DSA-5000 digital vibrating tube densimeter, and this property served as a tool to check the viability of ionic liquid recycling. The apparatus was calibrated by measuring the density of Millipore quality water and ambient air according to manual instructions, and the quality of the calibration was checked by comparing the density of well-known pure liquids. The uncertainty in the experimental measurements (as defined by the manufacturer) has been found to be lower than ±10−5 g cm−3.Results and discussion
Analysis of coating performance by EIS data
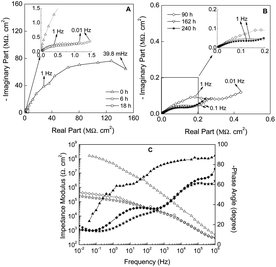
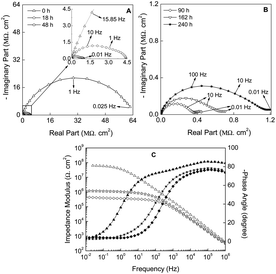
A deep analysis of the impedance spectra obtained from the EIS measurements constitutes a valuable piece of information for understanding the anticorrosive properties and the kinetics of the corrosion process in protective coatings.The first step of the work consists of evaluating the electrochemical behaviour of the ZRP in the presence of C2C1imC2SO4. This ionic liquid will be used for determining the coating behaviour during CT, since it allows determining water diffusivity parameters in subsequent wetting (0.05 M of NaCl) and drying cycles (ionic liquid). For comparative purposes the coating performance under 0.05 M of NaCl solution was also studied by EIS measurements.
| C = (−ωZi)−1 | (1) |
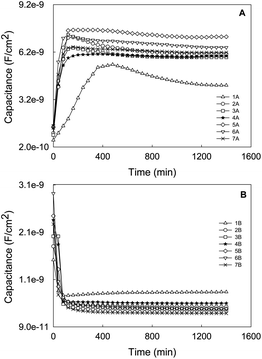 | ||
| Fig. 5 Capacitance evolution (10 KHz) vs. time of the coated sample exposed to 7 experimental cycles of continuous wetting (A) and drying (B) periods for CT. | ||
On the other hand, when the number of cycles is increased, a second order Fickian-type trend is observed, maybe as a consequence of the plasticization of the epoxy coating. It is also interesting to note that, generally, the more cycles are run, the higher levels of capacitance are reached. However, some exceptions can be remarked for cycles 3A, 4A, 6A and 7A, probably as a consequence of the formation of preferential routes within the ZRP.
Similarly, the behavior for the drying stage (Fig. 5B) fits well to the Fick's second law, with an initial linear decreased capacitance as the time is increased until a constant value, which reveals the end of water desorption of the ZRP. In this case, the trends are the same regardless of the cycle under study. The obtained results confirm the suitability of the selected ionic liquid to be used as non-aqueous medium in order to study the water outward diffusion in this kind of coatings.
 | (2) |
| Cycles | Co (nF) | Cs (nF) | Slope (F s−0.5) | D × 10−13 (m2 s−1) | R2 |
|---|---|---|---|---|---|
| 1A | 6.08 | 39.41 | 0.007 | 1.98 | 0.99 |
| 1B | 14.47 | 0.83 | −0.005 | 0.38 | 0.98 |
| 2A | 10.33 | 58.51 | 0.012 | 6.77 | 0.99 |
| 2B | 17.22 | 4.93 | −0.006 | 3.08 | 0.82 |
| 3A | 9.20 | 56.44 | 0.012 | 6.19 | 0.99 |
| 3B | 19.26 | 4.17 | −0.007 | 3.40 | 0.99 |
| 4A | 15.16 | 57.25 | 0.008 | 5.30 | 0.99 |
| 4B | 22.58 | 5.66 | −0.007 | 4.17 | 0.70 |
| 5A | 13.81 | 68.90 | 0.009 | 4.31 | 1.00 |
| 5B | 23.41 | 4.60 | −0.008 | 3.63 | 1.00 |
| 6A | 13.96 | 62.41 | 0.010 | 7.28 | 0.98 |
| 6B | 27.96 | 4.59 | −0.009 | 3.73 | 1.00 |
| 7A | 13.49 | 59.39 | 0.010 | 6.32 | 0.98 |
| 7B | 21.73 | 3.59 | −0.008 | 3.27 | 0.98 |
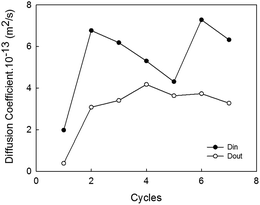
For a better analysis of the diffusivity data, Din and Dout have been plotted in Fig. 6 versus the 7 cycles investigated. In a visual inspection of the data it is possible to conclude that water molecules diffuse outwards at lower rates than during the uptake (average Dout = 3.10 × 10⁻¹³ m2 s−1 and average Din = 5.45 × 10⁻¹³ m2 s−1) in agreement with previous studies.25 Besides, the lower values of diffusivity are recorded in the first cycle, which could be motivated by the typical barrier effect faced for an intact coating. Then, Din increased from the first to the second cycle in more than 3 folds, an effect probably due to the above mentioned formation of preferential channels inside the coating favoring water uptake. The fluctuations recorded for the following cycles may be associated with the presence of zinc corrosion products plugging ZRP pores. Additionally, the interaction of hydroxyl groups existing in the zinc-rich epoxy coating with water molecules should also be taken into account to explain the differences obtained in the diffusivity values of water uptake. Regarding Dout values, no important alterations are observed in the figure, except for the first cycle, where the barrier effect is more remarkable.
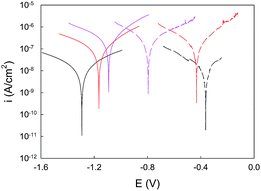
Polarization curves
In order to get further insight into the electrochemical performance in the presence of the selected ionic liquid, the potentiodynamic polarization curves at 2, 24 and 72 h are presented in Fig. 7.These data reveal a close resemblance in curves morphology for all the immersion times and for both electrolyte conditions (NaCl 0.05 M and ionic liquid). It is also noticeable that the studied systems are controlled by electron transfer, and the apparent similarity of the slopes of the anodic and cathodic branches suggest the existence of a mixed control. On the other hand, it becomes patent that higher values of current density are reached as immersion time is increased, no matter the electrolytic medium under investigation. Additionally, the comparison between NaCl and ionic liquid reveals that slightly lower levels of current density are recorded for the latter. This statement is corroborated when the Tafel experimental data, listed in Table 2, are analysed. Thus, the lowest value of icorr and CR was obtained for the system after 2 h in the presence of C2C1imC2SO4, with 1.22 × 10⁻⁹ A cm−2 and 1.31 × 10⁻⁷ mm per year, respectively, while the system immersed in NaCl 0.05 M for the same time led to 1.30 × 10⁻⁹ A cm−2 and 1.40 × 10⁻⁷ mm per year, respectively. This behaviour is confirmed after 24 h of immersion.
| Electrolyte | Immersion time (h) | Ecorra (mV) | icorr (A cm−2) | CR (mm per year) |
|---|---|---|---|---|
| a Vs. Platinum reference electrode. | ||||
| 0.05 M NaCl solution | 2 | −365 | 1.30 × 10⁻⁹ | 1.40 × 10⁻⁷ |
| 24 | −432 | 1.24 × 10⁻⁸ | 1.34 × 10⁻⁶ | |
| 72 | −795 | 2.65 × 10⁻⁸ | 2.75 × 10⁻⁶ | |
| C2C1imC2SO4 | 2 | −1292 | 1.22 × 10⁻⁹ | 1.31 × 10⁻⁷ |
| 24 | −1165 | 8.25 × 10⁻⁹ | 8.89 × 10⁻⁷ | |
| 72 | −1092 | 2.55 × 10⁻⁸ | 2.86 × 10⁻⁶ | |
Regarding the open circuit potential (OCP), the data shown in Fig. 7 evidences an opposite trend for the systems in the molten salt and those in the NaCl 0.05 M. Thus, while the steel/ZRP/ionic liquid systems tend to more positive values as time is increased, the steel/ZRP/NaCl specimens tend to reduced open circuit potential values. It is also noticeable how the OCP values for the former system are always more active (more negative) than the same system immersed in a NaCl solution. Hence, these data allow concluding that the selected ionic liquid probably promotes the activation of the zinc pigments for longer times, extending the duration of the cathodic anticorrosive protection. This is in agreement with the impedance values attained, since a greater anticorrosive resistance of the ZRP in contact with the ionic liquid was checked.
Surface characterization
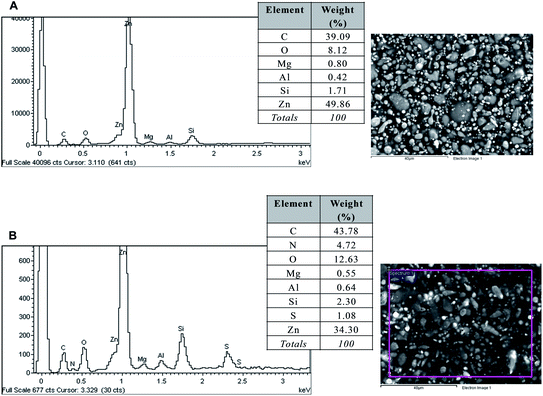
The aim of surface characterization analysis is to demonstrate the possible presence of C2C1imC2SO4 inside the coated samples after being tested in IT and CT, respectively. At first, it is important to know the main components in a ZRP which are an organic epoxy resin (contains carbon and hydrogen) and zinc pigments; even though negligible amounts of other elements such as nitrogen, magnesium, aluminium, silicon, sulfur, etc. can also be present.SEM images of the frontal view of the painted specimens (reference and tested) evidenced no relevant morphological changes between them (Fig. 8A and B). However, EDX spectrum of the reference sample indicates that sulfur was not present (Fig. 8A), and only the main constituents of the ZRP have been detected, contrarily to what happens for the sample submitted to 10 days of constant immersion in the ionic liquid (Fig. 8B), which reveals that some rests of the molten salt could remain in the paint after IT.
From ATR-FTIR data (Fig. 9) no important differences were visualized between the transmittance spectra of the reference and tested samples. The main functional groups detected are specific for an epoxy resin which are OH and NH (3200–3500 cm−1), CH aromatic (3000–3100 cm−1), CH aliphatic (2700–3000 cm−1); CO amide (1650 cm−1), C–C aromatic (1600 cm−1), p-substituted benzene (1500 cm−1), C–O secondary alcohol (1190 cm−1), CO aromatic (1040 cm−1), out of plane bending of aromatic C–H (840 cm−1) and out of plane ring C–C bend (560 cm−1), in agreement with a previous study.14
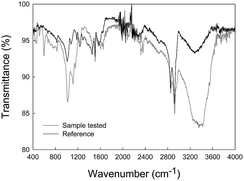 | ||
| Fig. 9 Transmittance spectrum of the ZRP after a 10 days immersion test in the ionic liquid. Comparison spectra between reference (without ionic liquid) and sample tested (exposed to ionic liquid). | ||
However, some technical limitations during measurement (lack of contact between the sample and the ATR crystal due to the porous nature of the former) could hinder an appropriate analysis. Hence, a very suitable technique for sulfur detection such as XRF was employed. Results confirm the presence of this element in all samples (reference and tested samples) which was not seen in previous evaluations of the reference ones (see Table 3). Additionally, a notable increment of sulfur from the reference to the tested samples (around 2 times higher) proves the presence of the ionic liquid and confirms the hypothesis that the molten salt is exerting a beneficial anticorrosive role on the ZRP-coated specimens.
| Formula | Reference (%) | Tested samplea (%) |
|---|---|---|
| a After 10 days of IT in the ionic liquid. | ||
| Mg | 2.90 ± 0.05 | 3.2 ± 0.07 |
| Al | 2.90 ± 0.38 | 3.6 ± 0.49 |
| Si | 8.00 ± 0.23 | 8.7 ± 0.21 |
| S | 0.77 ± 0.88 | 2.9 ± 0.99 |
| Cl | 2.20 ± 0.12 | 2.2 ± 0.14 |
| K | 0.45 ± 0.02 | 0.41 ± 0.04 |
| Ca | 0.52 ± 0.70 | 0.7 ± 0.11 |
| Fe | 0.91 ± 0.25 | 1.01 ± 0.37 |
| Zn | 81.43 ± 1.40 | 77.29 ± 1.39 |
It should be noted that C2C1imC2SO4 was recovered after IT and CT, and the analysis of its density at different temperatures reveal differences lower than 1% (1.29167 g mL−1 for the ionic liquid prior to the experiment, and 1.28094 g mL−1 after the experiment, at 25 °C). This confirms the high stability of the ionic liquid after being exposed to 0.05 M NaCl solution for 7 cycles (CT) and also in contact with the ZRP, which makes it possible to reuse it for further experiments.
Conclusions
Preliminary research findings obtained have proved that the use of the ionic liquid C2C1imC2SO4 improves the cathodic protection of ZRP. Impedance results indicated that the samples exposed to the molten salt have higher impedance values and only two time constants, suggesting that the zinc sacrificial protection is still active. Polarization tests revealed that the most negative OCP values were reported for panels exposed to the ionic liquid, which points out the extension of the cathodic anticorrosive protection duration. It was also demonstrated the suitability of the ionic liquid for studying inward and outward diffusion process as well as for determining diffusivity parameters.Surface characterization allowed concluding that there is no morphological change (by SEM) in the tested samples exposed to the ionic liquid. However, XRF data evidenced the presence of sulfur (by XRF) in both reference and tested panels, but the highest content was detected in ZRP samples immersed in the ionic liquid for several days, thus confirming that the positive effects observed in the coating are due to the presence of the molten salt. However, further studies at longer immersion times are necessary in order to shed light on the electrochemical mechanism underlying the behaviour of the selected ionic liquid in the ZRP.
Acknowledgements
M. Echeverría is very grateful to the University of Vigo for funding through a PhD grant and to the ENCOMAT group (University of Vigo) for its valuable support. The authors acknowledge Spanish Ministry of Economy and EDERF funds and Competitiveness for funding through CTM2012-31534 project. The authors also thank the important support of HEMPEL laboratories (Barcelona, Spain) and CACTI (Center for Scientific and Technological support) at the University of Vigo, for the supply of coatings and samples preparation and their valuable assistance with FTIR and XRF measurements, respectively.References
- M. J. Earle, J. M. S. S. Esperança, M. A. Gilea, J. N. Canongia Lopes, L. P. N. Rebelo, J. W. Magee, K. R. Seddon and J. A. Widegren, Nature, 2006, 439, 831–834 CrossRef CAS PubMed.
- F. J. Deive, A. Rodríguez, A. Varela, C. Rodrígues, M. C. Leitão, J. A. M. P. Houbraken, A. B. Pereiro, M. A. Longo, M. A. Sanromán, R. A. Samson, L. P. N. Rebelo and C. Silva Pereira, Green Chem., 2011, 13, 687–696 RSC.
- N. V. Plechkova and K. R. Seddon, Chem. Soc. Rev., 2008, 37, 123–150 RSC.
- T. Tüken, F. Demir, N. Kıcır, G. Sıgırcık and M. Erbil, Corros. Sci., 2012, 59, 110–118 CrossRef PubMed.
- N. Likhanova, M. Domínguez-Aquilar, O. Olivares-Xometl, N. Nava-Entzana, E. Arce and H. Dorantes, Corros. Sci., 2010, 52, 2088–2097 CrossRef CAS PubMed.
- X. Zhou, H. Yang and F. Wang, Electrochim. Acta, 2011, 56, 4268–4275 CrossRef CAS PubMed.
- H. Ashassi-Sorkhabi and M. Es'haghi, Mater. Chem. Phys., 2009, 114, 267–271 CrossRef CAS PubMed.
- M. Echeverría, C. M. Abreu and C. A. Echeverría, Assessing pretreatment effect on the protective properties of different coating systems against marine corrosion, Corrosion, 2014 DOI:10.5006/1278.
- K. Schaefer and A. Miszczyk, Corros. Sci., 2013, 66, 380–391 CrossRef CAS PubMed.
- N. Hammouda, H. Chadli, G. Guillemot and K. Belmokre, The Corrosion Protection Behaviour of Zinc Rich Epoxy Paint in 3% NaCl Solution, Adv. Chem. Eng. Sci., 2011, 1, 51–60 CrossRef CAS.
- N. Arianpouya, M. Shishesaz and A. Ashrafi, Surf. Coat. Technol., 2013, 216, 199–206 CrossRef CAS PubMed.
- K. Kowalczyk and S. Spychaj, Corros. Sci., 2014, 78, 111–120 CrossRef CAS PubMed.
- R. M. Souto, Y. González-García, J. Izquierdo and S. González, Corros. Sci., 2010, 52, 748–753 CrossRef CAS PubMed.
- F. Contu, L. Fenzy and S. R. Taylor, Prog. Org. Coat., 2012, 75, 92–96 CrossRef CAS PubMed.
- N. Fredj, S. Cohendoz, S. Mallarino, X. Feaugas and S. Touzain, Prog. Org. Coat., 2010, 67, 287–295 CrossRef CAS PubMed.
- S. Shreepathi, S. M. Naik and M. R. Vattipalli, J. Coat. Technol. Res., 2012, 9, 411–422 CrossRef CAS.
- A. B. Pereiro, F. J. Deive, J. M. S. S. Esperança and A. Rodríguez, Fluid Phase Equilib., 2010, 291, 13–17 CrossRef CAS PubMed.
- UNE-EN 10130, “Productos planos laminados en frío de acero bajo en carbono para embutición o conformación en frío – Condiciones técnicas de suministro” (Madrid, Spain: Spanish Standardization and Certification Association [AENOR], 2008.
- UNE-EN ISO 8501–1, “Preparación de substratos de acero previa a la aplicación de pinturas y productos relacionados – Evaluación visual de la limpieza de las superficies – Parte 1: Grados de óxido y de preparación de substratos de acero no pintados después de eliminar totalmente los recubrimientos anteriores” (Madrid, Spain: Spanish Standardization and Certification Association [AENOR], 2008.
- C. M. Abreu, M. Izquierdo, M. Keddam, X. R. Nóvoa and H. Takenouti, Electrochim. Acta, 1996, 41, 2405–2415 CrossRef CAS.
- J. R. Vilche, E. C. Bucharsky and C. A. Giúdice, Corros. Sci., 2002, 44, 1287–1309 CrossRef CAS.
- J. H. Park, T. H. Yun, K. Y. Kim, Y. K. Song and J. M. Park, Prog. Org. Coat., 2012, 74, 25–35 CrossRef CAS PubMed.
- F. Deflorian, L. Fedrizzi, S. Rossi and P. L. Bonora, Electrochim. Acta, 1999, 44, 4243–4249 CrossRef CAS.
- K. N. Allahar, B. R. Hinderliter, G. P. Bierwagen, D. E. Tallman and S. G. Croll, Prog. Org. Coat., 2008, 62, 87–95 CrossRef CAS PubMed.
- K. N. Allahar, B. R. Hinderliter, A. M. Simoes, D. E. Tallman, G. P. Bierwagen and S. G. Crolla, J. Electrochem. Soc., 2007, 154, F177–F185 CrossRef CAS PubMed.
| This journal is © The Royal Society of Chemistry 2014 |


