Very high power and superior rate capability LiFePO4 nanorods hydrothermally synthesized using tetraglycol as surfactant†
Ruiyuan Tiana,
Guangyao Liub,
Haiqiang Liua,
Lina Zhangc,
Xiaohua Guc,
Yanjun Guoa,
Hanfu Wang*a,
Lianfeng Sun*a and
Weiguo Chu*a
aNational Center for Nanoscience and Technology of China, Beijing 100190, P. R. China. E-mail: wgchu@nanoctr.cn; wanghf@nanoctr.cn; lfs@nanoctr.cn; Fax: +86 10 62656765; Tel: +86 10 82545612
bInstitute of Physics, Chinese Academy of Sciences, Beijing 100190, P. R. China
cDepartment of Physics, Tsinghua University, Beijing 100084, P. R. China
First published on 20th November 2014
Abstract
Small polarizations, i.e. sufficiently good electronic and ionic conductivity is indispensible for high power lithium iron phosphate, especially for its applications to large current power supplies. Here, carbon coated LiFePO4/C nanorods that were hydrothermally synthesized using tetraglycol as surfactant followed by calcination exhibit very small polarizations (13.0 mV at 0.1 C, 1 C = 170 mA g−1), high power densities (96.5 and 95.4 kW kg−1 at 200 C at RT and 60 °C, respectively), and excellent cycling performance at high rates (92% discharge capacity retention at 100 C after 200 cycles) with only 10 wt% conductive additive. Intermixing between Fe and Li is detected in the as-synthesized, annealed and carbon coated samples. The superior rate capabilities (270.0 W h kg−1 and 43.0 kW kg−1 at 85 C at RT, 310 W h kg−1 and 49.8 kW kg−1 at 96 C at 60 °C) and small polarizations are attributed to the nanoscale size along the [010] plane, the uniform carbon coating and the partial occupation of Li at the Fe sites. The recipe in this study is quite simple, controllable, energy saving and readily up-scalable. The availability of very high power LiFePO4 with excellent cycling capability at high rates will undoubtedly greatly promote its applications to large current power supplies such as electric and hybrid electric vehicles.
1. Introduction
Lithium iron phosphate is considered to be the most promising cathode material for lithium ion batteries, particularly for electric and hybrid electric vehicles due to its good performance, low cost, environmental friendliness and safety.1–3 High power density is indispensible for its applications in large current power supplies, which can be achieved provided that sufficiently high discharge voltages at high rates can be maintained, i.e. sufficiently small polarizations with both good electronic and ionic conductivities are necessary.4–7 However, it is often seen that LiFePO4 with high capacities at high rates usually shows relatively low discharge voltages, accompanied by large polarizations.8–11 High discharge voltages of LiFePO4 with small polarizations may be closely coupled to its structure, chemical composition, size, morphology and reaction pathways upon Li+ insertion and extraction.12–16 To date, the pursuit of high power LiFePO4 is still far from satisfactory, and the correlation between high power and diversified materials parameters must be intensively explored.Many methods have been tested to improve the electrochemical performance of LiFePO4 by tailoring its structure, morphology and size to develop high capacities at high discharge rates.17–20 Reducing polarizations by improving both electronic and ionic conductivities will increase its power density. Small polarizations may have a significant influence on capacity; however, they do not necessarily result in high capacities. This is probably related to a match between ionic and electronic conductivities. It is actually quite difficult to obtain LiFePO4 with both high energy and power densities.21 Generally, a perfect crystal is always desired for LiFePO4 because of diversified defects, such as the partial occupation of Fe at the Li site because the blocking effect of Fe in the channel would degrade its electrochemical performance.22–28 However, the doping of supervalent cations into the Fe site of LiFePO4 was experimentally observed to benefit its electrochemical performance, although this is theoretically controversial.29–31 Thus, the presence of different cations at the Li and Fe sites appears to have opposite effects on the electrochemical performance of LiFePO4. To the best of our knowledge, little is known about the doping of Li at the Fe site in LiFePO4, i.e. so-called self-doping, and its effect on the electrochemical performance.
We used a low temperature hydrothermal method at 140 °C to synthesize LiFePO4 with tetraglycol as surfactant, followed by carbon coating at 600 °C for 3 h with glucose as a carbon source to realize the so-called self-doping. The partial occupation of Fe at the Li site and of Li at the Fe site was indeed observed in the as-synthesized, annealed and carbon coated LiFePO4 nanorods. In spite of the antisite defects, LiFePO4 nanorods, which are synthesized using this simple, controllable and up-scalable approach exhibit the highest power densities (high discharge voltages) for the same rates reported to date with superior rate capability (certain capacities still available at very high rates such as 200 C). This is extremely important for promoting the applications of LiFePO4 in fields such as electric and hybrid electric vehicles.
2. Experimental
Synthesis of LiFePO4 nanorods
Tetraglycol and deionized water in a volume ratio of 80![[thin space (1/6-em)]](https://www.rsc.org/images/entities/char_2009.gif) :
:![[thin space (1/6-em)]](https://www.rsc.org/images/entities/char_2009.gif) 20 were mixed as the reaction medium throughout the hydrothermal preparation of LiFePO4 nanorods. Typically, 5 ml of 1 M H3PO4 aqueous solution was mixed with 120 ml of tetraglycol, and then 15 ml of 1 M aqueous LiOH was slowly introduced with mechanical stirring, and a white suspension was obtained. Finally, 10 ml of 0.5 M FeSO4 solution was added with stirring, resulting in green suspension. All of this was carried out in an inert atmosphere (Ar). The resulting mixture was transferred into a 200 ml Teflon-lined stainless steel autoclave, which was sealed and heated to 140 °C, and kept for 24 h, then cooled to room temperature (RT). The precipitate was centrifuged, washed with water and ethanol several times, and dried in a vacuum desiccator at 80 °C for 12 h. The as synthesized samples (sample S) were treated without (sample H) and with glucose (20 wt%) as the carbon source (sample G), respectively, at 200 °C for 0.5 h, followed by annealing at 600 °C for 3 h in an Ar atmosphere.
20 were mixed as the reaction medium throughout the hydrothermal preparation of LiFePO4 nanorods. Typically, 5 ml of 1 M H3PO4 aqueous solution was mixed with 120 ml of tetraglycol, and then 15 ml of 1 M aqueous LiOH was slowly introduced with mechanical stirring, and a white suspension was obtained. Finally, 10 ml of 0.5 M FeSO4 solution was added with stirring, resulting in green suspension. All of this was carried out in an inert atmosphere (Ar). The resulting mixture was transferred into a 200 ml Teflon-lined stainless steel autoclave, which was sealed and heated to 140 °C, and kept for 24 h, then cooled to room temperature (RT). The precipitate was centrifuged, washed with water and ethanol several times, and dried in a vacuum desiccator at 80 °C for 12 h. The as synthesized samples (sample S) were treated without (sample H) and with glucose (20 wt%) as the carbon source (sample G), respectively, at 200 °C for 0.5 h, followed by annealing at 600 °C for 3 h in an Ar atmosphere.
Structural characterizations
The structures of samples S, H and G were characterized by X-ray diffraction technique (XRD). The XRD data were collected on a Rigaku D/MAX-2500 diffractometer with a Cu Kα radiation at 45 kV and 250 mA. A step scan mode was adopted with a step size of 0.02°, a sampling time of 1 s and an angle range of 15°–130°. The morphology and structure of samples were studied by transmission electron microscopy and high resolution transmission electron microscopy (TEM, HRTEM, Tecnai F20, FEI Company, USA). The carbon content of sample G was determined using a carbon and sulfur analyzer (CS-344, LECO Company, USA).Electrochemical measurements
Electrochemical experiments were performed using a CR 2025 coin cell. The samples with and without carbon coating, acetylene black and PVDF (poly(vinylidene fluoride)) were mixed and ground with a weight ratio of 80![[thin space (1/6-em)]](https://www.rsc.org/images/entities/char_2009.gif) :
:![[thin space (1/6-em)]](https://www.rsc.org/images/entities/char_2009.gif) 10
10![[thin space (1/6-em)]](https://www.rsc.org/images/entities/char_2009.gif) :
:![[thin space (1/6-em)]](https://www.rsc.org/images/entities/char_2009.gif) 10 using N-methyl-2-pyrrolidone (NMP) as the solvent. The resulting slurry was spread onto an aluminum foil and dried under vacuum at 110 °C for 12 h. The foil was punched into a circular disc and pressed under 20 MPa to from a cathode. The loading of active material was about 2.0 mg cm−2. Lithium metal was used as the counter electrode and Celgard 2316 as the separator was used to assemble cells in an argon-filled glove box. 1.0 M LiPF6 was dissolved in a mixture of ethylene carbonate (EC), ethyl methyl carbonate (EMC) and dimethyl carbonate (DMC) with a volume ratio of 1
10 using N-methyl-2-pyrrolidone (NMP) as the solvent. The resulting slurry was spread onto an aluminum foil and dried under vacuum at 110 °C for 12 h. The foil was punched into a circular disc and pressed under 20 MPa to from a cathode. The loading of active material was about 2.0 mg cm−2. Lithium metal was used as the counter electrode and Celgard 2316 as the separator was used to assemble cells in an argon-filled glove box. 1.0 M LiPF6 was dissolved in a mixture of ethylene carbonate (EC), ethyl methyl carbonate (EMC) and dimethyl carbonate (DMC) with a volume ratio of 1![[thin space (1/6-em)]](https://www.rsc.org/images/entities/char_2009.gif) :
:![[thin space (1/6-em)]](https://www.rsc.org/images/entities/char_2009.gif) 1
1![[thin space (1/6-em)]](https://www.rsc.org/images/entities/char_2009.gif) :
:![[thin space (1/6-em)]](https://www.rsc.org/images/entities/char_2009.gif) 1 as the electrolyte. Electrochemical experiments were carried out on a battery test system (BTS-5 V, Neware Company, China) at RT and 60 °C. Electrochemical impedance spectra (EIS) were recorded using an electrochemical workstation (CHI660D, Shanghai Chenghua Company, China).
1 as the electrolyte. Electrochemical experiments were carried out on a battery test system (BTS-5 V, Neware Company, China) at RT and 60 °C. Electrochemical impedance spectra (EIS) were recorded using an electrochemical workstation (CHI660D, Shanghai Chenghua Company, China).
3. Results and discussion
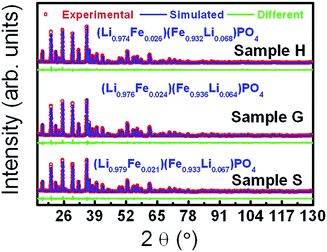
Fig. 1 shows the XRD patterns of samples S, H and G. From their XRD patterns, it can be observed that sample H and G are found to be composed of single phase LiFePO4, whereas sample S has some minor impurities. A model of an orthorhombic structure with the space group of Pnma was employed to perform Rietveld refinements on the XRD data.32 The simulated patterns based on the abovementioned structural model efficiently agree with the experimental ones. The refined parameters are outlined in Table 1 and Table S1 (ESI†). One can find that the annealing causes the lattice to contract along both a and c but expand along b (Table 1). This may be a consequence of the stress relief upon annealing. The sizes of the crystallites along the directions normal to (200), (101) and (020) are estimated according to the Scherrer equation, d = kλ/β![[thin space (1/6-em)]](https://www.rsc.org/images/entities/char_2009.gif) cos
cos![[thin space (1/6-em)]](https://www.rsc.org/images/entities/char_2009.gif) θ, in which λ is the wavelength, k a constant, 0.89, β the full width at half height and θ is the Bragg angle by taking the instrument broadening effect into consideration.33 The comparable sizes along the directions normal to (200) and (020) are considerably smaller than that along the direction normal to (101), suggesting a rod-like morphology. According to the Rietveld refinements, the formulae were derived to be (Li0.979Fe0.021)(Fe0.933Li0.067)PO4 (Li1.046Fe0.954PO4), (Li0.974Fe0.026)(Fe0.932Li0.068)PO4 (Li1.042Fe0.958PO4), and (Li0.976Fe0.024)(Fe0.936Li0.064)PO4 (Li1.040Fe0.960PO4) for samples S, H and G, respectively. The Li site is found to be occupied by around 3% Fe, and the Fe site by around 7% Li for all the samples. In fact, we also tried the models with Li replaced by vacancies to refine the XRD data, giving a little higher values of figure of merit, i.e. 1.27 versus 1.26 for sample H and 1.41 versus 1.40 for sample G. The very small differences are due to the small capability of Li for scattering X-rays. This further supports the intermixing between Fe and Li. In addition, we performed the valence calculation of elements at different sites according to two models: bond valence sum and charge distribution model.34,35 The valences for the identical elements at the same sites derived from two models are very comparable (Table S1, ESI†), supporting the Rietveld refinement results. Around 3% Fe occupation at the Li site is consistent with the reported values.36,37 The occupation of about 7% Li at the Fe site is also reasonable according to the fact that the FeLi and LiFe defect couples are not only energetically favorable but their concentrations are independent on one side;38–41 moreover, the ionic radii for Li+ and Fe2+ are very close as well (Li+: 0.76 Å and Fe2+: 0.78 Å). In fact, the partial occupation of Li at the Fe site and the excess of Li in the formula were also reported.42–44 The annealing of the samples with and without glucose as a carbon source at 600 °C for 3 h has no sizable effect on the ordering of Fe and Li, in contrast to a study.45
θ, in which λ is the wavelength, k a constant, 0.89, β the full width at half height and θ is the Bragg angle by taking the instrument broadening effect into consideration.33 The comparable sizes along the directions normal to (200) and (020) are considerably smaller than that along the direction normal to (101), suggesting a rod-like morphology. According to the Rietveld refinements, the formulae were derived to be (Li0.979Fe0.021)(Fe0.933Li0.067)PO4 (Li1.046Fe0.954PO4), (Li0.974Fe0.026)(Fe0.932Li0.068)PO4 (Li1.042Fe0.958PO4), and (Li0.976Fe0.024)(Fe0.936Li0.064)PO4 (Li1.040Fe0.960PO4) for samples S, H and G, respectively. The Li site is found to be occupied by around 3% Fe, and the Fe site by around 7% Li for all the samples. In fact, we also tried the models with Li replaced by vacancies to refine the XRD data, giving a little higher values of figure of merit, i.e. 1.27 versus 1.26 for sample H and 1.41 versus 1.40 for sample G. The very small differences are due to the small capability of Li for scattering X-rays. This further supports the intermixing between Fe and Li. In addition, we performed the valence calculation of elements at different sites according to two models: bond valence sum and charge distribution model.34,35 The valences for the identical elements at the same sites derived from two models are very comparable (Table S1, ESI†), supporting the Rietveld refinement results. Around 3% Fe occupation at the Li site is consistent with the reported values.36,37 The occupation of about 7% Li at the Fe site is also reasonable according to the fact that the FeLi and LiFe defect couples are not only energetically favorable but their concentrations are independent on one side;38–41 moreover, the ionic radii for Li+ and Fe2+ are very close as well (Li+: 0.76 Å and Fe2+: 0.78 Å). In fact, the partial occupation of Li at the Fe site and the excess of Li in the formula were also reported.42–44 The annealing of the samples with and without glucose as a carbon source at 600 °C for 3 h has no sizable effect on the ordering of Fe and Li, in contrast to a study.45
| Parameters | Sample | |||
|---|---|---|---|---|
| S | H | G | ||
| a (Å) | 10.3215 | 10.3134 | 10.3163 | |
| b (Å) | 5.9947 | 5.9998 | 6.000 | |
| c (Å) | 4.6960 | 4.6932 | 4.6923 | |
| Size of crystallites (nm) | (200) | 58.0 | 64.0 | 60.0 |
| (101) | 104.3 | 92.7 | 86.3 | |
| (020) | 53.8 | 74.5 | 72.0 | |
| Reliability factors | Rwp | 8.08% | 7.13% | 7.82% |
| RB | 2.31% | 1.93% | 2.09% | |
| S | 1.440 | 1.261 | 1.404 | |
| Refined formula | (Li0.979Fe0.021)(Fe0.933Li0.067)PO4 Li1.046Fe0.954PO4 | (Li0.974Fe0.026)(Fe0.932Li0.068)PO4 Li1.042Fe0.958PO4 | (Li0.976Fe0.024)(Fe0.936Li0.064)PO4 Li1.040Fe0.960PO4 | |
| Impurity percentage | 4.24% | — | — | |
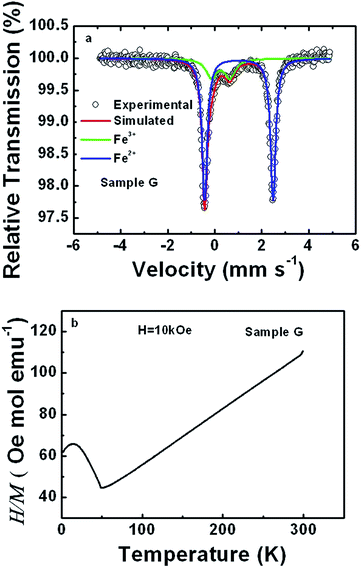
To further prove the intermixing between Li and Fe, RT Mössbauer spectra and the temperature dependence of magnetic susceptibility of sample G were acquired, as shown in Fig. 2(a) and (b), respectively. The spectrum was simultaneously analyzed in terms of two components, labeled as Fe2+ and Fe3+ in Fig. 2(a). The corresponding hyperfine parameters are outlined in Table 2. The isomer shifts and quadrupole splittings for both Fe2+ and Fe3+ are close to those reported in ref. 46 and 47, which are assigned to Fe2+ in LiFePO4 and Fe3+ due to lattice defects in LiFePO4, such as the replacement of Li by Fe instead of Fe3+ from other impurities, respectively. The difference lies in a higher ratio of Fe3+ to Fe2+ doublet areas, i.e. around 20% versus 10% reported in ref. 46. The presence of Fe3+ due to lattice defects is also strongly supported by the perfectly linear dependence of the magnetic susceptibility on temperature above the Neel temperature of about 50 K in Fig. 2(b).48 If around 20% Fe3+ arises from other impurities in the sample, one should undoubtedly be able to observe some traces from the dependences of magnetic susceptibility on temperature.48 According to the Curie–Weiss law, the effective moment of Fe in sample G was derived to be 5.62 μB, which is quite comparable to 5.36 μB due to the replacement of Li by Fe.49 All of this, along with the XRD refinement results gives strong evidence for the partial occupation of the Li site by Fe and of the Fe site by Li.
| Sample | δ (mm s−1) | Qs (mm s−1) | Γ (mm s−1) | Area ratio (%) | |
|---|---|---|---|---|---|
| G | Fe2+ | 1.11 ± 0.00 | 2.91 ± 0.00 | 0.13 ± 0.00 | 78.6 |
| Fe3+ | 0.34 ± 0.00 | 0.78 ± 0.01 | 0.28 ± 0.01 | 21.4 | |
TEM images, HRTEM images, along with their corresponding fast Fourier transformation (FFT) images for three samples are shown in Fig. 3(a)–(c) and (d)–(f), respectively. The size of LiFePO4 nanorods for three samples is found to have slightly broad distributions. LiFePO4 nanorods are found to coalesce and spheroidize when subjected to annealing at 600 °C. The combination of HRTEM and corresponding FFT images allows one to determine the crystallographic directions of a nanorod, i.e., one of the shorter axes of nanorods is along [010], which is consistent with the results of size estimation from XRD (Table 1). The corners of nanorods are rounded, and a relatively uniform and a thin layer of carbon with a thickness of about 4 nm is coated on LiFePO4 nanorods for sample G. In contrast, no carbon thin layer was observed for samples S and H. This indicates that the thin layer of carbon for sample G results from the added glucose.
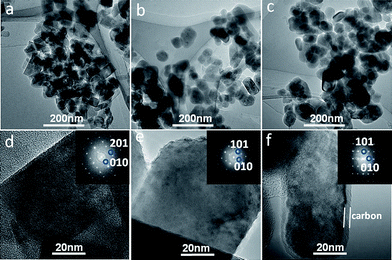 | ||
| Fig. 3 TEM images (a)–(c), HRTEM images (d)–(f) and FFT images of sample S, H and G. LiFePO4 is rod-like in the nanoscale, and one of the shorter axes is along [010], favoring the Li+ diffusion. | ||
The electrochemical properties of sample H and G were measured, and their charge and discharge curves as well as corresponding coulombic efficiencies and discharge capacities at various rates at RT and 60 °C are shown in Fig. 4. Both the samples show high coulombic efficiencies at all charge and discharge rates, indicative of good reversible extraction/insertion of Li ions even at very high rates. At 0.1 C, sample H and G exhibit 150.5 and 160.2 mA h g−1, respectively. Sample G shows well defined discharge plateaus for different rates. Even for a rate of 200 C, sample G has a discharge capacity of about 38.0 mA h g−1 with an apparent voltage plateau, suggesting a superior rate capability and little contribution from the capacitor-like discharge capacity. This is very important for large current power supplies, especially for those applications that require high discharge voltages such as electric and hybrid electric vehicles. In contrast, sample H is able to simply discharge at 20 C. However, in the case of no carbon coating, the rate capability of sample H is still far better than that in ref. 50, and even comparable to the carbon coated samples with an additive of 25 wt% carbon black.51 In addition, the discharge capacities for both the samples H and G at 60 °C are significantly higher than those at RT, especially for high rates. The discharge capacity of sample G for the rate of 200 C increases from 38.0 mA h g−1 at RT to 58.0 mA h g−1 at 60 °C, an increase of 52.6%. Likewise, sample H shows an increase of 230% from 11.6 mA h g−1 at RT to 38.0 mA h g−1 at 60 °C for 20 C, and even 27.0 mA h g−1 for 30 C. The significant increase in discharge capacity for both the samples is due to a decrease of Li+ diffusion impedance, which can be ascribed to the lattice expansion of LiFePO4 at high temperatures.
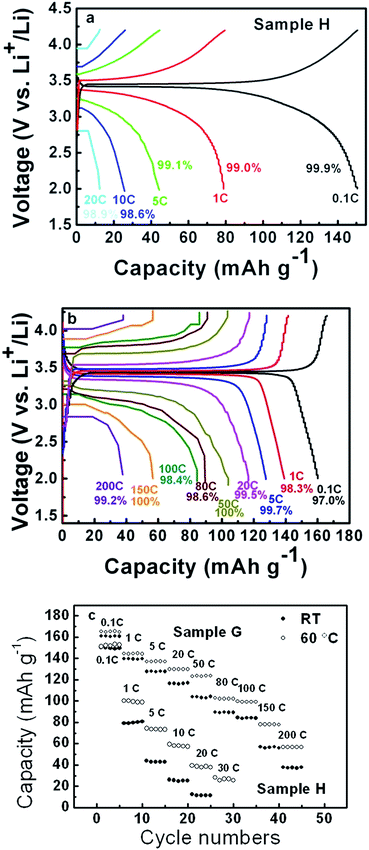 | ||
| Fig. 4 Charge and discharge curves and corresponding coulombic efficiencies at various rates of sample H (a) and G (b), and discharge capacities (c). | ||
The rate dependences of the polarization and discharge voltage at 50% depth of discharge (DOD) are plotted in Fig. 5. It is worth noting that the polarizations for sample G are very small, i.e., 13.0 mV at 0.1 C, far smaller than 45.6 mV for the carbon-nanotube-decorated nano LiFePO4 with very good performance.52 Sample H shows a polarization of about 96.0 mV at 0.1 C, far smaller than 310.0 mV at 0.1 C even with a little bit higher discharge capacity, 162 mA h g−1.53 Most strikingly, in this study the discharge voltages at 50% DOD, especially at high rates were very high, implying high power densities. The discharge voltages at 50% DOD for 0.1 and 200 C rates at RT for sample G are 3.434 and 2.837 V, respectively. The value for sample G at 200 C here is even higher than those at far lower rates, i.e., 2.5 V at 80 C,54 and is very comparable to 2.87 V at 10 C with excellent rate performance.55 The discharge voltages of sample H for 0.1 and 20 C at RT were 3.371 and 2.694 V, respectively, which are higher than 3.20 V (ref. 50) and 3.22 V (ref. 53) for 0.1 C and 2.32 V for 20 C.50 The excellent rate capability of sample G is very comparable to the best ones so far but the discharge voltages are far higher than them (Fig. S1, ESI†).
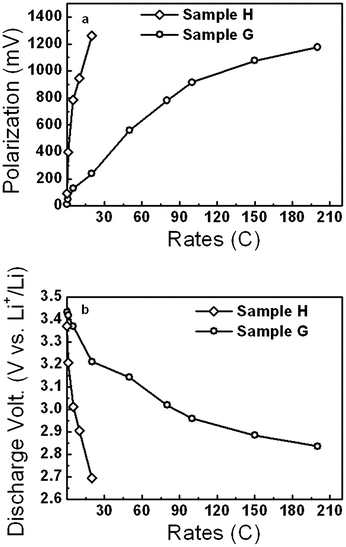 | ||
| Fig. 5 Polarizations (a) and discharge voltages (b) at 50% DOD for various rates of sample H and G, indicating high discharge voltages. | ||
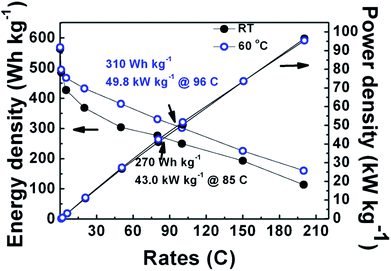
Fig. 6 shows both energy and power densities for sample G at RT and 60 °C. Energy and power densities of sample G were 310.0 W h kg−1 and 49.8 kW kg−1 at 96 C at 60 °C, and 270.0 W h kg−1 and 43.0 kW kg−1 at 85 C at RT, which are far higher than 227.0 W h kg−1 and 34.0 kW kg−1 at 80 C at RT reported recently with a higher percentage of conductive additive (15 wt%).54 At the rate of 200 C, a power density as high as 96.5 kW kg−1 was achieved, which is higher than 90 kW kg−1 reported with 65 wt% conductive additive.56 Such high power densities due to high discharge voltages are of great significance for applications to electric and hybrid electric vehicles. The high discharge voltages at high rates at 50% DOD can be attributed to small polarizations.
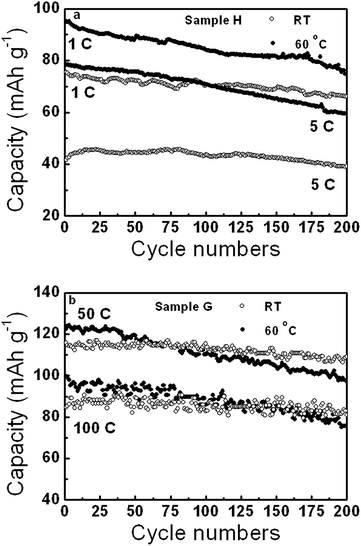
The cycling performances of sample H and G at different rates at RT and 60 °C are shown in Fig. 7. Sample H had discharge capacity retentions of about 88% and 93% after 200 cycles at 1 and 5 C at RT, and 79% and 76% at 60 °C, respectively. Sample G showed high discharge capacity retentions, such as 80% at 50 C and 77% at 100 C at 60 °C, and 94% at 50 C and 97% at 100 C at RT after 200 cycles. Sample G was revealed to have excellent cycling performance at high rates, especially at RT.
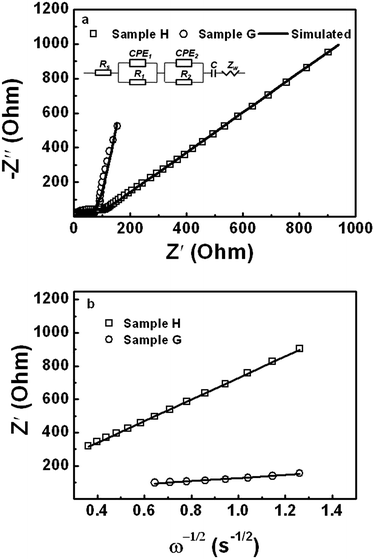
To estimate the resistance of sample H and G, their electrochemical impedance spectra (EIS) were acquired and the results are shown in Fig. 8. A depressed semicircle and a sloping line are observed in the high- and low-frequency range, respectively, for the both samples. This clearly shows the features of the ohmic resistance, charge transfer resistance, and the Warburg behavior for both the samples. According to the fundamental electrochemical process for lithium ion cells,57 an equivalent circuit model is proposed and their simulated spectra are shown Fig. 8(a). In this model, Rs is the resistance of the electrolyte and electrode, R1 and CPE1 are the resistance and capacity of the surface film, respectively. R2 and CPE2 are the charge transfer resistance and capacity, respectively and Zw is the Warburg impedance. Moreover, the relationships between the impedance versus ω−1/2 for two samples are depicted in Fig. 8(b) to figure out their diffusion coefficients of Li+.58 Sample H is found to have far larger resistance and lower diffusion coefficient of Li+ compared to sample G (Table 3). The diffusion coefficient of Li+ for sample H is estimated to be 2.65 × 10⁻¹⁶ cm2 s−1, whereas that for sample G, 1.40 × 10⁻¹⁴ cm2 s−1 is comparable to the reported values.59,60 It is apparent that considerably higher resistances and a lower Li+ diffusion coefficient are responsible for the much worse electrochemical performance of sample H. The diffusion coefficient of Li+, which is two orders of magnitude lower for sample H, revealed by the EIS, is actually attributed to its much higher film and charge transfer resistances. Therefore, carbon coating not only plays a crucial role in the formation of solid electrolyte interface (SEI) films, and thus SEI film resistance and charge transfer resistance, but also in the diffusion of Li+, which is significantly influenced by the electronic conductivities. However, sample H still showed better performance among all the samples without carbon coating as mentioned above. This implies that better electronic conductivities of LiFePO4 nanorods themselves involved in sample H.
| Samples | Rs (Ω) | R1 (Ω) | R2 (Ω) | D (cm2 s−1) |
|---|---|---|---|---|
| H | 2.80 | 92.00 | 279.60 | 2.65 × 10⁻¹⁶ |
| G | 0.80 | 1.06 | 59.88 | 1.40 × 10⁻¹⁴ |
It is generally recognized that the antisite defects in LiFePO4, especially the occupation of Li by Fe, are considered to deteriorate its electrochemical properties due to the blocking effect of Fe in the channels upon Li+ insertion and extraction. However, both the samples H and G reported here have better electrochemical performance, especially higher power densities compared to those samples without and with coated carbon, respectively, which appears to contradict this recognition. Thus, there might be some ways to realize the excellent rate capability and high power of sample G in the presence of Fe–Li antisite defects. (i) Fe is not uniformly distributed in the Li channels but is rather segregated in few channels, and thus the antisite defect has no significant influence on the performance.41,61,62 (ii) A rearrangement of local structure takes place through the site exchange of Fe at the Li site and Li at the Fe site during charging, especially at a low rate. As a consequence, the FeLi defects would be finally removed.63 (iii) The negative effect caused by the Fe at the Li site is counteracted by the positive effect arising from the doping of Li into the Fe site, i.e. so-called self-doping, by increasing the number of polarons in LiFePO4.64 Therefore, the superior rate capability and high discharge voltages of sample G at high rates can be ascribed to not only the nanoscale size along [010] and the uniform carbon coating of LiFePO4 nanorods, but the partial occupation of Li at the Fe site. For sample H without carbon coating, the interplay of the nanoscale size along [010] and the partial occupation of Li at the Fe site are responsible for the relatively better electrochemical performance. The nanoscale rods of LiFePO4 were formed as a result of tetraglycol as surfactant. The high viscosity of tetraglycol not only determines the morphology and size of LiFePO4, but also influences the diffusion processes and kinetics of all the chemical species involved in the reactions, and thus the formation of the Fe–Li antisite defects at a certain temperature. Thus, it is probable to optimize the electrochemical performance of LiFePO4 by suppressing the occupation of Fe at the Li site and maintaining the moderate occupation of Li at the Fe site through carefully controlling the synthesis recipes, such as the content of tetraglycol, temperature, and reaction time. Therefore, this study opens up a way to enhance the electrochemical performance of LiFePO4 by incorporating a certain amount of Li into the Fe site. Further investigations on the precise control of defects are underway.
4. Conclusions
High power and superior rate capability LiFePO4 nanorods were synthesized via the hydrothermal method with tetraglycol as a surfactant at a temperature as low as 140 °C, followed by carbon coating with glucose as a carbon source. The high viscosity of tetraglycol plays a key role in the morphology and size of LiFePO4 and the formation of Fe–Li antisite defects. About 3% FeLi and 7% LiFe antisite defects are present in the as-synthesized, annealed and carbon coated LiFePO4, and the FeLi antisite defects do not deteriorate the superior electrochemical capability. The excellent rate capability and small polarizations result from not only the nanoscale size along [010] and the uniform carbon coating of the LiFePO4 nanorods but also from the partial occupation of Li at the Fe sites. Very high power densities due to high discharge voltages, such as 95.4 and 96.5 kW kg−1 at 200 C at RT and 60 °C with only 10 wt% conductive additive, respectively, were achieved, and superior rate performance, such as an energy density of 270.0 W h kg−1 and 43.0 kW kg−1 at 85 C at RT, 310 W h kg−1 and 49.8 kW kg−1 at 96 C at 60 °C were also achieved. 95% and 92% discharge capacity retentions after 200 cycles at the charge and discharge rates of 50 and 100 C for the carbon coated LiFePO4/C nanorods with glucose as carbon source was obtained. This work developed a simple, controllable and up-scalable recipe for synthesizing very high power LiFePO4 nanorods with superior rate capability using a suitable surfactant and carbon coating with proper carbon sources. We anticipate that this work will particularly stimulate the pursuit of high power LiFePO4. The availability of an excellent cycling capability at both high charge and discharge rates further promotes its applications for large current demands such as in electric and hybrid electric vehicles.Acknowledgements
This work is financially supported by the sub-project “Exploration of novel cathode materials for lithium ion battery as highly efficient energy storage”, the project “Design and Research on the Key Technology of Photovoltaic Demonstration Base”, and the Knowledge Innovation Program of the Chinese Academy of Sciences, and the Strategic Priority Research Program of the Chinese Academy of Sciences, grant no. XDA09040101.Notes and references
- K. Padhi, K. S. Nanjundaswamy and J. B. Goodenough, J. Electrochem. Soc., 1997, 144, 1188 CrossRef PubMed.
- R. Malik, A. Abdellahi and G. Ceder, J. Electrochem. Soc., 2013, 160, A3179 CrossRef CAS PubMed.
- W. J. Zhang, J. Power Sources, 2011, 196, 2962 CrossRef CAS PubMed.
- J. Chong, S. D. Xun, X. Y. Song, P. Ridgwaya, G. Liu and V. S. Battaglia, J. Power Sources, 2012, 200, 67 CrossRef CAS PubMed.
- Y. S. Hu, Y. G. Guo, R. Dominko, M. Gaberscek, J. Jamnik and J. Maier, Adv. Mater., 2007, 19, 1963 CrossRef CAS.
- F. Cheng, S. Wang, A. H. Lu and W. C. Li, J. Power Sources, 2013, 229, 249 CrossRef CAS PubMed.
- Y. M. Wu, Z. H. Wen and J. H. Li, Adv. Mater., 2011, 23, 1126 CrossRef CAS PubMed.
- X. L. Wu, L. Y. Jiang, F. F. Cao, Y. G. Guo and L. J. Wan, Adv. Mater., 2009, 21, 2710 CrossRef CAS.
- F. Q. Cheng, W. Wan, Z. Tan, Y. Y. Huang, H. H. Zhou, J. T. Chen and X. X. Zhang, Electrochim. Acta, 2011, 56, 2999 CrossRef CAS PubMed.
- A. Vu and A. Stein, J. Power Sources, 2014, 245, 48 CrossRef CAS PubMed.
- S. W. Oh, S. T. Myung, S. M. Oh, K. H. Oh, K. Amine, B. Scrosati and Y. K. Sun, Adv. Mater., 2010, 22, 4842 CrossRef CAS PubMed.
- C. M. Doherty, R. A. Caruso and C. J. Drummond, Energy Environ. Sci., 2010, 3, 813 CAS.
- M. Wagemaker, D. P. Singh, W. J. H. Borghols, U. Lafont, L. Haverkate, V. K. Peterson and F. M. Mulder, J. Am. Chem. Soc., 2011, 133, 10222 CrossRef CAS PubMed.
- R. Malik, D. Burch, M. Bazant and G. Ceder, Nano Lett., 2010, 10, 4123 CrossRef CAS PubMed.
- C. W. Sun, S. Rajasekhara, J. B. Goodenough and F. Zhou, J. Am. Chem. Soc., 2011, 133, 2132 CrossRef CAS PubMed.
- W. Dreyer, J. Jamnik, C. Guhlke, R. Huth, J. Moškon and M. Gaberšček, Nat. Mater., 2010, 9, 448 CrossRef CAS PubMed.
- J. A. Gerbec, D. Morgan, A. Washington and G. F. Strouse, J. Am. Chem. Soc., 2005, 127, 15791 CrossRef CAS PubMed.
- S. L. Yang, X. F. Zhou, J. G. Zhang and Z. P. Liu, J. Mater. Chem., 2010, 20, 8086 RSC.
- K. T. Lee and J. Cho, Nano Today, 2011, 6, 28 CrossRef CAS PubMed.
- H. M. Xie, R. S. Wang, J. R. Ying, L. Y. Zhang, A. F. Jalbout, H. Y. Yu, G. L. Yang, X. M. Pan and Z. M. Su, Adv. Mater., 2006, 18, 2609 CrossRef CAS.
- J. B. Goodenough and K. S. Park, J. Am. Chem. Soc., 2013, 135, 1167 CrossRef CAS PubMed.
- D. Morgan, A. V. Ven and G. Ceder, Electrochem. Solid-State Lett., 2004, 7, A30 CrossRef CAS PubMed.
- P. Axmann, C. Stinner, M. W. Mehrens, A. Mauger, F. Gendron and C. M. Julien, Chem. Mater., 2009, 21, 1636 CrossRef CAS.
- J. J. Chen and M. S. Whittingham, Electrochem. Commun., 2006, 8, 855 CrossRef CAS PubMed.
- K. M. Ø. Jensen, M. Christensen, H. P. Gunnlaugsson, N. Lock, E. D. Bøjesen, T. Proffen and B. B. Iversen, Chem. Mater., 2013, 25, 2282 CrossRef CAS.
- B. Ellis, W. H. Kan, W. R. M. Makahnouk and L. F. Nazar, J. Mater. Chem., 2007, 17, 3248 RSC.
- X. Qin, J. Wang, J. Xie, F. Z. Li, L. Wen and X. H. Wang, Phys. Chem. Chem. Phys., 2012, 14, 2669 RSC.
- J. M. Tarascon, N. Recham, M. Armand, J. N. Chotard, P. Barpanda, W. Walker and L. Dupont, Chem. Mater., 2010, 22, 724 CrossRef CAS.
- S. Y. Chung, J. T. Bloking and Y. M. Chiang, Nat. Mater., 2002, 1, 123 CrossRef CAS PubMed.
- F. Omenya, N. A. Chernova, S. Upreti, P. Y. Zavalij, K. W. Nam, X. Q. Yang and M. S. Whittingham, Chem. Mater., 2011, 23, 4733 CrossRef CAS.
- M. Vujković, D. Jugović, M. Mitrić, I. Stojkovica, N. Cvjetićanin and S. Mentus, Electrochim. Acta, 2013, 109, 835 CrossRef PubMed.
- M. Wagemaker, B. L. Ellis, D. Lützenkirchen-Hecht, F. M. Mulder and L. F. Nazar, Chem. Mater., 2008, 20, 6313 CrossRef CAS.
- B. Rehani, P. B. Joshi, K. N. Lad and A. Pratap, Indian J. Pure Appl. Phys., 2006, 44, 157 CAS.
- I. D. Brown, Chem. Soc. Rev., 1978, 7, 359 RSC.
- M. Nespolo, G. Ferraris and H. Ohashi, Acta Crystallogr., Sect. B: Struct. Sci., 1999, B55, 902 CAS.
- J. J. Chen, S. J. Wang and M. S. Whittingham, J. Power Sources, 2007, 174, 442 CrossRef CAS PubMed.
- F. Brochu, A. Guer, J. Trottier, M. Kope, A. Mauger, H. Groult, C. M. Julien and K. Zaghib, J. Power Sources, 2012, 214, 1 CrossRef CAS PubMed.
- H. Zhang, Y. H. Tang, J. Q. Shen, X. G. Xin, L. X. Cui, L. J. Chen, C. Y. Ouyang, S. Q. Shi and L. Q. Chen, Appl. Phys. A: Mater. Sci. Process., 2011, 104, 529 CrossRef CAS.
- S. Y. Chung, S. Y. Choi, S. Lee and Y. C. Ikuhara, Phys. Rev. Lett., 2012, 108, 195501 CrossRef.
- M. S. Islam, D. J. Driscoll, C. A. J. Fisher and P. R. Slater, Chem. Mater., 2005, 17, 5085 CrossRef CAS.
- J. Lee, W. Zhou, J. C. Idrobo, S. J. Pennycook and S. T. Pantelides, Phys. Rev. Lett., 2011, 107, 085507 CrossRef.
- S. Y. Chung, S. Y. Choi, T. Yamamoto and Y. Ikuhara, Angew. Chem., Int. Ed., 2009, 48, 543 CrossRef CAS PubMed.
- S. P. Badi, M. Wagemaker, B. L. Ellis, D. P. Singh, W. J. H. Borghols, W. H. Kan, D. H. Ryan, F. M. Mulder and L. F. Nazar, J. Mater. Chem., 2011, 21, 10085 RSC.
- S. Hamelet, P. Gibot, M. C. Cabanas, D. Bonnin, C. P. Grey, J. Cabana, J. B. Leriche, J. R. Carvajal, M. Courty, S. Levasseur, P. Carlach, M. V. Thournout, J. M. Tarascon and C. Masquelier, J. Mater. Chem., 2009, 19, 3979 RSC.
- J. J. Chen and J. Graetz, ACS Appl. Mater. Interfaces, 2011, 3, 1380 CAS.
- K. M. Ø. Jensen, H. P. Gunnlaugsson, M. Christensen and B. B. Iversen, Hyperfine Interact., 2013, s10751, 0992 Search PubMed.
- B. Hannoyer, A. A. M. Prince, M. Jean, R. S. Liu and G. X. Wang, Hyperfine Interact., 2006, s10751, 9354 Search PubMed.
- C. M. Julien, K. Zaghib, A. Mauger and H. Groult, Adv. Chem. Eng. Sci., 2012, 2, 321 CrossRef CAS.
- K. Zaghib, J. Trottier, A. Mauger, H. Groult and C. M. Julien, Int. J. Electrochem. Sci., 2013, 8, 9000 CAS.
- M. Y. Cho, K. B. Kim, J. W. Lee, H. Kim, H. Kim, K. Kang and K. C. Roh, RSC Adv., 2013, 3, 3421 RSC.
- B. Jin and H. B. Gu, Solid State Ionics, 2008, 178, 1907 CrossRef CAS PubMed.
- X. L. Wu, Y. G. Guo, J. Su, J. W. Xiong, Y. L. Zhang and L. J. Wan, Adv. Energy Mater., 2013, 3, 1155 CrossRef CAS.
- K. Dokko, S. Koizumi, H. Nakano and K. Kanamura, J. Mater. Chem., 2007, 17, 4803 RSC.
- X. M. Liu, P. Yan, Y. Y. Xie, H. Yang, X. D. Shen and Z. F. Ma, Chem. Commun., 2013, 49, 5396 RSC.
- L. Wang, X. M. He, W. T. Sun, J. L. Wang, Y. D. Li and S. S. Fan, Nano Lett., 2012, 12, 5632 CrossRef CAS PubMed.
- B. Kang and G. Ceder, Nature, 2009, 458, 190 CrossRef CAS PubMed.
- J. Y. Song and M. Z. Bazant, J. Electrochem. Soc., 2013, 160, A15 CrossRef CAS PubMed.
- Y. Zhao, L. L. Peng, B. R. Liu and G. H. Yu, Nano Lett., 2014, 14, 2849 CrossRef CAS PubMed.
- H. B. Shu, X. Y. Wang, W. C. Wen, Q. Q. Liang, X. K. Yang, Q. L. Wei, B. A. Hu, L. Liu, X. Liu, Y. F. Song, M. Zho, Y. S. Bai, L. L. Jiang, M. F. Chen, S. Y. Yang, J. L. Tan, Y. Q. Liao and H. M. Jiang, Electrochim. Acta, 2013, 89, 479 CrossRef CAS PubMed.
- Y. Wang and G. Z. Cao, Adv. Mater., 2008, 20, 2251 CrossRef CAS.
- S. Y. Chung, S. Y. Choi, T. Yamamoto and Y. Ikuhara, Phys. Rev. Lett., 2008, 100, 125502 CrossRef.
- F. Omenya, N. A. Chernova, Q. Wang, R. B. Zhang and M. S. Whittingham, Chem. Mater., 2013, 25, 2691 CrossRef CAS.
- S. Hamelet, M. C. Cabanas, L. Dupont, C. Davoisne, J. M. Tarascon and C. Masquelier, Chem. Mater., 2011, 23, 32 CrossRef CAS.
- K. Zaghib, A. Mauger, J. B. Goodenough, F. Gendron and C. M. Julien, Chem. Mater., 2007, 19, 3740 CrossRef CAS.
Footnote |
| † Electronic supplementary information (ESI) available. See DOI: 10.1039/c4ra09776a |
| This journal is © The Royal Society of Chemistry 2015 |

