Size-controlled synthesis of mesoporous Nb2O5 microspheres for dye sensitized solar cells†
Xiujuan Jin,
Chenliang Liu,
Jing Xu,
Qiufan Wang and
Di Chen*
Wuhan National Laboratory for Optoelectronics and School of Optical and Electronic Information, Huazhong University of Science and Technology, Wuhan 430074, China. E-mail: dichen@mail.hust.edu.cn; Fax: +86 27 87792225
First published on 1st August 2014
Abstract
Mesoporous Nb2O5 microspheres assembled by nanoparticles are successfully synthesized through a simple solvothermal process and subsequently annealing treatment, free of any template or catalyst. By controlling the reactant NbCl5 concentration, we could easily tune the diameter of the Nb2O5 spheres from 200 to 900 nm, which were also used to fabricate dye-sensitized solar cells. Studies found that dye-sensitized solar cells based on Nb2O5 with sizes of around 480 nm show a highest power conversion efficiency of 2.97% with a relatively high short current density (Jsc) of 6.8 mA cm−2 and an open circuit voltage (Voc) of 0.738 V, which benefits from its higher specific surface area for adsorbing more dye molecules, superior light scattering capacity for boosting the light-harvesting efficiency, and modest electron transport properties.
1 Introduction
Dye-sensitized solar cells (DSSCs) as a promising alternative to silicon-based cells have attracted lots of attention due to their tunable optical properties, such as colour and transparency, minimal environmental impact, low cost, facile fabrication process, short energy payback time, and comparable performance under most operating conditions.1–4 The performance of DSSC, measured in terms of power conversion efficiency, depends closely on the light harvesting efficiency, the transport of the photoinjected electrons through the semiconductor electrode, and the dynamics of interfacial losses resulting from the possible recombination of electrons with the electrolyte. Till now, much research has been conducted to enhance the efficiency of the DSSCs. With the main intention of improving the light harvesting efficiency, mesoporous spheres have been successfully introduced as photoanodes fabricated from TiO2 and attained excellent results in DSSCs.5–7 The mesoporous spheres aggregated from nanoparticles with tunable porous structure, ensuring a large specific surface area, are beneficial to load dye. Meanwhile, the spheres with a proper submicrometer size are suitable to be employed as light scattering layer to enhance optical absorption. Therefore, this structure is promising to function as dye adsorption layer as well as light scatterers layer to improve performance in DSSCs. Besides, porous structure and size would have an influence on electron transport property. A high power conversion efficiency of cells would be obtained only with the balance between light harvesting efficiency and the electron transport and recombination, by tuning the size and pores distribution of mesoporous spheres.As a typical wide band gap metal oxide, TiO2 has been widely used in DSSCs photoanode and achieved more than 12% power conversion efficiency. Besides TiO2, other semiconductor metal oxides such as ZnO, Nb2O5, SnO2, SrTiO3, Zn2SnO4, and other composites have also been investigated as potential alternatives to TiO2.8–13 Among these, Nb2O5 could be a suitable candidate in views of its wider band gap ranging between 3.2 and 4 eV, more negative conduction band edge position relative to TiO2, comparable electron injection efficiency, as well as better chemical stability. It is expected that DSSCs assembled with Nb2O5 photoanode would attain a higher open circuit voltage and power conversion efficiency.14,15 To date, Nb2O5 with various nanostructures including nanoparticles, nanobelts, nanorods, nanowires, nanotubes, nanoporous networks and nanoforests have been synthesized by hydrothermal method, electrospinning technique, electrochemical anodization method and pulsed laser deposition (PLD).14–21 Nevertheless, to the best of our knowledge, mesoporous Nb2O5 microspheres from a mild hydrothermal process without the existance of the strong acid or alkaline environment were few reported.
Here, we reported a facile solvothermal method, free of any template and catalyst to synthesize mesoporous Nb2O5 microspheres with tunable size ranging from 200–900 nm. The synthesized microspheres were characterized by SEM, TEM, SAED, XRD, FTIR and BET, respectively. The spheres based DSSCs with various sizes have also been studied. Results show that Nb2O5 microspheres with diameter of around 480 nm display a best DSSCs performance when assembled into the photoanode.
2 Experiment details
All the reagents used in the experiment were as received without further purification.2.1. Synthesis of mesoporous Nb2O5 microspheres
Firstly, different amounts of niobium(V) chloride (NbCl5, Alfa, 99.9% purity) were dissolved in ethanol (25 mL) in a 50 mL Teflon-lined stainless steel autoclave (0.3, 0.42, 0.5 g NbCl5 for samples S1, S2, and S3, respectively). After stirring for 5 min, the autoclave was sealed and heated to 200 °C for 24 h. The white precipitates were collected, washed with deionized water and ethanol for several times and allowed to dry in air at 80 °C. Then the obtained precipitates were calcined at 550 °C for 2 h in air to obtain the mesoporous Nb2O5 beads.2.2. Preparation of the DSSCs working electrodes
To prepare the photoanodes of DSSCs, the synthesized porous Nb2O5 beads, ethyl cellulose, and terpineol with a mass ratio of 1![[thin space (1/6-em)]](https://www.rsc.org/images/entities/char_2009.gif) :
:![[thin space (1/6-em)]](https://www.rsc.org/images/entities/char_2009.gif) 5
5![[thin space (1/6-em)]](https://www.rsc.org/images/entities/char_2009.gif) :
:![[thin space (1/6-em)]](https://www.rsc.org/images/entities/char_2009.gif) 4, respectively, were added into ethanol under stirring to form slurry. This mixture was then ultrasonicated to make it homogeneous by using an ultra-sonic horn for several minutes, and sequently evaporated by rotary-evaporator at 40 °C until a viscous paste was produced. The paste was screen-printed onto fluorine-doped tin oxide (FTO) coated glass with an active area of 0.196 cm2. The resulting films were sintered at 550 °C for 1 h, then soaked with an absolute ethanol solution containing 0.5 mM Ruthenizer 535 bis-TBA (N719 dye, Solaronix) for 24 h at room temperature.
4, respectively, were added into ethanol under stirring to form slurry. This mixture was then ultrasonicated to make it homogeneous by using an ultra-sonic horn for several minutes, and sequently evaporated by rotary-evaporator at 40 °C until a viscous paste was produced. The paste was screen-printed onto fluorine-doped tin oxide (FTO) coated glass with an active area of 0.196 cm2. The resulting films were sintered at 550 °C for 1 h, then soaked with an absolute ethanol solution containing 0.5 mM Ruthenizer 535 bis-TBA (N719 dye, Solaronix) for 24 h at room temperature.
After being washed with ethanol for several times, the sensitized working electrodes were assembled and sealed with the counter electrodes using a 25 μm thick Surlyn gasket to produce sandwich type cells. The counter electrodes were prepared by dropping the absolute ethanol solution containing 5 mM H2PtCl6 onto the FTO glass with subsequent heat treatment at 400 °C for 15 min under air. The electrolyte, 1.0 M 1,2-dimethyl-3-propylimidazolium iodide (DMPII), 0.1 M LiI, 0.12 M I2, and 0.5 M 4-TBP in methoxypropionitrile, was introduced into the cell via a vacuum filling method.
2.3. Characterization
Morphologies of the samples were observed by using a field emission scanning electron microscopy (SEM, FEI Sirion 200 and JEOL JSM 6700F) and high-resolution transmission electron microscopy (TEM) images and selected-area electron diffraction (SAED) patterns were taken with a Philips CM 200 FEG TEM. X-Ray diffraction (XRD, X'Pert PRO with Cu Kα radiation) was used to verify crystal phase. FTIR analysis of the samples was performed using a VERTEX 70 FT-IR spectrometer. Nitrogen adsorption–desorption were measured by using a ASAP 2020 accelerated surface area and porosimetry system at −196 °C. Brunauer–Emmett–Teller (BET) method was used to calculate the specific surface area. The pore size distributions of the materials were derived from the adsorption branches of the isotherms based on the Barett–Joyner–Halenda (BJH) model. The Nb2O5 film thickness was measured using a profilometer (Dektak 150, Veeco Instruments Inc). The amount of dye loading was determined by desorbing the dye molecules from the sensitized photoanode films in 0.1 M NaOH ethanol solution and measuring the adsorption peak intensity of N719 at 515 nm with a spectrophotometer (Shimadzu UV-2550). Diffuse reflectance spectra of the films were recorded on a Shimadzu UV-2550 spectrophotometer equipped with an integrating sphere.2.4. Measurements
The current–voltage characteristics were measured using a Keithley 2400 Source Metre under the illumination of simulated sunlight (100 mW cm−2) provided by a solar simulator with an AM 1.5G filter (Oriel, model 91192). Incident photon-to-current conversion efficiency (IPCE) as a function of wavelength was measured on the basis of a Newport Apex Monochromator illuminator (model 7010 4). Intensity modulated photovoltage spectroscopy (IMVS) and intensity modulated photocurrent spectroscopy (IMPS) measurements were carried out on a electrochemical workstation (Zahner, Zennium) with a frequency response analyzer under a diode laser light source with tunable intensity at 525 nm, which can provide both dc and ac components of the illumination. The modulated light intensity was 10% or less than the base light intensity. The frequency range was set from 100 KHz to 0.1 Hz.3 Results and discussion
Mesoporous Nb2O5 microspheres with various diameters were prepared from the facile solvothermal process and subsequent heating treatment. As an example, S1 synthesized with 0.3 g NbCl5 dissolved in ethanol (25 mL) has been characterized. The XRD patterns of the synthesized Nb2O5 spheres and the precursors are shown in Fig. 1a. It reveals that the synthesized precursors are amorphous without obvious characteristic diffraction peaks. When calcined at 550 °C for 2 h, high crystalline Nb2O5 samples were obtained. And all the peaks can be readily indexed to the hexagonal Nb2O5 with lattice parameters of a = 3.607 Å, c = 3.925 Å (JCPDS no. 7-61) and without impurity peaks detected. Fig. 1b shows the SEM image of the precursors. It is observed that, spherical precursors with diameter range from 200–300 nm were firstly synthesized from the solvothermal process. After calcined, spherical Nb2O5 samples with similar size were obtained as shown in Fig. 1c and d. TEM images clearly show that spherical Nb2O5 samples are porous and composed of nanocrystals (dozens of nanometers). Furthermore, Fig. 1e shows the HRTEM image of sample, the clear crystal fringes with a lattice spacing of d = 2.446 Å can be ascribed to (101) planes of hexagonal Nb2O5, corresponding well with XRD analysis. The concentric circles composed of bright dots in the SAED pattern (Fig. 1f) confirms the polycrystalline structure of the Nb2O5 spheres.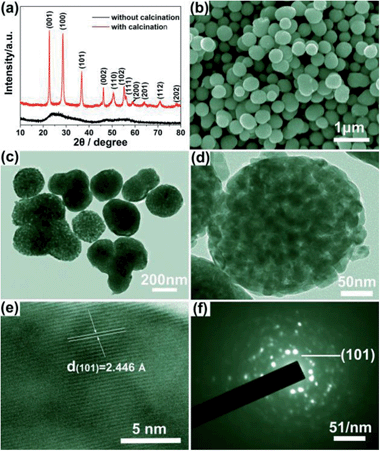 | ||
| Fig. 1 (a) XRD pattern, (b) SEM image, (c and d) TEM images, (e) HRTEM image and (f) SAED pattern of the Nb2O5 microspheres (S1). | ||
The structure transformation of spheres caused by the calcination is also confirmed by the Fourier transform infrared spectroscopy (FTIR) and thermogravimetric analysis (TGA), respectively. FTIR spectrum of the as-synthesized precursor as shown in Fig. 2a clearly exhibits a broad absorption peak at ∼3400 cm−1, which could be associated with the asymmetric and symmetric stretching vibrations of the –OH group of absorbed water molecules and the surface hydroxyls as well as the ethylene glycol units. And a sharp peak at 1626 cm−1 can also be assigned to the bending vibrations of the water molecules.22–24 A broad band centered at 605 cm−1 can be assigned to symmetric stretching of the niobium polyhedral.25 After calcination treatment, all peaks disappeared except for the Nb–O band at 605 cm−1 in Fig. 2b. Besides, a new peak at 812 cm−1 can be found, which marks the formation of hexagonal structure. The TG curve (inset of Fig. 2) recorded in air indicates a two-step pattern for weight loss of the precursor. From room temperature to 110 °C, the weight loss of 5% corresponds to desorption of physically adsorbed water molecules. The weight loss of 10% from 110 to 450 °C is associated with the removal of ethylene glycol units and the degradation of organic groups contained in the precursor particles.23 These observations confirm the removal of OH group and the formation of Nb2O5 crystalline phase from the amorphous structure at 550 °C. And higher calcination temperature would lead to a phase transformation and an reduction in BET. Based on the above analysis, the formation mechanism of the mesoporous Nb2O5 microspheres could be concluded as following: first is the hydrolysis of NbCl5 in ethanol and the formation of amorphous particles in the solvothermal process. Then, with the increasing of reaction time, particles aggregated each other into microspheres resulting in the formation of amorphous precursors. Finally, the precursors were further transferred into crystalline phase with annealing treatment. At the same time, organic groups were removed and mesoporous structures were left. The possible formation process of mesoporous Nb2O5 spheres is schematically illustrated in Fig. 3.
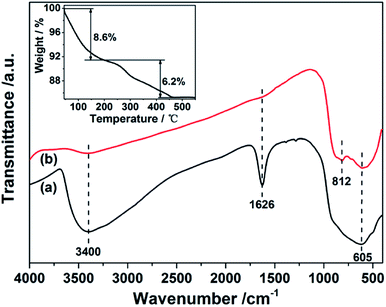 | ||
| Fig. 2 FTIR spectra of the precursor S1 (a) and calcined mesoporous Nb2O5 beads at 550 °C for 2 h. The inset of TG curve of the precursor S1. | ||
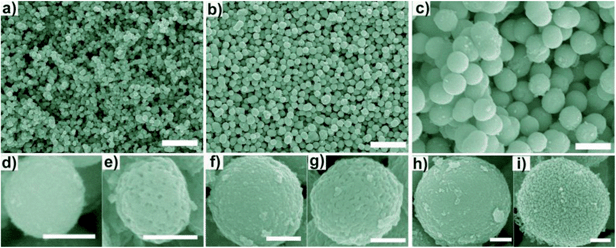
During the preparation process, it was found that the initial reactant concentration had an obvious influence on the size and microstructure of the samples. As shown in Fig. 4a–c, by varying the amount of NbCl5 from 0.3 to 0.5 g, three spherical precursors with the diameters ranging from 200 to 900 nm were prepared without changing the current procedure. Fig. 4d, f and h further show high SEM images of the precursors, respectively. After calcined, mesoporous spheres with the diameters of about 220 nm, 480 nm and 900 nm were synthesized and the corresponding samples were assigned to S1 (Fig. 4e), S2 (Fig. 4g), and S3 (Fig. 4i), respectively. These synthesized products consisting of a large quantity of nanoparticles show mesoporous structure, which are quite different from the precursors. XRD patterns shown in Fig. S1a–d† further confirm that amorphous niobium glycolates have been fully transformed into hexagonal Nb2O5. Obviously, the size of spheres increases with the increase of the NbCl5 concentration, which can be well explained by the mechanism of nucleation and growth. As some literatures reported,26–29 with the increase of reactant concentration, the hydrolysis rate accelerated resulting in the higher rate of nucleation. At the same time, the growth rate of crystallite is suppressed at certain degree leading to the formation of particles with smaller size. Then the aggregation rate of particles increased and larger microspheres were prepared with the increasing of reactant concentration.
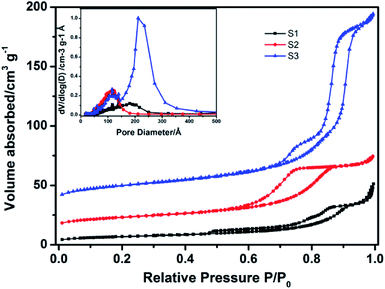
The specific surface areas and porous nature of three as-prepared mesoporous Nb2O5 microspheres were further investigated by nitrogen adsorption–desorption measurements, as shown in Fig. 5. Type IV isotherms with a substantial hysteresis loop in the P/P0 range above 0.6 indicate the mesoporous structure of samples.30,31 Table 1 further summarized the tendency for the specific areas of samples enlarging as a function of reactant concentration. The specific areas of S1, S2, S3 are 23.3 m2 g−1, 44.9 m2 g−1 and 67.7 m2 g−1, respectively. In general, a smaller size would result in a bigger BET surface area. Among three samples, sample S3 with the largest diameter shows the highest BET surface area, which is owing to its mesoporous structure. For sample S3, typical isotherm with two major capillary condensation steps at relative pressure P/P0 ranges 0.75–0.85 and 0.85–0.95 were observed, which also indicated the characteristic of hierarchical porous structure.32,33 Moreover, the pore size distribution curve (inset in Fig. 5) shows that the primary and secondary pore diameters are centered at 12 and 21 nm, respectively, indicating that the materials have unique hierarchical porous structures on at least two levels, and the majority of the available surface area is due to the presence of the mesopore at 21 nm. With the interesting mesoporous structure, the as-synthesized Nb2O5 spheres are promising to function as dye adsorption layer as well as light scatterers layer to improve performance in DSSCs.
| Devices | Voc (V) | Jsc (mA cm−2) | FF (%) | η (%) | Thickness (μm) | BET (m2 g−1) |
|---|---|---|---|---|---|---|
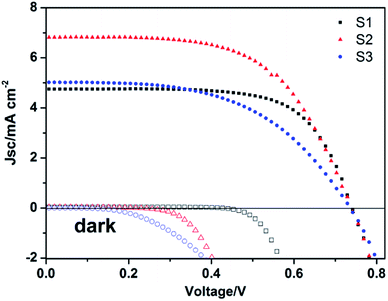
| S1 | 0.754 | 4.74 | 67.9 | 2.43 | 8 | 23.3 |
| S2 | 0.738 | 6.81 | 58.9 | 2.97 | 8.5 | 44.9 |
| S3 | 0.721 | 5.01 | 52.4 | 1.89 | 7.5 | 67.7 |
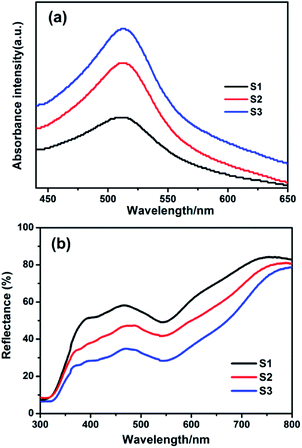
To investigate the potential applications of the mesoporous Nb2O5 microspheres in DSSCs, Nb2O5 films as working electrodes were prepared with various sizes using screen-printing technique. The films were subsequently annealed at 500 °C for 30 min in air to improve the contact between the microspheres and the FTO substrate and remove organic compounds added in paste. Then, as-prepared electrodes were sensitized with 0.5 mM N719 dye for 24 h. The amount of dye loading was determined by desorbing the dye molecules from the sensitized photoanode films in 0.1 M NaOH ethanol solution and measuring the adsorption spectra as shown in Fig. 6a. Obviously, the adsorbing capacity of Nb2O5 microspheres increased with the increased size, which is agreed well with the obtained specific surface area calculated from the BET analysis. The diffuse reflectance spectra of sensitized photoanode films with N719 were also brought (Fig. 6b). The reflectance of the sensitized films were drastically reduced at about 540 nm caused by the dye adsorption. Moreover, a red shift of about 25 nm were distinctively observed relative to the maximum absorption peak (∼515 nm) of N719 dye (Fig. 6a), which were owed to the efficient light scattering of the microspheres. Similar phenomena were also observed by Park et al.34 Accordingly, Nb2O5 microspheres with larger BET surface area exhibit a higher dye adsorption ability, leading to an enhancement in the absorption of solar light. Thus, together with the efficient light scattering, the microspheres would yield an improvement in the light harvesting efficiency associated to photocurrent.
Subsequently, the photovoltaic properties of three different photoanodes were tested. The photocurrent density–voltage (J–V) characteristics were measured under standard AM 1.5 illumination with a power density of 100 mW cm−2. The corresponding results are shown in Fig. 7, and the detailed photovoltaic parameters are summarized in Table 1. The fill factor (FF) and power conversion efficiency (η) were determined by the following equations.
| FF = Vm· Jm/Voc · Jsc | (1) |
| η = Voc · Jsc · FF/Pin | (2) |
The differences in photocurrent density of these three solar cells were further investigated by measuring the incident-photon-to-collected-electron efficiency (IPCE) spectra as a function of wavelength, and the results are exhibited in Fig. 8. The photocurrent density Jsc and IPCE under each wavelength of radiation can be expressed by the following equations:39–41
| Jsc(λ) = qηIPCE(λ)I0 | (3) |
| ηIPCE(λ) = ηlh(λ)ηinj(λ)ηcc(λ) | (4) |
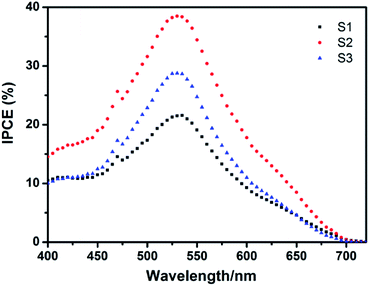 | ||
| Fig. 8 Incident photon to current conversion efficiency (IPCE) curves of the Nb2O5 electrodes prepared from obtained beads with different sizes. | ||
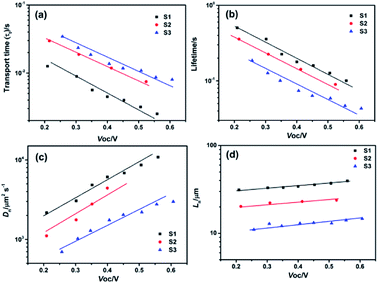
To understand the electron transport and interfacial charge recombination process in these devices, intensity modulated photocurrent/photovoltage spectroscopy (IMPS/IMVS) were performed. The electron transport is determined by diffusion, the lifetime of photon-generated electrons is determined by back reaction with oxidized species in the electrolyte, and the electron diffusion length is determined by the competition between electron transport and back reaction.42–44 In these studies, we used a diode laser light source with tunable intensity at 525 nm, a wavelength close to the absorption peak of N719 dye. Fig. 9 shows the plots of electron transport time (τt), electron lifetime (τn), electron diffusion length (Ln) and diffusion coefficient (Dn) as a function of open-circuit voltage (Voc) obtained at different light intensities, respectively. The electron transport time (τt) can be calculated from the IMPS response by τt = 1/(2πfminIMPS) at short circuit. Correspondingly, the electron lifetime (τn) can be obtained from IMVS by τn = 1/(2πfminIMVS) at open circuit.45 The electron diffusion coefficient (Dn) and electron diffusion length (Ln) are determined from the following expressions: Dn = d2/2.35τt and Ln = (Dnτn)1/2, respectively, where d is the film thickness, and the factor of 2.35 arises from the geometry of the diffusion problem.46,47 In Fig. 9a and b, the τt and τn of the three cells decrease with the more negative Voc. The slower transport rate and larger recombination rate with the increasing microspheres size indicate that trap sites and recombination centers in the microspheres aggregated from nanoparticles increased. The shortened electron lifetime also explained the decreased open circuit voltage from 0.74 V to 0.72 V. In addition, the electron diffusion coefficient and effective diffusion length of the cells were shown in Fig. 9c and d, respectively. Obviously, S1 possesses the quickest diffusion rate and the longest effective diffusion length in three cells. And the Dn and Ln curves of S2 only slightly lower than S1, also shows a good transport property. In contrast, S3 composed of more nanoparticles would have more boundaries and defects, in which the electron could be trapped to some extent during the process of transport, leading to a terrible performance. After considering all the factors above, the higher short circuit current density and power conversion efficiency of S2 can be mainly attributed to the higher specific surface area for adsorbing more dye molecules and superior light scattering capacity for facilitating the light harvesting efficiency compared with S1 as well as modest electron transport rate and recombination time when compared with S3. Hence, a highest photoelectric conversion efficiency of 2.97% was successfully achieved for S2.
4 Conclusion
In summary, by controlling the reactant concentrations, mesoporous Nb2O5 microspheres with various diameters from 200–900 nm were prepared from a mild solution route and post treatment process. Furthermore, the DSSCs based on these Nb2O5 beads with different sizes have also been studied. We received the highest power conversion efficiency of 2.97% by using Nb2O5 with diameter of around 480 nm (S2) as photoanode, with a highest short current density (Jsc) of 6.8 mA cm−2 and a relatively high open circuit voltage (Voc) of 0.738 V. The investigations of IMPS and IMVS reveal that the electron transport and recombination for S2 are slightly inferior to the S1, but obviously superior to the S3 due to affection of the trapping sites and recombination centres. However, high specific surface area and suitable pores, big dye adsorbing amount and light scattering capacity enhanced the light-harvesting efficiency, which is responsible for the improvement of photocurrent. After trading off between the electron transport property and light harvesting efficiency, S2 achieved the highest power conversion efficiency. The results indicate that the synthesized mesoporous Nb2O5 microspheres with appropriate size and pores distribution are efficient photoanode for the dye-sensitized solar cells. Compared to TiO2 as photoanode, the relatively low efficiency might have mainly been attributed to the poor dye loading owing to mismatch between anode materials and dye. Thus, we believed that with proper optimization, the performance of Nb2O5 based DSSCs should be further improved.Acknowledgements
This work was supported by the 973 Program of China (2011CBA00703, 2011CB933300), and the Fundamental Research Funds for the Central Universities (HUST: 2013NY013). We thank the Analytical and Testing Center of Huazhong University Science & Technology and the Center of Micro-Fabrication and Characterization (CMFC) of WNLO for the samples measurements.Notes and references
- B. O'Regan and M. Gräetzel, Nature, 1991, 353, 737 CrossRef.
- M. Gräetzel, Nature, 2001, 414, 338 CrossRef PubMed.
- Z. R. Wang, H. Wang, B. Liu, W. Qiu, J. Zhang, S. Ran, H. Huang, J. Xu, H. Han, D. Chen and G. Z. Shen, ACS Nano, 2011, 5, 8412 CrossRef CAS PubMed.
- A. Hagfeldt, G. Boschloo, L. Sun, L. Kloo and H. Pettersson, Chem. Rev., 2010, 110, 6595 CrossRef CAS PubMed.
- K. Y. Yan, Y. C. Qiu, W. Chen, M. Zhang and S. Yang, Energy Environ. Sci., 2011, 4, 2168 CAS.
- F. Z. Huang, D. H. Chen, X. L. Zhang, R. A. Caruso and Y. B. Cheng, Adv. Funct. Mater., 2010, 20, 1301 CrossRef CAS PubMed.
- T. G. Deepak, G. S. Anjusree, S. Thomas, T. A. Arun, S. V. Nair and A. S. Nair, RSC Adv., 2014, 4, 17615 RSC.
- A. Yella, H. W. Lee, H. N. Tsao, C. Yi, A. K. Handiran, M. K. Nazeeruddin, E. W. G. Diau, C. Y. Yeh, S. M. Zakeeruddin and M. Grätzel, Science, 2011, 334, 629 CrossRef CAS PubMed.
- J. Qian, P. Liu, Y. Xiao, Y. Jiang, Y. Cao, X. Ai and H. Yang, Adv. Mater., 2009, 21, 3663 CrossRef CAS PubMed.
- J.-H. Lee, N.-G. Park and Y.-J. Shin, Sol. Energy Mater. Sol. Cells, 2010, 95, 179 CrossRef PubMed.
- F. Lenzmann, J. Krueger, S. Burnside, K. Brooks, M. Gräetzel, D. Gal, S. Ruehle and D. Cahen, J. Phys. Chem. B, 2001, 105, 6347 CrossRef CAS.
- R. Jose, V. Thavasi and S. Ramakrishna, J. Am. Ceram. Soc., 2009, 92, 289 CrossRef CAS PubMed.
- S. G. Chen, S. Chappel, Y. Diamant and A. Zaban, Chem. Mater., 2001, 13, 4692 CrossRef.
- P. Guo and M. A. Aegerter, Thin Solid Films, 1999, 351, 290 CrossRef CAS.
- A. L. Viet, R. Jose, M. V. Reddy, B. V. R. Chowdari and S. Ramakrishna, J. Phys. Chem. C, 2010, 114, 21795 Search PubMed.
- C. L. Yan and D. F. Xue, Adv. Mater., 2008, 20, 1055 CrossRef CAS PubMed.
- B. Varghese, S. C. Haur and C. T. Lim, J. Phys. Chem. C, 2008, 112, 10008 CAS.
- X. S. Fang, L. F. Hu, K. F. Huo, B. Gao, L. J. Zhao, M. Y. Liao, P. K. Chu, Y. Bando and D. Golberg, Adv. Funct. Mater., 2011, 21, 3907 CrossRef CAS PubMed.
- H. M. Zhang, Y. Wang, D. J. Yang, Y. B. Li, H. W. Liu, P. Liu, B. J. Wood and H. J. Zhao, Adv. Mater., 2012, 24, 1598 CrossRef CAS PubMed.
- J. Z. Ou, R. A. Rani, M. H. Ham, M. R. Field, Y. Zhang, H. D. Zheng, P. Reece, S. Zhuiykov, S. Sriram, M. Bhaskaran, R. B. Kaner and K. Kalantar-zadeh, ACS Nano, 2012, 6, 4045 CrossRef CAS PubMed.
- R. Ghosh, M. K. Brennaman, T. Uher, M. R. Ok, E. T. Samulski, L. E. McNeil, T. J. Meyer and R. Lopez, ACS Appl. Mater. Interfaces, 2011, 3, 3929 CAS.
- X. C. Jiang, T. Herricks and Y. N. Xia, Adv. Mater., 2003, 15, 1205 CrossRef CAS PubMed.
- S. Q. Shang, X. L. Jiao and D. R. Chen, ACS Appl. Mater. Interfaces, 2012, 4, 860 CAS.
- X. F. Chen, X. C. Wang and X. Z. Fu, Energy Environ. Sci., 2009, 2, 872 CAS.
- V. S. Braga, J. A. Dias, S. C. L. Dias and J. L. de Macedo, Chem. Mater., 2005, 17, 690 CrossRef CAS.
- J. Kim, Y. Rheem, B. Yoo, Y. Chong, K. N. Bozhilov, D. Kim, M. J. Sadowsky, H. G. Hur and N. V. Myung, Acta Biomater., 2010, 6, 2681 CrossRef CAS PubMed.
- J. Q. Hu, Z. H. Wen, Q. Wang, X. Yao, Q. Zhang, J. H. Zhou and J. H. Li, J. Phys. Chem. B, 2006, 110, 24305 CrossRef CAS PubMed.
- J. L. Hu, H. S. Qian, Y. Hu, Z. Q. Li, G. X. Tong, T. K. Ying, P. J. Gong, S. Y. Hao, H. B. Zhang and L. C. Li, CrystEngComm, 2012, 14, 7118 RSC.
- H. E. Wang, L. X. Zheng, C. P. Liu, Y. K. Liu, C. Y. Luan, H. Cheng, Y. Y. Li, L. Martinu, J. A. Zapien and I. Bello, J. Phys. Chem. C, 2011, 115, 10419 CAS.
- J. Wang, Y. K. Zhou, Y. Y. Hu, R. O'Hayre and Z. P. Shao, J. Phys. Chem. C, 2011, 115, 2529 CAS.
- Q. F. Wang, B. Liu, X. F. Wang, S. H. Ran, L. M. Wang, D. Chen and G. Z. Shen, J. Mater. Chem., 2012, 22, 21647 RSC.
- M. D. Ye, C. Chen, M. Q. Lv, D. J. Zheng, W. X. Guo and C. J. Lin, Nanoscale, 2013, 5, 6577 RSC.
- Y. Wang, J. He, J. W. Chen, L. B. Ren, B. W. Jiang and J. Zhao, ACS Appl. Mater. Interfaces, 2012, 4, 2735 CAS.
- Y. C. Park, Y. J. Chang, B. G. Kum, E. H. Kong, J. Y. Son, Y. S. Kwon, T. Park and H. M. Jang, J. Mater. Chem., 2011, 21, 9582 RSC.
- J. B. Xia, N. Masaki, K. J. Jiang and S. Yanagida, Chem. Commun., 2007, 138 RSC.
- M. Grätzel, Prog. Photovoltaics, 2000, 8, 171 Search PubMed.
- S. Ito, P. Liska, P. Comte, R. Charvet, P. Péchy, U. Bach, L. Schmidt-Mende, S. M. Zakeeruddin, A. Kay, M. K. Nazeeruddin and M. Grätzel, Chem. Commun., 2005, 4351 RSC.
- G. L. Shang, J. H. Wu, S. Tang, M. L. Huang, Z. Lan, Y. Li, J. C. Zhao and X. P. Zhang, J. Mater. Chem., 2012, 22, 25335 RSC.
- Z. R. Wang, S. H. Ran, B. Liu, D. Chen and G. Z. Shen, Nanoscale, 2012, 4, 3350 RSC.
- J. Halme, P. Vahermaa, K. Miettunen and P. Lund, Adv. Mater., 2010, 22, E210 CrossRef CAS PubMed.
- J. Halme, G. Boschloo, A. Hagfeldt and P. Lund, J. Phys. Chem. C, 2008, 112, 5623 CAS.
- P. E. de Jongh and D. Vanma ekelbergh, J. Phys. Chem. B, 1997, 101, 2716 CrossRef CAS.
- D. S. Zhang, T. Yoshida, T. Oekermann, K. Furuta and H. Minoura, Adv. Funct. Mater., 2006, 16, 1228 CrossRef CAS PubMed.
- J. Krüger, R. Plass, M. Grätzel, P. J. Cameron and L. M. Peter, J. Phys. Chem. B, 2003, 107, 7536 CrossRef.
- K. Zhu, N. R. Neal, A. Miedaner and A. J. Frank, Nano Lett., 2007, 7, 69 CrossRef CAS PubMed.
- K. D. Benkstein, N. Kopidakis, J. van de Lagemaat and A. J. Frank, J. Phys. Chem. B, 2003, 107, 7759 CrossRef CAS.
- J. van de Lagemaat and A. J. Frank, J. Phys. Chem. B, 2001, 105, 11194 CrossRef CAS.
Footnote |
| † Electronic supplementary information (ESI) available: The XRD pattern of the precursor material (sample S1a) and the calcined different sizes mesoporous Nb2O5 beads. See DOI: 10.1039/c4ra06101b |
| This journal is © The Royal Society of Chemistry 2014 |


