 Open Access Article
Creative Commons Attribution 3.0 Unported Licence
Perovskite solar cells involving poly(tetraphenylbenzidine)s: investigation of hole carrier mobility, doping effects and photovoltaic properties†
Katharina Neumann* and
Mukundan Thelakkat*
University of Bayreuth, Macromolecular Chemistry I, Applied Functional Polymers, Makromulekulare Chemie I, 95440 Bayreuth, Germany. E-mail: katharina.neumann@uni-bayreuth.de; mukundan.thelakkat@uni-bayreuth.de; Fax: +49921553109; Tel: +49921553108
First published on 4th September 2014
Abstract
Perovskite solar cells in combination with organic hole transport materials have attracted attention due to their high power conversion efficiencies. Now that these high efficiencies have been reached, it is important to address fundamental questions regarding the requirements of the material properties. Here, we present a detailed study on important properties of the hole transport material such as the influence of the molecular weight, the doping effects on charge carrier mobility and the polarity of the material. A series of poly(tetraphenylbenzidines) (PTPDs) differing in their properties was synthesized via Yamamoto polycondensation. Using space charge limited current (SCLC) measurements, we find that the hole transport mobility is independent of the investigated molecular weight and polarity of the side chains. Doping of the PTPDs with a Co(III)-complex reveals that the charge carrier density increases through an oxidation process. Further, the solar cell performance improves upon doping. After storing the devices, the power conversion efficiencies of the solar cells drastically increase due to improved absorption leading to improved EQE. For example, the best performing cell exhibited a power conversion efficiency of 7.69%. Additionally, the PTPD carrying polar substituents leads to a less pronounced hysteresis effect and a higher stability under illumination compared to the polymer carrying hydrophobic side chains.
1. Introduction
Considerable effort has been made in the field of perovskite solar cells in the last year. Record power conversion efficiencies (PCE) up to 15% have already been reached, for example by a solution based two-step method.1 The perovskite used as light harvesting material is an inorganic–organic hybrid with the structure CH3NH3PbX3 (X = I, Cl, Br). Since the first report of an electrolyte-based perovskite sensitized solar cell in 2009, where 3.8% PCE was reached, impressive improvements of the processing and the design of solid-state perovskite solar cells have been achieved.2 In the previously mentioned reports mesostructured composites, involving titanium dioxide (TiO2) as electron conductor, were used. Moreover, vertically aligned zinc oxide (ZnO) nanorod arrays were also applied.3 However, it is also possible to prepare the perovskite devices only with the perovskite layer sandwiched between a hole blocking and a hole transport layer. This was shown to be highly efficient (PCE = 15.4%) for devices prepared by vapour deposition and very recently for fully solution processed devices with TiO2 blocking layers.4 Further on, a ZnO blocking layer was shown to be a promising alternative for low-temperature preparation of perovskite solar cells.5 Most of the achievements were realized by optimizing the crystallinity of the perovskite layer itself and by a suitable selection of respective hole blocking and hole transport materials.In the majority of the cases, 2,2′,7,7′-tetrakis(N,N-di-p-methoxyphenylamine)-9,9′-spirobifluorene (spiro-MeOTAD) is used as the hole transport layer (HTL) due to its good performance in solid-state dye-sensitized devices based on its processability from solution and suitable HOMO (highest occupied molecular orbital) level. Since spiro-MeOTAD suffers from low conductivity in its pristine form, commonly chemical doping is used to generate additional charge carriers. This is a well-known method to enhance the conductivity of organic semiconductors.6 Burschka et al. reported a Co(III)-complex as a chemical p-dopant which was successfully used for spiro-MeOTAD in perovskite solar cells.1,7 Other suitable organic HTLs for the use in perovskite solar cells are e.g. 2,5-bis(4,4′-bis(methoxyphenyl)aminophen-4′′-yl)-3,4-ethylenedioxy-thiophene, poly(3-hexylthiophene) (P3HT) or low band gap polymers such as poly[N-9-hepta-decanyl-2,7-carbazole-alt-3,6-bis-(thiophen-5-yl)-2,5-dioctyl-2,5-di-hydropyrrolo[3,4-]pyrrole-1,4-dione].8 In a recent study, Heo et al. compared P3HT, poly-[2,1,3-benzothiadiazole-4,7-diyl[4,4-bis(2-ethylhexyl)-4H-cyclopenta[2,1-b:3,4-b]dithiophene-2,6-diyl]] (PCPDTBT), (poly-[[9-(1-octylnonyl)-9H-carbazole-2,7-diyl]-2,5-thiophenediyl-2,1,3-benzothiadiazole-4,7-diyl-2,5-thiophenediyl]) (PCDTBT) and poly(triarylamine) (PTAA) as HTLs in devices with a nanocomposite of mesoporous (mp)-TiO2 and with CH3NH3PbI3 perovskite as active layer.9 They found that PTAA was the most promising hole conductor polymer due to a high fill factor (FF) and a high open circuit voltage (VOC) with a maximum PCE of 12%. In the so far reported studies of PTAA as HTL, the commercially available PTAA with pendant methyl groups was used.10 In this work, the fundamental study concerns with the basic requirements to be fulfilled by such a polymer. For main-chain semicrystalline semiconductor polymers such as P3HT, the charge carrier mobility is dependent on the molecular weight. Initially it increases with molecular weight and after reaching a maximum, decreases for higher molecular weights.11 On the other hand, side-chain triphenylamines (TPAs) did not show a dependence of the mobility on the molecular weight due to their amorphous character.12 In our case, we are dealing with a material which is a main-chain poly(tetraphenylbenzidine) (PTPD) polymer with amorphous character. Therefore, we address the following questions: (1) is there a molecular weight dependence and an optimum molecular weight for charge carrier transport? (2) What is the nature and mechanism of the doping of the PTPD with a Co(III)-complex and what is its effect on charge carrier mobility and the photovoltaic properties? (3) What is the influence of the polarity of the polymer on charge transport and on solar cell performance in CH3NH3PbI3 devices? In this respect, it is important to note that the charge carrier mobility of side-chain poly(perylene bisimide)s changes with the polarity of the substituent considerably.13 Another question of relevance is the effect of storage on solar cell parameters or the life-time in general. In this report, we address these questions using a series of PTPD as hole transport material. The hole transport properties in view of the varied molecular weight distributions, the mechanism of doping and finally the application in perovskite solar cells as well as their long term storage effects are presented.
2. Results and discussion
2.1. Synthesis and polymer characterization
In this section, the synthesis of the PTPD polymers and their characterization regarding the molecular weight as well as thermal and electrochemical properties are described. We report three polymers carrying ethylhexyloxy substitutents (PTPD1-3) and PTPD4 carrying hydrophilic oligo ethylene glycol (OEG) side chains. In the series PTPD1-3 both polydispersity and molecular weights are varied keeping the chemical structure the same. Furthermore, the side chains guarantee a good solubility of the polymers in common solvents such as tetrahydrofuran (THF), chlorobenzene or chloroform. In the case of the polymers with ethylhexyloxy side chains, different molecular weight distributions were investigated. The synthesis of PTPD2-4 was carried out via Yamamoto polycondensation, whereas PTPD1 was obtained via Suzuki polycondensation. The synthesis and a detailed investigation of PTPD1 was published elsewhere.14 In Scheme 1, the structures of PTPD1-4 and the synthetic scheme for the polymers PTPD2-4 is presented. In order to keep the molecular weight deliberately low, a small amount (5 mol%) of a monobrominated TPA end-capper was added during the polycondensation of PTPD2.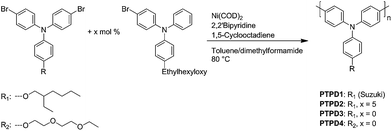 | ||
| Scheme 1 Synthesis of the polymers PTPD2 and PTPD3 with hydrophobic ethylhexyloxy side chains and PTPD4 with hydrophilic oligo ethylene glycol side chains via Yamamoto polycondensation. The molecular weight of PTPD2 was adjusted by the addition of a monobrominated triphenylamine. The synthesis of PTPD1 via Suzuki polycondensation is described elsewhere.14 | ||
Table 1 gives the number average molecular weights (Mn), the weight average molecular weights (Mw) and the polydispersity indices (PDI) obtained from size exclusion chromatography (SEC) measurements in THF calibrated with polystyrene standards. For the hydrophobic polymers, the Mn increases from 10![[thin space (1/6-em)]](https://www.rsc.org/images/entities/char_2009.gif) 330 g mol−1 to 37
330 g mol−1 to 37![[thin space (1/6-em)]](https://www.rsc.org/images/entities/char_2009.gif) 060 g mol−1 for PTPD1 to PTPD3. The hydrophilic PTPD4 has a Mn of 11
060 g mol−1 for PTPD1 to PTPD3. The hydrophilic PTPD4 has a Mn of 11![[thin space (1/6-em)]](https://www.rsc.org/images/entities/char_2009.gif) 000 g mol−1. In differential scanning calorimetry (DSC) measurements the glass transition temperature (Tg) values for PTPD1, PTPD2, and PTPD3 were determined to be 147, 152 and, 157 °C, respectively. PTPD4 shows a lower Tg of 124 °C due to the higher flexibility of the oligo ethylene glycol side chains. In cyclic voltammetry measurements in dichloromethane (DCM) a similar HOMO level of −5.30 eV for all the polymers were found. The HOMO values were calculated from their first oxidation potentials by taking the absolute value of the ferroccene/ferrocenium couple to be −5.16 eV.14 The details of redox potentials, calculation of HOMO levels, SEC and DSC curves are given in the ESI (Table S1,† Fig. S1 and S2†).
000 g mol−1. In differential scanning calorimetry (DSC) measurements the glass transition temperature (Tg) values for PTPD1, PTPD2, and PTPD3 were determined to be 147, 152 and, 157 °C, respectively. PTPD4 shows a lower Tg of 124 °C due to the higher flexibility of the oligo ethylene glycol side chains. In cyclic voltammetry measurements in dichloromethane (DCM) a similar HOMO level of −5.30 eV for all the polymers were found. The HOMO values were calculated from their first oxidation potentials by taking the absolute value of the ferroccene/ferrocenium couple to be −5.16 eV.14 The details of redox potentials, calculation of HOMO levels, SEC and DSC curves are given in the ESI (Table S1,† Fig. S1 and S2†).
| Polymer | Side chain | Mna [g mol−1] | Mwa [g mol−1] | PDIa | Tgb [°C] | μh [cm2 V−1 s−1] |
|---|---|---|---|---|---|---|
| a Measured by SEC in THF at room temperature.b Tg measured from 20–280 °C, 40 K min−1 under nitrogen.c Detailed characterization can be found in (ref. 14); OEG: oligo ethylene glycol. | ||||||
| PTPD1c | Alkyl | 10![[thin space (1/6-em)]](https://www.rsc.org/images/entities/char_2009.gif) 330 330 |
15![[thin space (1/6-em)]](https://www.rsc.org/images/entities/char_2009.gif) 770 770 |
1.52 | 147 | 1.6 × 10⁻⁴ |
| PTPD2 | Alkyl | 12![[thin space (1/6-em)]](https://www.rsc.org/images/entities/char_2009.gif) 920 920 |
29![[thin space (1/6-em)]](https://www.rsc.org/images/entities/char_2009.gif) 500 500 |
2.28 | 152 | 4.7 × 10⁻⁴ |
| PTPD3 | Alkyl | 37![[thin space (1/6-em)]](https://www.rsc.org/images/entities/char_2009.gif) 060 060 |
147![[thin space (1/6-em)]](https://www.rsc.org/images/entities/char_2009.gif) 540 540 |
3.98 | 157 | 1.1 × 10⁻⁴ |
| PTPD4 | OEG | 11![[thin space (1/6-em)]](https://www.rsc.org/images/entities/char_2009.gif) 000 000 |
21![[thin space (1/6-em)]](https://www.rsc.org/images/entities/char_2009.gif) 900 900 |
1.99 | 124 | 1.9 × 10⁻⁴ |
2.2. Investigation of the hole transport mobility
In the following, we investigate in detail the hole transport mobility of the polymers by SCLC measurements. This method allows us to compare the bulk charge transport behavior of the polymers with respect to different molecular weights and PDIs. For the SCLC hole-only diode devices, a poly(3,4-ethylenedioxythiophene):poly(styrenesulfonate) (PEDOT:PSS) coated indium tin oxide (ITO) substrate was used to enable hole-injection. The polymer films with different layer thicknesses were prepared by doctor blading. Afterwards, gold was evaporated as the top electrode which preferentially allows for hole collection and hinders electron injection. Due to this setup and the suitable energy levels of the selected electrodes, the hole current in the SCLC regime should be limited only by the charge carrier mobility (μh) of the polymer and it varies with V2 and L−3, where V is the applied voltage and L is the layer thickness according to eqn (1). In the current density J vs. V plots, one can differentiate between two regimes, the ohmic regime at very low voltages and the SCLC regime at higher voltages. In the ohmic regime, the current increases linearly with the voltage. Further increase of the voltage leads to the trap-limited SCLC regime where the current shows a quadratic dependence. Thus, the Mott–Gurney eqn (1) was used to calculate μh only in the SCLC regime.16
 | (1) |
The SCLC behavior was further verified by measuring three layer thicknesses. The fits according to the relation J ∼ V2L−3 are given in the ESI (Fig. S4†). All the plots exhibit the inverse cubic dependence on the layer thickness. Since we calculated the μh values at V > 1 V, we also verified the dependence of the μh on voltage by taking into account the field dependence factor using the Murgatroyd equation.17 Calculating the mobility with this equation leads to similar μh values. The voltage drop Vr originating from the contact and series resistance was measured in a reference device without a polymer layer and was subtracted from the applied voltage. The built-in potential Vbi for PEDOT:PSS and gold is estimated to be 0.1 V. The log![[thin space (1/6-em)]](https://www.rsc.org/images/entities/char_2009.gif) J vs. V plots of PTPD2, PTPD3, and PTPD4 and the corresponding fits according to eqn (1) are illustrated in Fig. 1 (see Fig. S3† for additional log–log plots of J vs. V). The results of the SCLC measurements for PTPD1 are published elsewhere.15 All the hole transport mobility values are given in Table 1, showing a μh in the range of 10−4 cm2 V−1 s−1. The values for the individual layer thicknesses can be found in Table S2, S3, and S4 ESI.† Thus, our measurements reveal that there is no dependence of the hole transport mobility either on the molecular weight or on the polydispersity of the PTPD polymers. This result can be explained by the amorphous character of the polymers which leads to an isotropic charge transport without any aggregation/crystallization effects. On comparing the polymers having hydrophilic and hydrophobic substituents, we find a similar μh for the polymers with ethylhexyloxy side chains (PTPD1-3) as well as for the polymer with oligo ethylene glycol side chains (PTPD4). These values are in the same range of those reported for spiro-MeOTAD by Nelson et al.18
J vs. V plots of PTPD2, PTPD3, and PTPD4 and the corresponding fits according to eqn (1) are illustrated in Fig. 1 (see Fig. S3† for additional log–log plots of J vs. V). The results of the SCLC measurements for PTPD1 are published elsewhere.15 All the hole transport mobility values are given in Table 1, showing a μh in the range of 10−4 cm2 V−1 s−1. The values for the individual layer thicknesses can be found in Table S2, S3, and S4 ESI.† Thus, our measurements reveal that there is no dependence of the hole transport mobility either on the molecular weight or on the polydispersity of the PTPD polymers. This result can be explained by the amorphous character of the polymers which leads to an isotropic charge transport without any aggregation/crystallization effects. On comparing the polymers having hydrophilic and hydrophobic substituents, we find a similar μh for the polymers with ethylhexyloxy side chains (PTPD1-3) as well as for the polymer with oligo ethylene glycol side chains (PTPD4). These values are in the same range of those reported for spiro-MeOTAD by Nelson et al.18
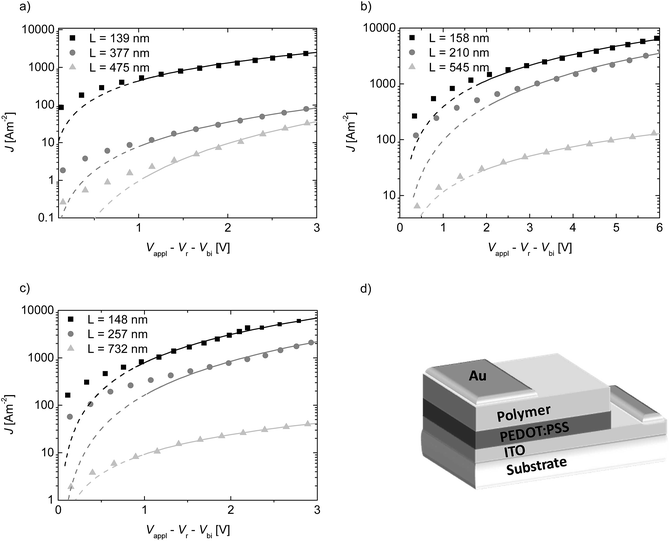 | ||
| Fig. 1 Log–linear plots of current density J vs. voltage V (data points) and fits according to eqn (1) (straight lines) at room temperature for the hydrophobic polymers (a) PTPD2 and (b) PTPD3 as well as for the hydrophilic polymer (c) PTPD4 for different layer thicknesses; (d) scheme of a hole only device with gold as top electrode and PEDOT:PSS as bottom electrode. | ||
2.3. Effect of doping PTPDs on absorption and charge carrier density
Next, we study the mechanism as well as the effect of doping on PTPDs using the Co(III)-complex, tris(2-(1H-pyrazol-1-yl)pyridine)cobalt(III).7 The PTPDs have a suitable oxidation potential for the use of this dopant. Since there is no difference in the hole transport mobilities or in their HOMO values of the polymers, we use one polymer (PTPD2) as a typical example for our doping experiments.First, the influence of doping on charge carrier density in hole only devices was investigated. As known from the literature, doping of semiconducting polymers leads to a higher charge carrier density. Thus, the calculated mobility in doped devices increases due to this increased charge carrier concentration.19 The sample preparation for the J–V-measurements was adapted from section 2.2, except that the active layer was doped with 10 wt% Co(III)-complex prior to spin-coating. If we consider the SCLC regime in the J–V-plots (1 to 5 V), the current density is six times higher for the doped device in comparison to the undoped one. Calculating the μh from the doped devices leads to 2.8 × 10⁻³ cm2 V−1 s−1, which is one order of magnitude higher compared to the undoped devices. The log![[thin space (1/6-em)]](https://www.rsc.org/images/entities/char_2009.gif) J vs. V plots for an undoped and a doped device are depicted in Fig. S5.†
J vs. V plots for an undoped and a doped device are depicted in Fig. S5.†
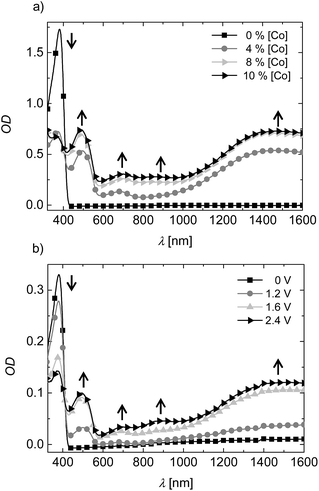
As next step, the doping mechanism was investigated by UV-vis-NIR measurements in THF solution, as illustrated in Fig. 2. PTPD2 was mixed with different amounts (4, 6, 8, and 10 wt%) of the dopant and the absorption was measured. Addition of the Co(III)-complex, leads to three new absorption bands at 490, 694, and 860 nm as well as an absorption band in the near IR region at 1403 nm.
Increasing amount of dopant increases the intensity of these absorption bands. Simultaneously, the absorption peak of the PTPD2 at 380 nm decreases. We verified the origin of these peaks by spectroelectrochemical measurements (see Fig. 2b). For that purpose, PTPD2 was dissolved in a 0.1 M tetrabutylammonium hexafluorophosphate solution in THF. In a cuvette with a counter electrode (Pt) and a Pt-net as working electrode, a potential was applied. As depicted in Fig. 2b similar peaks as shown for the chemical doping in Fig. 2a arise during the spectroelectrochemical measurement. The new absorption bands in the long wavelength region correspond to the radical cation species of triphenylamine, which is known in the literature.20 Consequently, the Co(III)-complex oxidizes the PTPD2 which leads to cationic polarons resulting in a higher charge carrier density.21
2.4. Photovoltaic properties
In order to understand the influence of side chain polarity and the suitability of these polymers as HTL in perovskite (CH3NH3PbI3) cells, we selected the polymers PTPD2 and PTPD4 having comparable molecular weights, but different side groups. All photovoltaic devices were prepared by a modified literature procedure as described in the experimental part.1 A structured fluorine-doped tin oxide (FTO) substrate was coated with a thin TiO2 blocking layer. After deposition of mesoporous titannia (mp-TiO2), the perovskite was coated by a sequential dipping technique. After drying, the HTL was spin coated and gold was evaporated. First, we address the effect of doping and additives in the HTL followed by the difference in polarity of the two polymers and finally the storage effects on solar cell parameters.| JSC [mA cm−2] | VOC [mV] | FF | PCE [%] | RS [Ω cm2] | RSH [Ω cm2] | |
|---|---|---|---|---|---|---|
| (A) Undoped (best) | 9.25 | 685 | 0.57 | 3.59 | 15 | 408 |
| Average value | 8.05 | 715 | 0.59 | 3.37 | 14 | 891 |
| RMS deviation | ±0.8 | ±50 | ±0.04 | ±0.39 | ±2 | ±580 |
| (B) Doped (best) | 9.58 | 795 | 0.63 | 4.78 | 12 | 608 |
| Average value | 9.72 | 775 | 0.57 | 4.22 | 13 | 340 |
| RMS deviation | ±1.4 | ±52 | ±0.05 | ±0.58 | ±2 | ±120 |
| (C) Doped + LiTFSI, TBP (best) | 10.54 | 805 | 0.60 | 5.10 | 12 | 272 |
| Average value | 11.24 | 815 | 0.48 | 4.39 | 15 | 149 |
| RMS deviation | ±0.9 | ±10 | ±0.08 | ±0.50 | ±3 | ±66 |
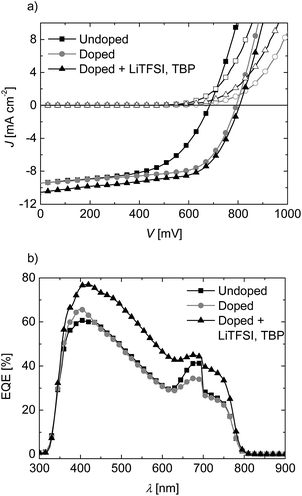
For the undoped devices, we find an average open circuit voltage (VOC), short-circuit current density (JSC), and fill factor (FF) of 715 mV, 8.05 mA cm−2, and 0.59, respectively. This leads to an average power conversion efficiency (PCE) of 3.37%. The corresponding RS and RSH are 14 and 891 Ω cm2. Upon the addition of dopant, the PCE increases to 4.22%, mainly due to the higher VOC of 775 mV and JSC of 9.72 mA cm−2. The mean RS does not change, whereas the RSH is decreased considerably. As a result of the addition of LiTFSI and TBP, the JSC increases significantly to 11.23 mA cm−2 in average. The VOC slightly improves to 815 mV and the PCE increases to 4.39% in average. The record cell showed a PCE of 5.10%. Moreover, the average RS increases only slightly and the RSH decreases drastically to 149 Ω cm2 resulting in lowering of FF. Thus, the overall performance of the cells can be improved by doping and addition of LiFTSI and TBP, mainly due to the improvement in VOC and JSC. The corresponding EQE measured under ambient atmosphere are given in Fig. 3b.
We find a significant improvement of the EQE for the whole range of absorption for the doped device with additives LiTFSI and TBP compared to the undoped one. The EQE of the doped device reaches 77% at maximum absorption of 413 nm, while in the long wavelength region of 600 to 750 nm, around 40% EQE are maintained. These results confirm the effect of the additives which lead to a higher photocurrent in the solar cell devices.
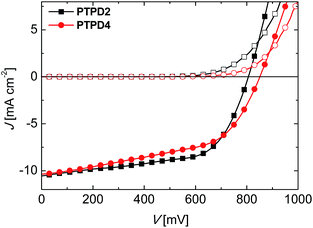
For the devices with PTPD4 measured directly after the preparation, a mean VOC, JSC, and FF of 804 mV, 9.62 mA cm−2, and 0.58, respectively are achieved. This leads to a PCE of 4.44% in average and 4.62% for the best performing device. On comparison the PTPD2 device delivered an average PCE of 4.39%. Thus, the obtained results are comparable for both type of polymers. However, the RS for the best device with PTPD4 is 20 Ω cm2, compared to 12 Ω cm2 for PTPD2. The RSH slightly increases from 272 Ω cm2 to 378 Ω cm2 for PTPD2 to PTPD4.
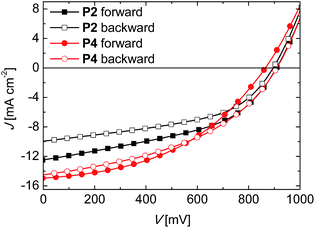
In the following, we address the question of hysteresis in the J–V-measurements for both type of devices. It was shown in the literature that a strong hysteresis effect exists in J–V-curves in perovskite devices which is attributed to interface effects, trap filling, ion migration etc.23 Devices with spiro-OMeTAD as HTL showed a better performance when measured in a backward bias compared to the forward bias. The hysteresis effect in J–V-curves is only detectable under illumination, but not in dark measurements. In order to investigate the hysteresis effect in our systems, we measured the devices with doped HTL containing LiTFSI and TBP in forward (from low to high forward bias) and in backward scan (from high to low forward bias) for both polymer systems. The corresponding J–V-curves for PTPD2 and PTPD4 are illustrated in Fig. 5 and the photovoltaic parameters can be found in Table S7.†
An obvious hysteresis occurs for both devices. The measurements in forward bias result in higher PCEs for both. Clearly, PTPD4 shows a less pronounced hysteresis compared to PTPD2. In the case of PTPD2 the backward scan improves the FF along with a decrease in JSC resulting in low PCE. On the other hand for PTPD4 no considerable change is observed in any of the parameters. In the case of spiro-OMeTAD devices it was reported that the PCE could be improved due to a higher FF in backward scans.23
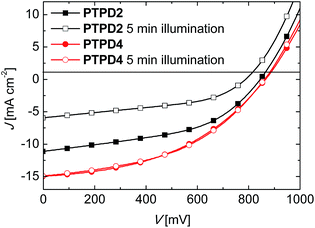
Another positive effect of the hydrophilic polymer PTPD4 is evident in the following experiment. Devices with PTPD2 and PTPD4 (both doped and containing additives) were measured after five minutes under illumination in air. The PCE of the devices with PTPD2 decreases drastically from 5.08% to 2.35%. This is mainly due to the reduced JSC. In contrast to that, the devices with PTPD4 are highly stable. Here, the PCE is 6.50% compared to 6.59% after five minutes under illumination. The corresponding J–V-characteristics are shown in Fig. 6.
In summary, PTPD2 with ethylhexyloxy and PTPD4 with oligo ethylene glycol side chains deliver similar PCEs directly after preparation in forward bias and under ambient conditions. However, PTPD4 shows a less hysteresis effect and it has a higher stability under illumination. This could be attributed to interfacial effects due to the oligo ethylene glycol side chains. Due to the hydrophilic character, the wetting behavior of this polymer on perovskite is expected to be more suitable for the polar surface of the mp-TiO2 covered with the perovskite layer. Accordingly, a better coverage of the perovskite crystals can be observed for PTPD4 in SEM measurements compared to that of PTPD2 (see ESI Fig. S6†).
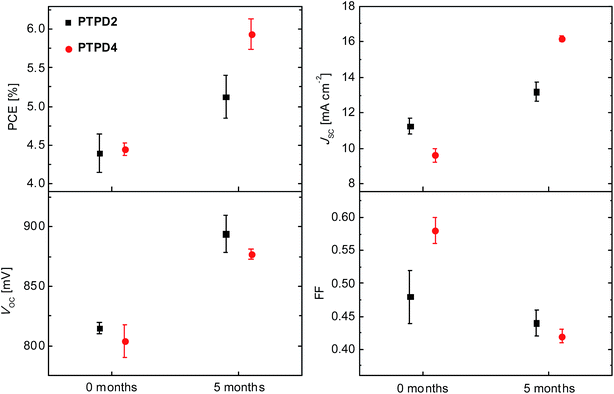
After 5 months storage, the average PCE for PTPD2 devices improves from 4.39% to 5.12%. The best device exhibited an efficiency of 5.87%. This is mainly due to the enhanced JSC and VOC (see Table S5†). The RS decreases slightly, whereas the RSH increases on storage, causing an overall decrease in FF from 0.58 to 0.45. In the case of PTPD4, the VOC reaches 877 mV, JSC 16.17 mA cm−2, and FF 0.42, leading to a mean PCE of 5.94% on storage. The highest performing device improves its efficiency from 4.62% to 6.50%. Here also storing the devices for five months under nitrogen improves the VOC as well as the JSC significantly. Also for PTPD4, the FF is reduced in accordance with the observed resistance values. To sum up, storage improves the overall performance of both types of devices (PTPD2 and PTPD4) mainly due to higher VOC and JSC.
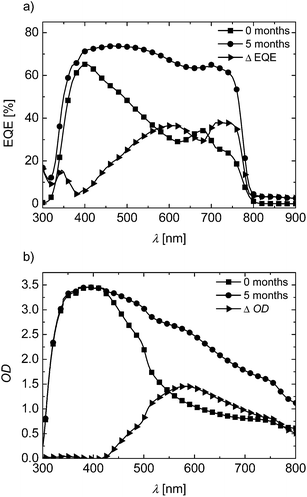
In order to understand the unexpected improvement of the solar cell performance on storage, we compare the EQE and UV-vis absorption in Fig. 8 for PTPD2 device. Directly after preparation, the EQE reaches 65% at its maximum of 400 nm. In the long wavelength region (500 to 800 nm), the EQE is only 30%. Upon storage, the EQE significantly changes its shape. A considerably high EQE over the 500 to 800 nm region is observed. In this region, PTPD2 does not absorb and the contribution to EQE comes only from the perovskite layer. The UV-vis measurements shows a comparative increase of optical density in the long wavelength region from 500 to 800 nm on storage. If the change in EQE (ΔEQE) is compared with the change in optical density (ΔOD), it is obvious that the increased EQE contribution arises from additional absorption in the perovskite layer. It is known in the literature that defects within CH3NH3PbI3 in mp-TiO2 cause an optical blue shift resulting in less light harvesting and low EQE.25 Owen et al. have reported a detailed analysis of the blue shift in absorption spectra using pair distribution function analysis of X-ray scattering on perovskites. These authors clearly point out the fact that the disordered and amorphous phases, which are not visible in conventional XRD measurements, are important for device efficiency due to changes in absorption depending on medium or long range structural coherence. Probably, the improvements observed here can be of a similar nature. But this has to be studied in a systematic way to draw final conclusions. A very same trend occurs for the devices with PTPD4 on storage (see ESI, Fig. S7†).
Since the devices are not encapsulated and there is a considerable improvement on the photovoltaic performance of the devices with PTPD2 and PTPD4 on storage under nitrogen, we measured the stored devices also under nitrogen atmosphere. This was done in order to keep the adverse effects of moisture as low as possible during the measurements. The photovoltaic parameters for these measurements under nitrogen can be found in Tables S5 and S6.†
For PTPD2 the average PCE increases when measured under nitrogen (η = 5.12 to 5.84%), for PTPD4 no improvement is observed (η = 5.94 to 5.43%). For the champion cells, it is more pronounced and the efficiency values reach 7.69% for PTPD2 and 6.44% for PTPD4. In the case of PTPD2 the big improvement under nitrogen is seen in FF (0.46 to 0.68), whereas for PTPD4 the decrease in FF is compensated by the increase in VOC and thus the solar cell performance remains the same. The decrease in JSC for the best performing cell is only very marginal (14.0 to 13.4 mA cm−2 for PTPD2 and 16.65 to 16.43 mA cm−2 for PTPD4) and are within the errors of reproducibility and measurement. However, the average JSC values for both types decrease. It has been reported that the conductivity of the hole transport material can be improved by oxygen doping in the case of easily oxidizable hole conductors such as spiro-OMeTAD.26 Accordingly, device performances have been shown to decrease during storage under argon or vacuum.27 A similar effect may be expected in the case of PTPDs as well.
3. Conclusion
In conclusion, we investigated the material properties of PTPD main-chain polymers and the influence of chemical structure and properties on the solar cell performance in combination with CH3NH3PbI3. Appreciably good hole transport mobility with no dependence on the molecular weight and polydispersity was observed for these polymers. Furthermore, Co(III)-complex causes an oxidative doping of these polymers leading to higher charge carrier density and high conductivity. The mechanism of doping was also supported by spectroelectrochemical studies. The combination of dopant and use of the additives (LiTFSI and TBP) gave the best results for perovskite solar cells involving these polymers. On comparison of PTPD2 carrying ethylhexyloxy side chains with PTPD4 containing hydrophilic oligo ethylene glycol side chains, we observed less hysteresis and higher photostability for the latter. Both types of devices exhibit unexpected significant improvements on storage under nitrogen. The improvements in photovoltaic parameters can be clearly attributed to increased absorption resulting in very high EQE values for a broad range of absorption. Since the two polymers differ only in the nature of their side chains, the positive effects of PTPD4 devices can be attributed to the hydrophilic nature of its side chains, which is highly compatible at the interface with CH3NH3PbI3 material.4. Experimental section
4.1. Synthesis
The monomer synthesis and the synthesis of PTPD1 is described elsewhere.14General procedure for Yamamoto polymerization: 2,2′-bipyridine (3.64 mmol, 2.2 eq.) and 1,5-cyclooctadiene (3.64 mmol, 2.2 eq.) were dissolved in 2.3 ml dimethylformamide (DMF). The solution was degassed for 30 min. bis(1,5-cyclooctadien)nickel (3.64 mmol, 2.2 eq.) was added and the solution was heated to 80 °C for 30 min under stirring. The monomer (1.65 mmol, 1 eq.) was dissolved in 2.5 ml toluene in a separate flask and degassed for 30 min. Subsequently the monomer solution was added to the catalyst solution by a syringe. The reaction mixture was stirred for 7 days at 80 °C under argon. Degassed bromobenzene was added for endcapping. After 24 h the reaction mixture was poured into methanol–HCl (1![[thin space (1/6-em)]](https://www.rsc.org/images/entities/char_2009.gif) :
:![[thin space (1/6-em)]](https://www.rsc.org/images/entities/char_2009.gif) 1) and the precipitate was filtered off. For further purification soxhlet extraction in methanol and acetone were performed. Yield: 81%.
1) and the precipitate was filtered off. For further purification soxhlet extraction in methanol and acetone were performed. Yield: 81%.
1H NMR (300 MHz, CDCl3, δ): 7.44 (d, 2H, Ar H), 7.09 (d, 2H, Ar H), 6.87 (m, 6H, Ar H), 3.83 (d, J = 5.2, 2H, OCH2), 1.73 (m, 1H, CH), 1.50 (m, 8H, CH2), 1.34 (s, 12H, CH3), 0.92 (m, 6H, CH3).
4.2. Characterization
Dry solvents were purchased from Aldrich and Acros, other solvents were destilled once before use.Mn and Mw values were determined by SEC in THF using a guard column (Varian, 50 × 0.75 cm, ResiPore, particle size 3 μm) and two separation columns (Varian, 300 × 0.75 cm, ResiPore, particle size 3 μm) and a Waters 515-HPLC pump with stabilized THF. The flow rate was 0.5 ml min−1. The compounds were monitored with a Waters UV detector at 254 nm. The SEC systems was calibrated against polystyrene. DSC analysis was performed on a Perkin Elmer Diamond DSC, calibrated with indium. Tg were determined using a scanning rate of 20 °C min−1 under a nitrogen flow.
SCLC devices were fabricated on structured ITO-coated glass substrates using AZ 1518 photo paint from Microchemicals to define the active area and to prevent edge effects. The devices were then plasma edged and a 50 nm PEDOT:PSS (Clevios) layer was spin coated into the active area. The PEDOT:PSS layer was heated up to 120 °C for 30 min, followed by doctor blading from chlorobenzene solutions of the polymer layer on top of it. Then a 40 nm gold layer was evaporated at 5 × 10⁻⁷ mbar. The device measurements were performed under active vacuum at room temperature with a Keithley source measure unit.
UV-vis measurements in THF solutions (0.025 mg ml−1) were carried out on a Hitachi U-3000 two-beam-photometer. For the spectroelectrical measurements a voltammetry cell from ALS Co., Ltd with 1 mm path length, a platin-net as electrode and tetrabutylammonium hexafluorophosphate as conducting salt was used.
For the perovskite solar cells a TiO2 blocking layer was deposited by spray pyrolyses of titanium(IV)bis(acetoacetonato)-di(isopropanoxylate) diluted in ethanol at 450 °C on FTO coated glass substrates and annealed at 450 °C. Next, the mp-TiO2 layer was prepared by doctor blading using a commercial TiO2 paste (Solaronix T/SP) diluted with Terpineol. The films were gradually heated to 450 °C and baked for 15 min at this temperature. After cooling, the substrates were handled in a glovebox under nitrogen atmosphere. The active layer was prepared by a sequential deposition method. First, PbI2 was spin-coated on top of the mp-TiO2. Second, the perovskite pigment was formed by dipping the substrate into a solution of CH3NH3I in isopropanol (10 mg ml−1). Before dipping the substrate in the CH3NH3I solution it was prewetted in isopropanol. After drying at 70 °C, a thin layer of the PTPD polymer was spin-coated. In a last step gold electrodes with a thickness of 60 nm were thermally evaporated.
The photovoltaic current–voltage measurements were carried out by a Keithley 6517 Source-Measure unit under AM 1.5G conditions (Solar simulator-A grade from Newport). The intensity of the light was calibrated with a standard Si-reference cell from the Fraunhofer Institute for Solar Energy Systems (ISE), Freiburg, as 100 mW cm2. The EQE values were measured using a Bentham PVE300 after illuminating the devices with monochromatic light obtained from Bentham TMc300 monochromator working with two lamps. The shoulders observed in some EQE measurements at about 700 nm in Fig. 4 and 8 are artefacts arising from switching problems of the two lamps and the filter integrated into the Bentham Tmc-300 monochromator.
Acknowledgements
We acknowledge the Deutsche Forschungsgemeinschaft (Graduate School GRK 1640) for financial support and KN thanks the Universität Bayern e.V. for the financial support in from of a scholarship of the Bayerische Graduiertenförderung and the Elitenetzwerk Bayern (ENB). We also like to thank Frank Schirmer for ITO patterning and Katja Gräf for the synthesis of the Co(III)-complex and fruitful discussions.References
- J. Burschka, N. Pellet, S.-J. Moon, R. Humphry-Baker, P. Gao, M. K. Nazeeruddin and M. Grätzel, Nature, 2013, 499, 316–319 CrossRef CAS PubMed.
- (a) A. Kojima, K. Teshima, Y. Shirai and T. Miyasaka, J. Am. Chem. Soc., 2009, 131, 6050–6051 CrossRef CAS PubMed; (b) M. M. Lee, J. Teuscher, T. Miyasaka, T. N. Murakami and H. J. Snaith, Science, 2012, 338, 643–647 CrossRef CAS PubMed; (c) H.-S. Kim, C.-R. Lee, J.-H. Im, K.-B. Lee, T. Moehl, A. Marchioro, S.-J. Moon, R. Humphry-Baker, J.-H. Yum, J. E. Moser, M. Grätzel and N.-G. Park, Sci. Rep., 2012, 2, 1–7 Search PubMed.
- (a) D. Bi, G. Boschloo, S. Schwarzmüller, L. Yang, E. M. J. Johansson and A. Hagfeldt, Nanoscale, 2013, 5, 11686–91 RSC; (b) M. H. Kumar, N. Yantara, S. Dharani, M. Graetzel, S. Mhaisalkar, P. P. Boix and N. Mathews, Chem. Commun., 2013, 49, 11089–11091 RSC.
- (a) M. Liu, M. B. Johnston and H. J. Snaith, Nature, 2013, 501, 395–398 CrossRef CAS PubMed; (b) G. E. Eperon, V. M. Burlakov, P. Docampo, A. Goriely and H. J. Snaith, Adv. Funct. Mater., 2013, 151–157 Search PubMed.
- D. Liu and T. L. Kelly, Nat. Photonics, 2013, 8, 133–138 CrossRef.
- K. Walzer, B. Maennig, M. Pfeiffer and K. Leo, Chem. Rev., 2007, 107, 1233–1271 CrossRef CAS PubMed.
- J. Burschka, A. Dualeh, F. Kessler, E. Baranoff, N.-L. Cevey-Ha, C. Yi, M. K. Nazeeruddin and M. Grätzel, J. Am. Chem. Soc., 2011, 133, 18042–18045 CrossRef CAS PubMed.
- (a) H. Li, K. Fu, A. Hagfeldt, M. Grätzel, S. G. Mhaisalkar and A. C. Grimsdale, Angew. Chem., Int. Ed., 2014, 4085–4088 CrossRef CAS PubMed; (b) D. Bi, L. Yang, G. Boschloo, A. Hagfeldt and E. M. J. Johansson, J. Phys. Chem. Lett., 2013, 4, 1532–1536 CrossRef CAS; (c) B. Cai, Y. Xing, Z. Yang, W.-H. Zhang and J. Qiu, Energy Environ. Sci., 2013, 6, 1480–1485 RSC.
- J. H. Heo, S. H. Im, J. H. Noh, T. N. Mandal, C.-S. Lim, J. A. Chang, Y. H. Lee, H.-j. Kim, A. Sarkar, M. K. Nazeeruddin, M. Grätzel and S. I. Seok, Nat. Photonics, 2013, 486–491 CrossRef CAS.
- J. H. Noh, S. H. Im, J. H. Heo, T. N. Mandal and S. I. Seok, Nano Lett., 2013, 13, 1764–1769 CAS.
- C. R. Singh, G. Gupta, R. Lohwasser, S. Engmann, J. Balko, M. Thelakkat, T. Thurn-Albrecht and H. Hoppe, J. Polym. Sci., Part B: Polym. Phys., 2013, 51, 943–951 CrossRef CAS PubMed.
- E. M. Barea, G. Garcia-Belmonte, M. Sommer, S. Hüttner, H. J. Bolink and M. Thelakkat, Thin Solid Films, 2010, 518, 3351–3354 CrossRef CAS PubMed.
- A. S. Lang, M.-A. Muth, C. D. Heinrich, M. Carassco-Orozco and M. Thelakkat, J. Polym. Sci., Part B: Polym. Phys., 2013, 51, 1480–1486 CrossRef CAS PubMed.
- K. Neumann, C. Schwarz, A. Köhler and M. Thelakkat, J. Phys. Chem. C, 2014, 118, 27–36 CAS.
- K. Gräf, M. A. Rahim, S. Das and M. Thelakkat, Dyes Pigm., 2013, 99, 1101–1106 CrossRef PubMed.
- C. Goh, R. J. Kline, M. D. McGehee, E. N. Kadnikova and J. M. J. Fréchet, Appl. Phys. Lett., 2005, 122110 CrossRef PubMed.
- P. N. Murgatroyd, J. Phys. D: Appl. Phys., 1970, 3, 151–156 Search PubMed.
- D. Poplavskyy and J. Nelson, Appl. Phys. Lett., 2003, 93, 341–346 CAS.
- (a) V. I. Arkhipov, P. Heremans, E. V. Emelianova, G. J. Adriaenssens and H. Bässler, Appl. Phys. Lett., 2003, 82, 3245–3247 CrossRef CAS PubMed; (b) Y. Zhang, B. de Boer and P. W. M. Blom, Adv. Funct. Mater., 2009, 19, 1901–1905 CrossRef CAS PubMed.
- J. Bonvoisin, J.-P. Launay, M. van der Auweraer and F. C. de Schryver, J. Phys. Chem., 1994, 98, 5052–5057 CrossRef CAS.
- M. Lehnhardt, S. Hamwi, M. Hoping, J. Reinker, T. Riedl and W. Kowalsky, Appl. Phys. Lett., 2010, 96, 193301 CrossRef PubMed.
- J. D. Servaites, M. A. Ratner and T. J. Marks, Energy Environ. Sci., 2011, 4, 4410–4422 CAS.
- (a) A. Dualeh, T. Moehl, N. Tétreault, J. Teuscher, P. Gao, M. K. Nazeeruddin and M. Grätzel, ACS Nano, 2014, 8, 362–373 CrossRef CAS PubMed; (b) H. J. Snaith, A. Abate, J. M. Ball, G. E. Eperon, T. Leijtens, N. K. Noel, S. D. Stranks, J. T.-W. Wang, K. Wojciechowski and W. Zhang, J. Phys. Chem. Lett., 2014, 1511–1515 CrossRef CAS.
- (a) B. R. Vincent, K. N. Robertson, T. S. Cameron and O. Knop, Can. J. Chem., 1987, 65, 1042–1046 CrossRef CAS; (b) G. Niu, W. Li, F. Meng, L. Wang, H. Dong and Y. Qiu, J. Mater. Chem. A, 2013, 2, 705–710 RSC.
- J. J. Choi, X. Yang, Z. M. Norman, S. J. L. Billinge and J. S. Owen, Nano Lett., 2014, 14, 127–133 CrossRef CAS PubMed.
- U. B. Cappel, T. Daeneke and U. Bach, Nano Lett., 2012, 12, 4925–4931 CrossRef CAS PubMed.
- M. Karlsson, Ph.D. Thesis, Uppsala University, 2012.
Footnote |
| † Electronic supplementary information (ESI) available. See DOI: 10.1039/c4ra05564k |
| This journal is © The Royal Society of Chemistry 2014 |

