Zn2+, Cd2+ and Cu2+ mediated formation of amyloid like fibrils by the monomers of β-sheet rich peanut agglutinin†
Khatija Tabbasum and
Chebrolu Pulla Rao*
Bioinorganic Laboratory, Department of Chemistry, Indian Institute of Technology Bombay, Powai, Mumbai 400 076, India. E-mail: cprao@iitb.ac.in
First published on 3rd October 2014
Abstract
A broad spectrum of peptides and proteins can self assemble to form amyloid or amyloid like fibrils under appropriate conditions. Although amyloid fibrils have recently been exploited for their potential use as biomaterials, their applications remain challenging. In this paper, we have shown the formation of amyloid like fibrils of peanut agglutinin isolated from leguminacea class that is rich in beta sheet secondary structure under thermal conditions in the presence of Zn2+, Cd2+ and Cu2+. Formation of such fibrils has been followed and also assayed by different spectroscopy techniques. This was further evaluated by transmission electron microscopy, atomic force microscopy and scanning electron microscopy revealing their morphological features at the nano-scale. The blue-green fluorescence of these fibrils treated with dansyl chloride was micrographed. The role of these metal ions has been revealed by carrying out the experiments in the presence of EDTA that chelates these metal ions. Furthermore, the Energy Dispersive X-ray Analysis clearly showed that the fibrils are enriched with these metal ions. During the formation of fibrils, the presence of granular, sponge-like, network-like and proto-filaments has been witnessed. In order to demonstrate the utility of such self assembled fibrils induced by metal ions, these were shown to bind and possess circular – PBR322 plasmid, and hence are expected to have potential applications in gene delivery and related therapy.
Introduction
The aggregation of proteins is central to several neurodegenerative disorders including Alzheimer's disease (AD).1–3 The aggregates in these diseases are mainly composed of fibrils containing misfolded proteins known as amyloids which are rich in beta sheet conformation.1 It is observed that these aggregates are enriched with metal ions, such as Zn2+, Cu2+, Fe3+ and Cd2+ suggesting their interaction with the peptides, e.g., Aβ in case of AD.4–14 Therefore, chelation may provide therapeutic approach for such diseases.5 Although amyloid fibrils are associated with diseases, their application as potential biomaterials is possible as reviewed elsewhere recently.15 Briefly, this includes their use in bioactive matrix for tissue engineering,16–21 as scaffolds for controlling stem cell fates,22 as novel depot formulation in drug delivery,23–25 in the development of conducting nanowires,26,27 luminescent wires using semiconducting electrolytes28,29 and biosensors,30 due to their high stability and mechanical strength.31 Even the gels and films formed from these are suitable for immobilization of enzymes and drugs.32–34 Recently, a new class of biodegradable composite materials have been generated by combining graphene with amyloid fibrils, where such hybrid systems exhibit higher conductivity than graphene alone and were also shown as biosensors for quantifying enzyme activity.30 Therefore, as reviewed recently,35 beta-sheet rich proteins, viz., lectins, are likely to form amyloid fibrils under suitable conditions. In order to study the fibril formation, the interaction of lectin monomer by the transition metal ions has been chosen as a strategy. Thus, in the present case, it is focused on the fibril formation of peanut agglutinin (PNA) with biologically relevant ions, such as, Zn2+, Cd2+ and Cu2+, using spectroscopy and microscopy techniques. PNA is a tetramer36 in its native form (t_PNA) and dissociates into monomer upon heating (m_PNA).37 This paper shows that Zn2+, Cd2+ and Cu2+ ions induce fibril formation from the m_PNA. The fibrils have been initially characterized by various spectroscopy methods and their morphological features have been explored by microscopy at nano level. Furthermore, their ability to bind DNA and/or plasmid has been demonstrated to explore its possible application in gene delivery and relevant therapy.Results and discussion
The PNA was isolated and characterized as given in the Experimental section. Metallation of PNA was studied by absorption, emission and CD spectroscopy at elevated temperature (ET, 55–60 °C), since the tetramer (t_PNA) breaks into monomers (m_PNA) at ET.37Biologically important ions, such as, Zn2+, Cd2+ and Cu2+ were used in the present study since these are associated with different pathologies (including neurodegenerative ones). Furthermore, these ions exhibit rich coordination chemistry with the side chain moieties of the protein. As the present study of metallation at ET (m_PNA) showed aggregation in case of Zn2+, Cd2+ and Cu2+, the fibril formation and its utility were demonstrated.
Spectra at ET (with m_PNA)
At ET, the interaction of Cu2+, Zn2+ and Cd2+ with the m_PNA led to significant and/or large changes in the spectra (Fig. 1). The UV-visible absorption spectra showed changes by exhibiting a broad and prominent band at 280 nm in case of all these ions suggesting their interaction with the m_PNA at ET. Turbidimetric studies carried out as a function of temperature at 350 nm showed maximum aggregation of protein at 56, 62 and 66 °C respectively in presence of Cu2+, Zn2+ and Cd2+. However, under these conditions no aggregation takes place in presence of EDTA. On the other hand, the emission maximum shifts by 10 nm from 330 to 340 nm on going from t_PNA to m_PNA without exhibiting any change in the emission intensity. With m_PNA, both Zn2+ and Cd2+ exhibits an increase in the fluorescence intensity by ∼150% while the Cu2+ shows ∼80% quenching, suggesting that the interaction with these ions is followed by minor protein conformational changes. The fluorescence quenching in case of Cu2+ is attributable to its paramagnetism.The far UV CD spectra of t_PNA shows a single negative band at 222–225 nm and a positive band at 195 nm that is the hallmark of proteins rich in β-turns and β-sheets. However, the m_PNA exhibits more negative ellipticity at 222 nm and undergoes a blue shift to 217 nm (ESI 01†). The m_PNA in presence of Zn2+, Cd2+ or Cu2+ shows that the large blue shift associated with the heating is restored by exhibiting an isoelliptic point at 225–228 nm and this is accompanied by a decrease in ellipticity of the band at 217 nm. The data given in Fig. 2 show that Zn2+, Cd2+ and Cu2+ induces changes in the structure of m_PNA by binding. In the literature, such metal induced changes were attributed to protein aggregation.38 In order to ascertain that the changes are due to the metal ion binding, experiments were carried out in the presence of EDTA that effectively leaches the metal ions through complex formation. Based on the absorption, fluorescence and CD spectral changes observed in the presence of EDTA, it is concluded that the removal of the metal ion brings the restoration of the protein conformation as understood from the data given in ESI 02 and 03.†
Protein aggregation
In order to determine whether the metal binding to m_PNA leads to aggregation, dynamic light scattering (DLS) studies were performed. The particle size derived from the DLS experiments are: 10.7 ± 1.9, 677 ± 85, 2843 ± 467, 3036 ± 471, 3355 ± 650 and 510 ± 10 nm respectively for t_PNA, m_PNA, {m_PNA + Zn2+}, {m_PNA + Cd2+}, {m_PNA + Cu2+} and {m_PNA + Zn2+ + EDTA}. This suggests an increase in size upon going from the t_PNA to the m_PNA and then to the metallated PNA at ET. The literature reported particle diameter of PNA by DLS and by the Perrin's equation corresponds to 7.8 and 8.2 nm respectively,37 and hence the present study supports the PNA aggregation in presence of these ions at ET. However, the M2+ mediated aggregation is prevented in the presence of EDTA.Fibril formation
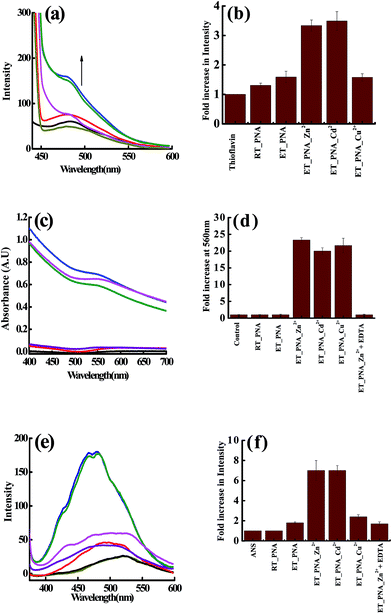
Since the DLS study strongly suggests the aggregation of PNA in presence of Zn2+, Cd2+, Cu2+ at ET, assays using thioflavin T (ThT) and the Congo red were performed to observe whether there is any fibril formation. The non-polar regions of the protein exposed during fibril formation were studied by ANS fluorescence emission. The assay results corresponding to all these three studies were given in Fig. 3 and the fibril formation was further assessed by FTIR (ESI 04†).As the data collected supported the formation of amyloid like fibrils for {m_PNA + M2+}, extensive microscopy studies involving AFM, TEM, SEM and FM were performed to further substantiate the formation as well to characterize the fibrils formed by m_PNA in presence of Zn2+, Cd2+ and Cu2+.
Microscopy
The TEM images were taken from the samples coated on a carbon coated copper grids and the AFM were taken from those coated on mica sheet. These studies were carried out with simple protein at RT as tetramer (t_PNA) and at elevated temperature as monomer (m_PNA) as positive controls. At elevated temperature, the m_PNA is treated with Zn2+, Cd2+ and Cu2+ and both TEM and AFM were measured for each of these to derive the morphology and size distribution characteristics of protein particles and/or the fibrils formed.When m_PNA is treated with M2+, TEM shows the presence of both disordered amorphous aggregates as well as ordered fibrils composed of amyloid like fibrils. The sizes of these amorphous aggregates vary from 50 to 500 nm. The aggregates have different morphological features, such as, granular, sponge-like and network-like structures (Fig. 5). Some of these exhibit even small protofibril like structures (ESI 05†). These aggregates seem to indicate the intermediate stages present in the path of the fibril formation.
 | ||
| Fig. 5 Different stages observed during the fibril development: (a) granular; (b) sponge-like; (c,d and e) network-like. | ||
The more ordered fibrillar aggregates are quite distinct from their amorphous aggregates. The latter ones run several μm long and cross over each other. Some of them are ribbon shaped with distinct twists and appear as thick filaments (Fig. 6).
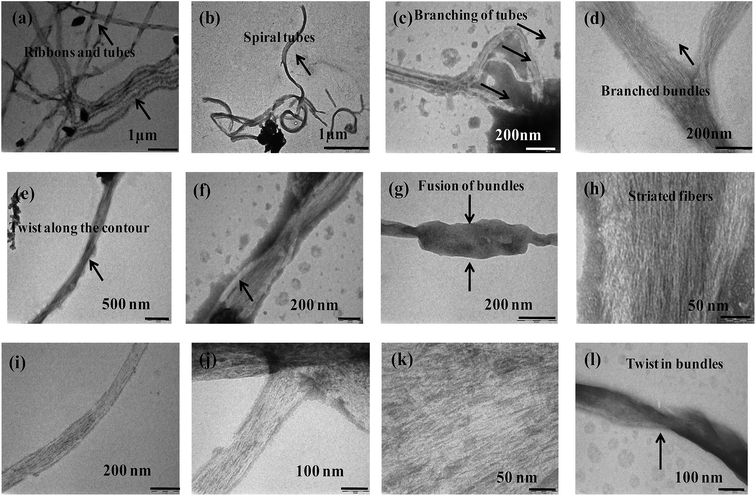 | ||
| Fig. 6 TEM micrographs of {m_PNA + Zn2+} in (a–d); {m_PNA + Cd2+} in (e–h), {m_PNA + Cu2+} in (i–l). | ||
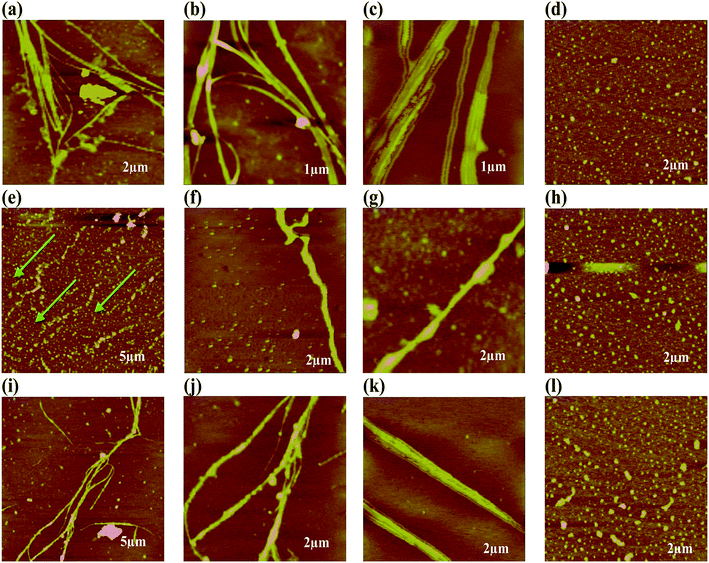
Bundles of subfilaments are observed which appear like twigs of bushes due to twists along the contour of their entire length (Fig. 6e). At higher magnification, these bundles reveal multi-stranded fibrils as subfilaments which are quite dense and these are reminiscent of muscle fibrils (Fig. 6h). These fibrils intertwine resulting in twist along the axis of fibrillar aggregate. Branching and splitting of filaments have also been observed (Fig. 6c and d). The statistical analysis of these fibrillar aggregates shows that while the width of individual thick filament vary from 40 to 80 nm, few bundles having >80 nm are also observed reaching to a highest width of 120 nm. When these thick filaments are further resolved, the average width of the individual fibril or subfilament was found to be 3 ± 0.5 nm (Fig. 6h and k).
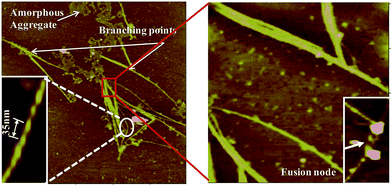
On the other hand, in case of {m_PNA + Zn2+}, {m_PNA + Cd2+} and {m_PNA + Cu2+} unusual amyloid like fibril structures were noticed (Fig. 8). The fibrils are several micrometers long, some of which can be seen running across the mica sheet while the others are seen as entangled ones. The fibril structures occur at varying heights ranging from thin to thick filaments. While the thin filaments have a height of 1 ± 0.5 nm, the thick ones have 2 ± 0.5 nm. Some thick filaments are also seen in certain parts of the mica sheet whose heights are 3 ± 0.5 nm. Thin filaments were 15–45 nm wide while the thick filaments were found to be 40–60 nm wide (ESI 06†). When the AFM was measured at 1 μm resolution, the thick filaments were seen to be composed of many thin ones which form multi-stranded species running across the mica sheet. Some of these are twisted and assume helical-like structure with repeating periodicity along the contours of the entire length ranging from 33 to 53 nm and the periodicity in the perpendicular direction is 10–15 nm. Some of these fibrils also exhibit branching. A careful examination of these fibrils both at low and high resolution seems to reveal that Zn2+ and Cd2+ initially binds to the surface of the protein which in turn induces aggregation to result in structures leading to the formation of thin fibrils. The thick fibrils indeed form from the bunching of the thinner ones. In order to ascertain the role of M2+ in the formation of fibrils, ETDA has been added to the reaction mixture and found no fibril formation owing to the well known M2+ complexation by EDTA. These experiments clearly suggest the necessity of the M2+ in the fibril formation in case of m_PNA.
Fluorescence microscopy (FM)
Solutions containing fibrils of PNA in presence of Zn2+ and Cu2+ have been treated with dansyl chloride and the heated solution were examined by FM. In FM (Fig. 10), the metallated PNA fibrils are seen glowing with bluish-green fluorescence in both the cases, as the dansyl moiety binds to the protein residues via covalent linkage which enhances the fluorescence emission of these bound moieties. | ||
| Fig. 10 Fluorescence microscopy: (a and b) {m_PNA + Zn2+}, (c and d) {m_PNA + Cu2+}. All the images are taken at 100× magnification. | ||
Fibril application
The development of non-viral vectors for gene delivery is important to avoid disease hazards created by the viral vectors and is one of the most promising approaches to treat genetic disorders including cancer. Surface modified CNTs have been shown to carry the genes.45 Recently cationic polymers are designed to carry genes into the target cells.46 In all these, the pre-step is the binding of gene to the carrier. Since the fibrils reported in this paper are embedded with cationic M2+ and are composed of biologically benign protein, these are expected to be better systems as compared to CNTs and/or cationic chemical polymers.Therefore, the binding of the plasmid, pBR322 to these fibrils has been demonstrated in this paper. The TEM images of {m_PNA + Cd2+} and {m_PNA + Cu2+} fibrils treated with pBR322 clearly showed the presence of plasmid embedded in these fibrils (Fig. 11). The size of the embedded plasmid is almost same as that observed for the plasmid alone. The plasmid is well distributed in case of the {m_PNA + Cu2+} fibrils, and is similar to that observed in case of functionalized CNTs treated with DNA that is reported in the literature.45 However, these are clustered in case of {m_PNA + Cd2+} showing the dependence of the metal ion in plasmid binding and/or on the nature of the fibrils formed.
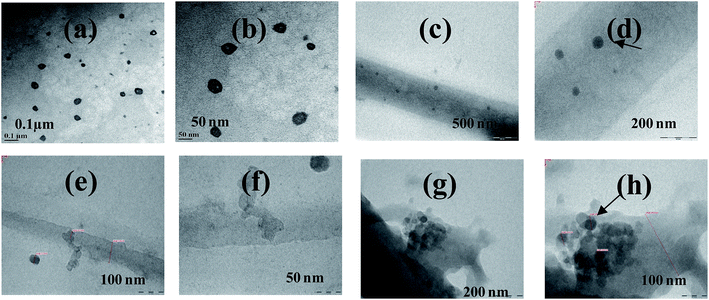 | ||
| Fig. 11 TEM micrographs for (a and b) simple plasmid PBR322; (c and d) {m_PNA + Cu2+ + plasmid pBR322}; (e–h) {m_PNA + Cd2+ + plasmid pBR322}. | ||
Conclusions and correlations
In conclusion, thermally induced PNA (m_PNA) in presence of divalent metal ions, such as, Zn2+, Cd2+ and Cu2+, shows both amorphous and fibrillar aggregates. The various types of aggregates might represent pre-fibrillar states in the pathway of more ordered fibrils. Since fibril formation requires large conformational changes, it is expected that the metal ion triggers such changes through their coordination. Our present study indeed draws support from that reported in the literature regarding Con A which forms amorphous aggregates at pH ∼ 5 and fibril formation at pH ∼ 8–9 by causing secondary and tertiary structural changes.47 It is to be noted that the PNA in its tetrameric form at room temperature, viz., t_PNA, is not capable of forming any fibrils even in the presence of metal ions, such as, Zn2+, Cd2+ and Cu2+. Thus, the requirement of the dissociation of the tetramer into its monomeric units is essential for such fibril formation as also reported in case of Con A and transthyretin.48,49 In the present case the M2+ ions are implicated for their coordination in addition to bringing conformational changes as studied by CD spectroscopy. The matured fibrils observed in the present study can be explained as given in Scheme 1.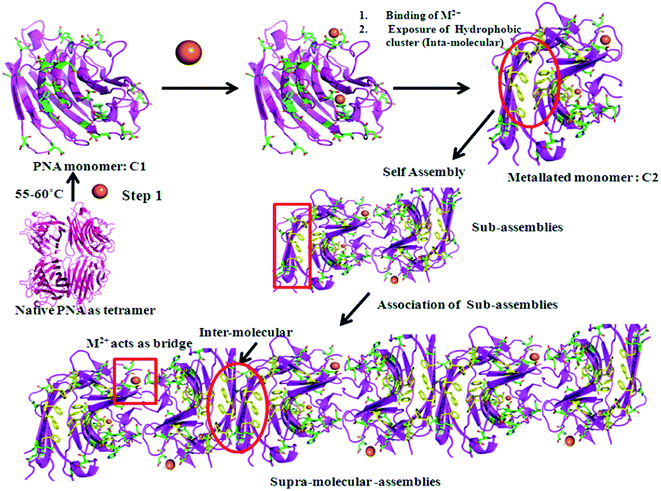 | ||
Scheme 1 Metal ion (M2+ =  ) mediated fibril formation from the polymerization of PNA monomers (m_PNA) at elevated temperature (ET). (The structures are drawn using PyMOL. PDB code: 2PEL.) ) mediated fibril formation from the polymerization of PNA monomers (m_PNA) at elevated temperature (ET). (The structures are drawn using PyMOL. PDB code: 2PEL.) | ||
In the literature there have been reports where two or more sub-filaments twists around each other resulting into more complex and highly ordered self assembled species.50 The present study also supports hierarchical pathway for such self assembly (Fig. 12). The thick filaments are composed of numerous thin and fine filaments forming multi-stranded structures. The self assembly of numerous sub-filaments into a long cable with twists, and its periodicity is of paramount importance reflecting the strong inter-fibrillar interactions. Such interactions would lead to the formation of cable like species, and highlights the importance of metal ion mediated interactions.
The present study also highlights the application of the metal ion induced fibrils of PNA by exhibiting their capability to incorporate circular-plasmid DNA, a factor that is essential for exploring their potential in gene/drug delivery. Such incorporations are known mainly in case of functionalized CNTs and not with the protein fibrils.45 These metallated fibrils of PNA would be of potentially important as biomaterials owing to their biological benign nature of the protein. As the PNA fibrils reported here possesses biologically important ions, such as, Zn2+, Cd2+ and Cu2+, these may catalyze variety of reactions of bioinorganic importance like that shown by metalloenzymes. Thus the demonstrated binding aspects may open avenues that possibly influence biomedical applications at large.
Experimental section
Isolation and purification PNA
The peanut agglutinin was extracted from peanuts as per the procedure given in the literature.51 The extracted PNA was purified by affinity chromatography and was checked on a 15% SDS PAGE gel to find a single band at 27 kD corresponding to the monomer of PNA (ESI 07†). Concentration of PNA was determined by taking the molar coefficient of extinction as 23![[thin space (1/6-em)]](https://www.rsc.org/images/entities/char_2009.gif) 950 M−1 cm−1. All the experiments were performed using a fresh batch of protein.
950 M−1 cm−1. All the experiments were performed using a fresh batch of protein.
Experimental details for fibril formation
For all the experiments 10 μM of PNA and 500 μM of metal ions in protein to metal ion ratio as 1![[thin space (1/6-em)]](https://www.rsc.org/images/entities/char_2009.gif) :
:![[thin space (1/6-em)]](https://www.rsc.org/images/entities/char_2009.gif) 50 in 10 mM Tris-HCl at pH = 7.4 in a total volume of 1 ml solution. The solution was then heated at 55–60 °C for about 1 to 3 hour and brought back to room temperature. The samples were immediately analyzed by different techniques. The metal ions used in the present study were perchlorate salts of Zn2+, Cd2+, and Cu2+. In order to elucidate the role of these metal ions, the experiments were also performed under similar conditions but in the presence a chelator EDTA. The concentration of EDTA was three times higher than the concentration of the metal ion.
50 in 10 mM Tris-HCl at pH = 7.4 in a total volume of 1 ml solution. The solution was then heated at 55–60 °C for about 1 to 3 hour and brought back to room temperature. The samples were immediately analyzed by different techniques. The metal ions used in the present study were perchlorate salts of Zn2+, Cd2+, and Cu2+. In order to elucidate the role of these metal ions, the experiments were also performed under similar conditions but in the presence a chelator EDTA. The concentration of EDTA was three times higher than the concentration of the metal ion.
PNA (peanut agglutinin) is a legume lectin. It is a tetrameric protein with a Mw of 110 kDa. The tetramer of PNA is stable up to 50 °C. It dissociates into monomers at and above 56 °C. However, the monomer remains in its folded state and retains its ligand binding activity. Its PDB code is 2PEL. Each monomer is rich in beta sheet and forms typical jelly roll motif. This monomeric form has Mn2+ and Ca2+ in its bound state. Its PDB code is 2PEL.
UV-visible spectroscopy
UV-visible absorption studies were performed on a JASCO V-570 instrument. Absorption spectra were recorded from 200 to 800 nm in a quartz cell at a scan rate of 100 nm min−1. At RT, 1 mg ml−1 of PNA was titrated with 10 mM stock solution of M2+ (M = Zn, Cd, Cu) with metal ion concentration ranging from 0 to 200 μM. The buffer was similarly titrated with the corresponding metal ion using same concentration and this was subtracted to give the final graph. Similar studies were carried out after heating the PNA in presence of different metal ions. The Congo red binding assay was performed by mixing the treated protein sample with Congo red dye (25 μM) and incubating the solution for 10–15 minutes. The binding of dye was assessed by measuring the absorbance in the range, 400–700 nm. Appropriate blank corrections were made in all spectra.Fluorescence spectroscopy
Fluorescence studies were performed on Perkin Elmer LS55 instrument. Concentration of protein was 0.45 μM in 1 ml of Tris-HCl buffer (10 mM, pH 7.4) while the concentration of metal ion was varied from 0 up to 1 mM. The experiments were performed in quartz cuvette of path length 1 cm, scan speed 200 nm min−1, and excitation and emission slit width 5 nm. Fluorescence intensity was monitored by exciting at 280 nm and recording the emission spectra from 290 to 550 nm. The 50 μl of different samples (protein to metal ratio of 1![[thin space (1/6-em)]](https://www.rsc.org/images/entities/char_2009.gif) :
:![[thin space (1/6-em)]](https://www.rsc.org/images/entities/char_2009.gif) 50) was mixed with 950 μl of Tris HCl, and the spectrum was scanned by exciting at 280 nm and recording the emission in 290 to 500 nm. The emission of the dye, thioflavin T was recorded in the wavelength range of 450–600 nm by exciting at 440 nm with excitation and emission slit widths being kept at 5 nm and 10 nm respectively. The cuvette has 1 ml of reaction mixture containing 100 μl of protein from the treated sample in 900 μl of buffer containing ThT. ANS binding studies have been performed by mixing 300 μM dye with protein having 0.1 mg ml−1 (5 μM) concentration in 10 mM Tris-buffer pH 7.4. The emission of the dye was monitored by exciting the solution at a wavelength of 370 nm and recording the emission in the range of 380–600 nm. Appropriate blank corrections were made in all spectra.
50) was mixed with 950 μl of Tris HCl, and the spectrum was scanned by exciting at 280 nm and recording the emission in 290 to 500 nm. The emission of the dye, thioflavin T was recorded in the wavelength range of 450–600 nm by exciting at 440 nm with excitation and emission slit widths being kept at 5 nm and 10 nm respectively. The cuvette has 1 ml of reaction mixture containing 100 μl of protein from the treated sample in 900 μl of buffer containing ThT. ANS binding studies have been performed by mixing 300 μM dye with protein having 0.1 mg ml−1 (5 μM) concentration in 10 mM Tris-buffer pH 7.4. The emission of the dye was monitored by exciting the solution at a wavelength of 370 nm and recording the emission in the range of 380–600 nm. Appropriate blank corrections were made in all spectra.
CD
Far-UV CD were recorded on JASCO-815. Quartz cuvette with a 0.1 cm path length was used. CD spectra were accumulated at room temperature at a scan speed of 100 nm min−1 between 190 to 260 nm. Three accumulations per scan were recorded for all CD experiments. Concentration of protein was 10 μM in Tris-HCl (5 mM, pH 7.4) while the concentration of metal ion was varied from 0 to 800 μM at an increment of 80 μM. Temperature variable far-UV CD was performed by varying the temperature from 20 to 90 °C at an interval of 5 °C on JASCO-815 connected to JASCO-PTC 4235/15 Peltier system. The reaction mixture consisted of 5 μM of PNA and 250 μM of M2+ (M = Zn, Cd, Cu). All the conditions were the same for EDTA experiments and the concentration of EDTA was thrice to that of the metal ion. The data of the CD were shown as mean residue molar ellipticity, i.e., θ (deg cm2 dmol−1) as per the literature report.52FTIR
The protein was lyophilized to get a higher concentration. The final protein concentration was 1.5 mg ml−1. The ET_PNA (m_PNA) and this in presence of different M2+ ions were also similarly lyophilized and dissolved in minimal amount of Tris HCl (10 mM pH 7.4). The spectra were recorded from 1500 to 1800 cm−1 on a Bruker Tensor FTIR instrument and represents average of 400 scans in each case. The spectral resolution is 2 cm−1. The second derivative spectra were obtained by using Lorentzian method of deconvolution.DLS
DLS experiments were performed on Brookhaven 90Plus instrument. The concentration of the protein used was 1 mg ml−1 and the experiments were performed in 4 ml cuvette. Since DLS experiments are sensitive to dust, the buffer was filtered through 0.2 μm filter paper.AFM
AFM studies were performed in multimode Veeco Dimensions 3100 SPM with Nanoscope IV controller instrument. Tapping mode with phosphorus doped Si probe having sharp fine tip at the end was used in all the cases. The samples were prepared by drop cast method where 50 μl of sample was placed over mica sheet for 2–3 min with gentle swirling. The samples were air died and analyzed by AFM.TEM, SEM and EDAX
TEM experiments were performed on PHILIPS CM200 transmission electron microscope operating at 20–200 kV (resolution 2.4 Å). Carbon coated copper grids of 200 mesh were used as substrate for the sample. The preparation of the sample was similar to that of AFM except that the substrate used was copper grid. Samples were similarly air dried before analysis. SEM experiments were performed on JSM-6390 scanning electron microscope. EDAX were taken on stubs coated with carbon only. Size distribution analysis was done by Nanoscope 5.30r2 for AFM and by Image J for TEM.FM
Dansyl chloride (DNS-Cl) reacts covalently with the terminal amino groups from peptides and proteins to result in fluorescence and hence can be useful in labelling PNA fibrils generated in presence of metal ions as reported in this paper. The protein fibrils were taken in a solution of carbonate–bicarbonate buffer of pH 9.5 at a concentration of 10 μM. DNS-Cl dissolved in acetonitrile was added to the protein in 100-fold molar excess and the mixture was incubated at 55 °C for 45 minutes. Excess DNS-Cl was removed by repeated centrifugation followed by washing the protein precipitate. The labeled fibril solution that prepared was smeared on a glass slide, dried and was viewed in an optical microscope model DLMN MPS30, Fluorescence module with 100 W Hg lamp. Excitation of the smear at 340 nm revealed blue-green luminescent fibrils.Acknowledgements
CPR acknowledges the financial support from DST, CSIR, DAE through research projects. He also acknowledges IIT Bombay for Institute Chair Professorship. KT acknowledges UGC for research fellowship. We thank Dr Fatima Clement for some help with the fluorescence microscopy work. We acknowledge the central/institute facilities of IIT Bombay, viz., AFM, TEM, SEM.References
- C. A. Ross and M. A. Poirier, Nat. Med., 2004, 10, 10–17 CrossRef PubMed.
- A. Aguzzi and T. O'Connor, Nat. Rev. Drug Discovery, 2010, 9, 237–248 CrossRef CAS PubMed.
- J. Hardy and D. J. Selkoe, Science, 2002, 297, 353–356 CrossRef CAS PubMed.
- M. Lovell, J. Robertson, W. Teesdale, J. Campbell and W. Markesbery, J. Neurol. Sci., 1998, 158, 47–52 CrossRef CAS.
- V. Tougu, A. Tiiman and P. Palumaa, Metallomics, 2011, 3, 250–261 RSC.
- S. T. Liu, G. Howlett and C. J. Barrow, Biochemistry, 1999, 38, 9373–9378 CrossRef CAS PubMed.
- S. W. Suh, K. B. Jensen, M. S. Jensen, D. S. Silva, P. J. Kesslak, G. Danscher and C. J. Frederickson, Brain Res., 2000, 852, 274–278 CrossRef CAS.
- M. Lovell, J. Robertson, W. Teesdale, J. Campbell and W. Markesbery, J. Neurol. Sci., 1998, 158, 47–52 CrossRef CAS.
- A. I. Bush, Trends Neurosci., 2003, 26, 207–214 CrossRef CAS.
- A. I. Bush, W. H. Pettingell, G. Multhaup, M. D. Paradis, J. P. Vonsattel, J. F. Gusella, K. Beyreuther, C. L. Masters and R. E. Tanzi, Science, 1994, 265, 1464–1467 CAS.
- A. I. Bush, Curr. Opin. Chem. Biol., 2000, 4, 184–191 CrossRef CAS.
- L. M. Miller, Q. Wang, T. P. Telivala, R. J. Smith, A. Lanzirotti and J. J. Miklossy, J. Struct. Biol., 2006, 155, 30–37 CrossRef CAS PubMed.
- J. Y. Lee, T. B. Cole, R. D. Palmiter, S. W. Suh and J. Y. Koh, Proc. Natl. Acad. Sci. U. S. A., 2002, 99, 7705–7710 CrossRef CAS PubMed.
- G. Notarachille, F. A. V. Calo and D. Meleleo, BioMetals, 2014, 27, 371–388 CrossRef CAS PubMed.
- C. A. E. Hause, S. M. Strohb and I. C. Martins, Chem. Soc. Rev., 2014, 43, 5326–5345 RSC.
- S. Mankar, A. Anoop, S. Sen and S. K. Maji, Nano Rev., 2011, 2, 6032 Search PubMed.
- S. L. Gras, A. K. Tickler, A. M. Squires, G. L. Devlin, M. A. Horton, C. M. Dobson and C. E. MacPhee, Biomaterials, 2008, 29, 1553–1562 CrossRef CAS PubMed.
- T. C. Holmes, Trends Biotechnol., 2002, 20, 16–21 CrossRef CAS.
- S. Zhang, F. Gelain and X. Zhao, Semin. Cancer Biol., 2005, 15, 413–420 CrossRef PubMed.
- T. C. Holmes, S. de Lacalle, X. Su, G. Liu, A. Rich and S. Zhang, Proc. Natl. Acad. Sci. U. S. A., 2000, 97, 6728–6733 CrossRef CAS.
- J. Kisiday, M. Jin, B. Kurz, H. Hung, C. Semino, S. Zhang and A. J. Grodzinsky, Proc. Natl. Acad. Sci. U. S. A., 2002, 99, 9996–10001 CrossRef CAS PubMed.
- A. Nur-E-Kamal, I. Ahmed, J. Kamal, M. Schindler and S. Meiners, Stem Cells, 2006, 24, 426–433 CrossRef PubMed.
- S. K. Maji, D. Schubert, C. Rivier, S. Lee, J. E. Rivier and L. Riek, PLoS Biol., 2008, 6, 240–252 CAS.
- S. Gupta, T. Chattopadhyay, M. Pal Singh and A. Surolia, Proc. Natl. Acad. Sci. U. S. A., 2010, 107, 13246–13251 CrossRef CAS PubMed.
- S. K. Maji, M. H. Perrin, M. R. Sawaya, S. Jessberger, K. Vadodaria, R. A. Rissman, P. S. Singru, K. P. R. Nilsson, R. Simon and D. Schubert, Science, 2009, 325, 328–332 CrossRef CAS PubMed.
- T. Scheibel, R. Parthasarathy, G. Sawicki, X. M. Lin, H. Jaeger and S. L. Lindquist, Proc. Natl. Acad. Sci. U. S. A., 2003, 100, 4527–4532 CrossRef CAS PubMed.
- E. Gazit, FEBS J., 2007, 274, 317–322 CrossRef CAS PubMed.
- A. Herland, P. Björk, K. P. R. Nilsson, J. D. M. Olsson, P. Åsberg, P. Konradsson, P. Hammarström and O. Inganäs, Adv. Mater., 2005, 17, 1466–1471 CrossRef CAS.
- H. Tanaka, A. Herland, L. J. Lindgren, T. Tsutsui, M. R. Andersson and O. Inganäs, Nano Lett., 2008, 8, 2858–2861 CrossRef CAS PubMed.
- C. Li, J. Adamcik and R. Mezzenga, Nat. Nanotechnol., 2012, 7, 421–427 CrossRef CAS PubMed.
- J. F. Smith, T. P. J. Knowles, C. M. Dobson, C. E. MacPhee and M. E. Welland, Proc. Natl. Acad. Sci. U. S. A., 2006, 103, 15806–15811 CrossRef CAS PubMed.
- S. M. Pilkington, S. J. Roberts, S. J. Meade and J. A. Gerrard, Biotechnol. Prog., 2010, 26, 93–100 CAS.
- C. E. MacPhee and C. M. Dobson, J. Am. Chem. Soc., 2000, 122, 12707–12713 CrossRef CAS.
- A. J. Baldwin, R. Bader, J. Christodoulou, C. E. MacPhee, C. M. Dobson and P. D. Barker, J. Am. Chem. Soc., 2006, 128, 2162–2163 CrossRef CAS PubMed.
- T. P. J. Knowles, M. Vendruscolo and C. M. Dobson, Nat. Rev. Mol. Cell Biol., 2014, 15, 384–396 CrossRef CAS PubMed.
- R. Banerjee, S. C. Mande, V. Ganesh, K. Das, V. Dhanaraj, S. K. Mahanta, K. Suguna, A. Surolia and M. Vijayan, Proc. Natl. Acad. Sci. U. S. A., 1994, 91, 227–231 CrossRef CAS.
- G. B. Reddy, S. Bharadwaj and A. Surolia, Biochemistry, 1999, 38, 4464–4470 CrossRef CAS PubMed.
- S. K. Gunasekar, L. Anjia, H. Matsui and J. K. Montclare, Adv. Funct. Mater., 2012, 22, 2154–2159 CrossRef CAS.
- M. R. Nilsson, Methods, 2004, 34, 151–160 CrossRef CAS PubMed.
- A. Hawe, M. Sutter and W. Jiskoot, Pharm. Res., 2008, 25, 1487–1499 CrossRef CAS PubMed.
- H. Susi and D. M. Byler, Methods Enzymol., 1986, 130, 290–311 CAS.
- J. L. R. Arrondo, N. M. Young and H. H. Mantsch, Biochim. Biophys. Acta, Protein Struct. Mol. Enzymol., 1988, 952, 261–268 CrossRef CAS.
- G. Zandomeneghi, M. R. H. Krebs, M. G. McCammon and M. Fändrich, Protein Sci., 2004, 13, 3314–3321 CrossRef CAS PubMed.
- S. Srisailam, H. M. Wang, T. K. Kumar, D. Rajalingam, V. Sivaraja, H. S. Sheu, C. Chang and C. Yu, J. Biol. Chem., 2002, 277, 19027 CrossRef CAS PubMed.
- A. Bianco, K. Kostarelos, C. D. Partidos and M. Prato, Chem. Commun., 2005, 571–577 RSC.
- E. Mastrobattista and W. E. Hennink, Nat. Mater., 2012, 11, 10–12 CrossRef CAS PubMed.
- V. Vetri, C. Canale, A. Relini, F. Librizzi, V. Militello, A. Gliozzi and M. Leone, Biophys. Chem., 2007, 125, 184–190 CrossRef CAS PubMed.
- A. Quintas, D. C. Vaz, I. Cardoso, M. J. M. Saraiva and R. M. M. Brito, J. Biol. Chem., 2001, 276, 27207–27213 CrossRef CAS PubMed.
- A. Quintas, M. J. M. Saraiva and R. M. M. Brito, J. Biol. Chem., 1999, 274, 32943–32949 CrossRef CAS PubMed.
- J. Adamcik, J. M. Jung, J. Flakowski, P. D. L. Rios, G. Dietler and R. Mezzenga, Nat. Nanotechnol., 2010, 5, 423–428 CrossRef CAS PubMed.
- R. Lotan, E. Skutelsky, D. Danon and N. Sharon, J. Biol. Chem., 1975, 250, 8518–8523 CAS.
- N. J. Greenfield, Nat. Protoc., 2007, 1, 2733–2741 CrossRef PubMed.
Footnote |
| † Electronic supplementary information (ESI) available: Additional figures, data and other details including experimental as referred in the text. See DOI: 10.1039/c4ra04186k |
| This journal is © The Royal Society of Chemistry 2014 |


