Investigation of the reactions of U, U+ and U2+ with ammonia: mechanisms and topological analysis†
Peng Lia,
Wenxia Niub and
Tao Gao*a
aInstitute of Atomic and Molecular Physics, Sichuan University, Chengdu 610065, China. E-mail: gaotao@scu.edu.cn
bCollege of Physical Science and Technology, Sichuan University, Chengdu 610065, China
First published on 9th June 2014
Abstract
Reactions of uranium atom and ions (U, U+ and U2+) with NH3 have been studied in the gas phase using density functional calculations. The detailed description of reaction mechanisms and diverse topological analysis provide insights into the chemistry of uranium species. The reaction pathways leading to different products are closely examined. In the case of U and U+ reacting with NH3, the isomerization channel (the products are H2UNH and H2UNH+, respectively) and H2 elimination channel (decomposed to UNH + H2 and UNH+ + H2) were investigated. In the U2+ + NH3 reaction, UNH2+ was found to be the only product generated by the dehydrogenation of the HUNH22+ intermediate. The obtained results are compared to recent experimental studies. Bonding evolution along with the reactions was investigated using diverse topological analyses, including electron localization function, atoms in molecules, and natural bond orbital. A comparison with other results reported in the literature for similar systems, such as the reactions of uranium species with NH3, H2O and CH4, is made to underline the similarities and differences of the reaction mechanisms.
1. Introduction
During the two past decades, the reactions of actinide with small molecules in the gas phase have attracted considerable attention both in the theoretical1–7 and experimental investigations.8–12 These studies provide insights into the novel electronic structures and chemical properties of the actinide species. Ammonia is widely used as a nitrogen source in the production of metal nitrides and amides,13–16 hence the reaction of ammonia with actinide can provide insights into the formation mechanisms of actinide imines. It is found that the lone pair electrons of nitrogen plays a vital role in the bonding and structure of these metal imine molecules.17 In addition, the ammonia N–H bond activation by actinide atom and cations is also an important topic for the fundamental understanding of the activation of prototypical chemical bonds, and is conducive for exploring the influence of the electronic state of actinide species on the reactivity and reaction channel.Laser-ablated uranium atoms react with ammonia in the gas phase to form H2N–UH and HN![[double bond, length as m-dash]](https://www.rsc.org/images/entities/char_e001.gif) UH2,17 which were detected and characterized by infrared spectroscopic method. The possible reaction channel was proposed as following equation:
UH2,17 which were detected and characterized by infrared spectroscopic method. The possible reaction channel was proposed as following equation:
U + NH3 → U–NH3 → H2NUH → HN![[double bond, length as m-dash]](https://www.rsc.org/images/entities/char_e001.gif) UH2 UH2
| (1) |
This experiment also indicated that H2N–UH and HN![[double bond, length as m-dash]](https://www.rsc.org/images/entities/char_e001.gif) UH2 have comparable energies but visible light irradiation decreases the energy of H2N–UH and increases that of HN
UH2 have comparable energies but visible light irradiation decreases the energy of H2N–UH and increases that of HN![[double bond, length as m-dash]](https://www.rsc.org/images/entities/char_e001.gif) UH2.17 In addition to uranium, thorium atoms can activate N–H bonds in ammonia18 to form thorimine (HN
UH2.17 In addition to uranium, thorium atoms can activate N–H bonds in ammonia18 to form thorimine (HN![[double bond, length as m-dash]](https://www.rsc.org/images/entities/char_e001.gif) ThH2). Further analyses indicate that there are similarities between the reactions of Th and U with NH3.
ThH2). Further analyses indicate that there are similarities between the reactions of Th and U with NH3.
Experimental investigations mentioned above provide original information on the gas phase reactivity of U atoms. However, limitation exists in this reaction. To obtain detailed information on intermediate mechanisms as well as the nature of the bonding of the complexes, theoretical computation is of very important. On the other hand, quantum chemical and density functional theory (DFT) methods have been proven to be a successful method for the study of actinide compounds.19 Therefore, theoretical studies can be particularly valuable in providing additional detailed information regarding reaction mechanisms.20 Andrews and co workers studied the bond character of HN![[double bond, length as m-dash]](https://www.rsc.org/images/entities/char_e001.gif) ThH2 and HN
ThH2 and HN![[double bond, length as m-dash]](https://www.rsc.org/images/entities/char_e001.gif) UH2 using DFT.17,18 They revealed a new type of multiple bond from actinide atoms, an additional π bonding between the actinide and nitrogen due to an important contribution from the 5f and 6d orbitals.
UH2 using DFT.17,18 They revealed a new type of multiple bond from actinide atoms, an additional π bonding between the actinide and nitrogen due to an important contribution from the 5f and 6d orbitals.
To the best of our knowledge, experimental data on the products of the reaction of U cations with NH3 are scarce, and this is the first mechanistic study of these reactions. A systematic investigation of the reactivity of U atom and cations toward NH3 should provide a complete mechanistic scheme of this chemistry.
The main focus of the present work is to perform a thorough investigation of the reactions between U atom and cations (U+ and U2+) with NH3. The complete reaction mechanism for both high- and low-spin states and molecular structures and energetics properties of all the intermediates are reported. Bonding evolution during the reaction pathways were investigated in terms of diverse analyses, including electron localization function (ELF), atoms in molecules (AIM) and natural bond orbital (NBO). In addition, we compare the similarities and differences of the energy and mechanism of the reaction between uranium atom and cations and NH3, H2O and CH4 to provide insights into the chemistry of the uranium species.
2. Computational details
On the basis of the performance observed in previous DFT studies of the reaction between uranium atom and cations and H2O, N2O and CH4,1,3,5,12,21–24 different levels of theory were applied in our study to optimize the geometries of the minima and transition states on the potential energy surface of all the possible spin states. The B3LYP,25–27 PW91PW91,28,29 TPSSTPSS,30 PBE0,31 PBEPBE32 and BMK33 functionals were used along with the Stuttgart relativistic effective core potential (RECP)34 for the U atom. This small-core RECP treats 60 electrons as the “core”, named as SDD, leaving the n ≥ 5 shell (5s, 5p, 5d, 5f, 6s, 6p, 6d, and 7s) as the valence electrons. The SDD RECP constitutes a good balance between the relativistic corrections introduced via the RECP and valence electrons.1 For N and H atoms, the 6-311++G(d,p) basis sets by Pople and co-workers were employed.35 These calculations were carried out with the Gaussian 03 package.36 We ensured that the transition state obtained on each potential energy surface has only one imaginary frequency, and intrinsic reaction coordinate (IRC) calculation proved that each imaginary frequency correctly connects the reactants and products. The vibrational zero point energy (VZPE) corrections were included in all the relative energies. We investigated the expectation value of S2 to avoid spin contamination impact on the results, and ensured that the calculated values have low spin contamination.The investigation of bonding characteristic along the pathway is based on the analysis of the electron localization function (ELF),37,38 which were performed with the Multiwfn39 package. The topological properties of the (3, −1) bond critical points (bcp) in the gradient field of the electron density were analyzed using the atoms-in-molecules (AIM) theory,40 as implemented in the Multiwfn code. The bond order analysis was implemented within the natural bond orbital (NBO) scheme41,42 to gather detailed information of the evolution of chemical bonds during the reaction.
3. Results and discussion
To evaluate the accuracy of current computational schemes, first, we calculated the relative energies of atomic energy levels as well as the first and second adiabatic ionization potentials (IP) for the U atom. The results are listed in Table 1 along with the corresponding experimental values. As can be seen, results obtained by the approaches used in this study are in reasonable agreement with available experimental data. In addition to the PBE/SDD method, other methods correctly predict the ordering of electronic states. The PW91/SDD and BMK/SDD calculations are in good agreement with the experimental values of the relative energy levels. In the case of ionization potentials, these calculations also agree well with experimental results, especially the B3LYP/SDD method. Although, note that the BMK/SDD underestimates the IP1.| B3LYP/SDD | PW91/SDD | TPSS/SDD | PBE0/SDD | PBE/SDD | BMK/SDD | Exptl | |
|---|---|---|---|---|---|---|---|
| a Statistically averaged spin orbit energy levels obtained from http://web2.lac.u-psud.fr/lac/Database/Contents.html.b Ref. 44. | |||||||
| Triplet | 34.727 | 10.423 | 39.786 | 24.738 | 0.000 | 13.531 | 16.475a |
| Quintet | 0.000 | 0.000 | 0.000 | 0.000 | 30.794 | 0.000 | 0.000a |
| IP1 | 6.24 | 5.96 | 6.14 | 6.25 | 6.11 | 3.45 | 6.19b |
| IP2 | 11.58 | 11.21 | 10.93 | 11.16 | 11.17 | 12.52 | 11.59b |
In addition, we compared the calculated vibrational frequencies of the H2NUH and HNUH2 complexes with available experimental data. The results are collated in Table 2, along with the computational values reported by Andrews et al.17 Our results indicate that the adopted computational methods perform well in frequency calculation. In particular, the B3LYP and PW91 approaches give rise to a better agreement with the experimental values for both the complexes.
| B3LYP | PW91 | TPSS | PBE0 | PBE | BMK | Otherb | Otherc | Exptld | |
|---|---|---|---|---|---|---|---|---|---|
| a All calculations used the SDD for U and 6-311++G(d,p) for H and N atoms. All frequencies are in cm−1.b Ref. 14. Calculation at the B3LYP/TZP/SDD level of theory.c Ref. 14. Calculation at the PW91/TZP/SDD level of theory.d Ref. 14. Observed argon matrix frequencies. | |||||||||
| H2NUH | 3552.2 | 3477.6 | 3481.7 | 3601.8 | 3474.0 | 3639.5 | 3357.8 | 3486.1 | — |
| 3466.0 | 3381.3 | 3392.9 | 3508.2 | 3377.9 | 3549.4 | 3468.2 | 3387.6 | — | |
| 1537.8 | 1481.8 | 1528.5 | 1536.5 | 1477.9 | 1544.3 | 1540.9 | 1484.1 | 1488.6 | |
| 1339.2 | 1316.9 | 1350.6 | 1375.7 | 1315.1 | 1382.4 | 1382.2 | 1387.8 | 1349.8 | |
| 527.1 | 528.9 | 534.7 | 538.2 | 528.1 | 505.9 | 525.9 | 532.9 | — | |
| 505.9 | 482.5 | 523.9 | 515.1 | 480.2 | 480.4 | 489.4 | 465.7 | 508.5 | |
| 429.0 | 416.5 | 422.6 | 435.7 | 416.0 | 402.5 | 409.5 | 392.9 | — | |
| 231.2 | 222.8 | 327.1 | 241.3 | 228.9 | 235.1 | 252.0 | 237.2 | — | |
| 194.1 | 134.4 | 203.1 | 200.3 | 147.2 | 114.5 | 159.2 | 169.1 | — | |
| HNUH2 | 3560.7 | 3463.5 | 3470.2 | 3602.6 | 3440.7 | 3620.6 | 3558.8 | 3470.4 | — |
| 1441.2 | 1435.9 | 1449.3 | 1473.7 | 1442.4 | 1461.7 | 1465.2 | 1446.4 | 1436.3 | |
| 1381.8 | 1394.9 | 1374.7 | 1417.5 | 1412.6 | 1404.4 | 1420.4 | 1418.8 | 1403.0 | |
| 827.3 | 805.9 | 796.9 | 855.6 | 817.6 | 879.8 | 837.9 | 821.0 | 819.9 | |
| 572.0 | 523.3 | 548.6 | 657.6 | 532.7 | 576.9 | 520.9 | 514.8 | 495.7 | |
| 516.0 | 492.5 | 506.4 | 531.2 | 489.9 | 545.6 | 483.8 | 486.1 | 495.5 | |
| 470.3 | 470.0 | 478.5 | 473.9 | 480.0 | 480.8 | 471.6 | 473.0 | 465.1 | |
| 328.0 | 268.9 | 264.8 | 340.2 | 261.7 | 384.3 | 316.1 | 286.0 | — | |
| 248.3 | 239.7 | 198.3 | 266.1 | 254.2 | 378.0 | 258.1 | 244.6 | — | |
3.1 Reaction mechanisms
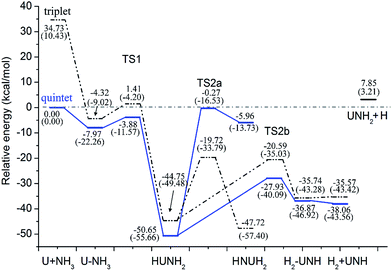 | ||
| Fig. 2 Potential energy profile for the reaction of U + NH3 computed at the B3LYP/SDD and PW91/SDD (in parentheses) levels of theory. | ||
| Reaction | TS | B3LYP | PW91 | TPSS | PBE0 | PBE | BMK |
|---|---|---|---|---|---|---|---|
| a SDD for U, U+ and U2+ and 6-311++G(d,p) for H and O atoms.b Calculated as the energy difference between the first transition state (TS1) and the first complex I.c Calculated as the energy difference between the second transition state (TS2a) and the intermediate II.d Calculated as the energy difference between the third transition state (TS2b) and the intermediate II. | |||||||
| U + NH3 | TS1b | 4.10 | 10.51 | 8.09 | 12.03 | 9.50 | 20.40 |
| TS2ac | 30.93 | 21.87 | 25.09 | 31.15 | 21.01 | 32.92 | |
| TS2bd | 22.72 | 15.57 | 18.85 | 21.32 | 13.95 | 27.37 | |
| U+ + NH3 | TS1b | 28.20 | 20.63 | 18.34 | 25.60 | 20.73 | 26.67 |
| TS2ac | 57.57 | 44.40 | 43.87 | 43.20 | 43.18 | 64.80 | |
| TS2bd | 24.70 | 13.10 | 12.77 | 6.43 | 13.34 | 25.33 | |
| U2+ + NH3 | TS1b | 61.26 | 46.49 | 42.30 | 49.71 | 46.22 | 25.95 |
| TS2c | 13.97 | 6.68 | 7.42 | 10.22 | 6.41 | 15.23 | |
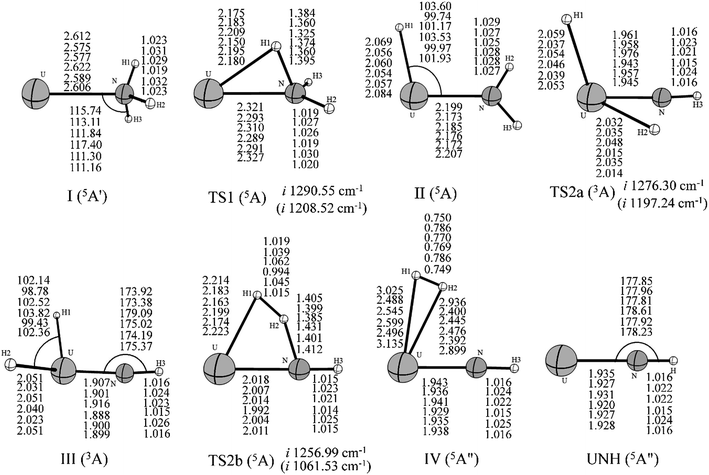
As can be seen in Fig. 2, the first step of the reaction involves the exothermic formation of an initial complex U–NH3. This complex has a 5A′ ground state and lies at −7.79 kcal mol−1 below the ground state reactants. Then, the U atom inserts into one of the N–H bond to form the intermediate (II) HUNH2. In this process, the system needs to overcome the first transition state TS1 (5A) with an activation barrier of 4.10 kcal mol−1 at the B3LYP/SDD level (10.51 kcal mol−1 at PW91/SDD method). The imaginary frequency of −1290.55 cm−1 at B3LYP/SDD level (−1208.52 cm−1 at PW91/SDD level) correspond primarily to the migration of an H atom from the nitrogen atom to the uranium. This intermediate HUNH2 is the global minimum of the potential energy profile and lies at −50.65 kcal mol−1 below the asymptote of the reactants.
From the HUNH2 intermediate, the system can occur along two reaction pathways. The first one is the isomerization. This reaction proceeds to form the uranimine HNUH2 after the system surpasses the second transition state, TS2a, which is labeled by an imaginary frequency of −1276.30 cm−1 at B3LYP/SDD level (−1197.24 cm−1 at PW91/SDD level), corresponding largely to the sequential movement of H atom to the U atom. Our calculations on HNUH2 predicted that the molecule should be non-planar and have a triplet (3A) ground state. It is worth noting that there is an intersystem crossing between the quintet and triplet spin surfaces. After this crossing point, the rest of the isomerization reaction evolves along the triplet spin surface, and the quintet PES marches at higher energy with respect to the triplet PES. This feature indicates that this isomerization is a two-state reaction (TSR). Further, we performed ab initio molecular dynamics (MD) simulation to confirm the thermal stability of this product H2UNH. Simulations were carried out for almost 5 ps using the Born–Oppenheimer molecular dynamics (BOMD)43 method in Gaussian03. Our MD runs indicate that the H2UNH structure maintains its identity at both room temperature (300 K) and high temperature (500 K). The details of this analysis are included in the ESI.†
Another reaction channel is toward the formation of dehydrogenation products. After the formation of the intermediate II, a second H atom migrating from nitrogen to uranium yields the molecular hydrogen complex, (H2)UNH (5A′′, complex IV in Fig. 1), overcoming a four-center transition state TS2b. From (H2)UNH, the system can proceed without any barrier toward UNH + H2. This transition state has an imaginary frequency of −1256.99 cm−1 at B3LYP/SDD level, corresponding to the expected motion that puts the two hydrogen atoms together. The TS2b lies at −20.59 kcal mol−1 below the reactant asymptote. In the H2–UNH structure, the H–H distance is 0.750 Å and 0.786 Å at B3LYP/SDD and PW91/SDD methods, respectively. In this case, the hydrogen molecule has already formed and electrostatically interacted with the UNH. The overall dehydrogenation of U + NH3 was calculated to be exothermic at −38.06 kcal mol−1 at B3LYP level of theory. Our results indicated that the entire lowest energy reaction pathway on this PES is lower in energy than the reactant asymptote.
The possible formation of UNH2 (quartet state) was also considered. This process may occur from the H–UNH2 intermediate by the cleavage of the H–U bond. However, we could not locate the transition state in this case, and the scan calculations performed by varying the H–U bond length indicated that this hydrogen–uranium bond breaking process is a barrierless intrinsic transition.
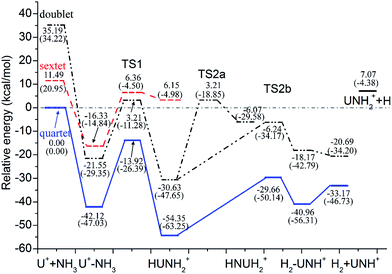 | ||
| Fig. 3 Potential energy profile for the reaction of U+ + NH3 computed at the B3LYP/SDD and PW91/SDD (in parentheses) levels of theory. | ||
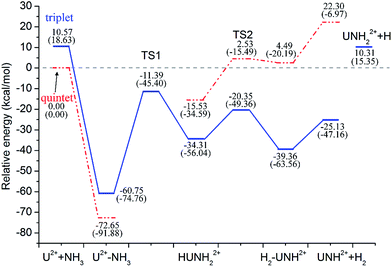 | ||
| Fig. 5 Potential energy profile for the reaction of U2+ + NH3 computed at the B3LYP/SDD and PW91/SDD (in parentheses) levels of theory. | ||
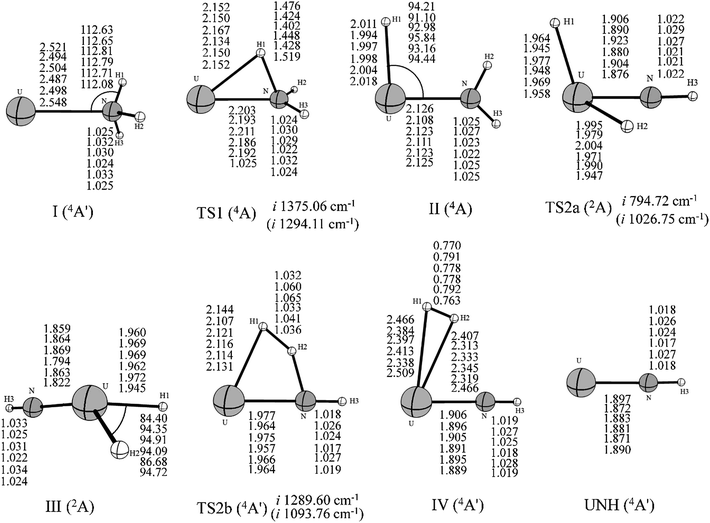
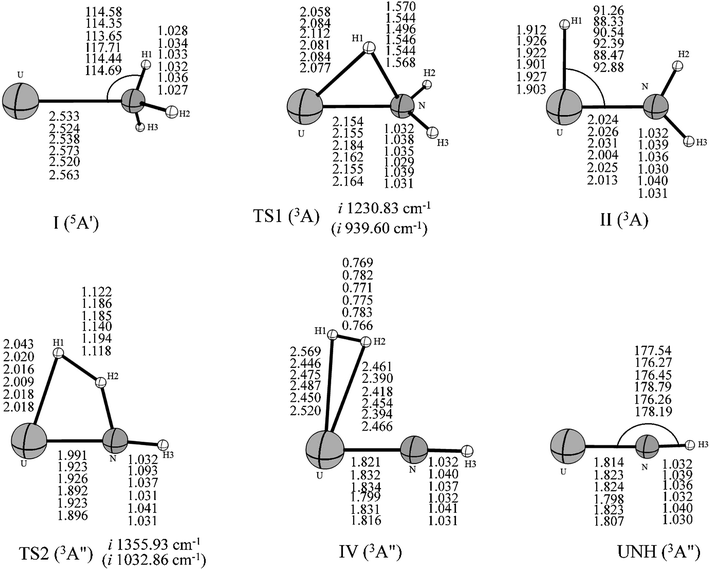
Our results indicated that the lowest-energy reactions of U+ and U2+ with NH3 evolve along a similar dehydrogenation channel as the U atom. Moreover, it is worth pointing out that these dehydrogenation channels occur under a mechanism similar to the insertion mechanism for the reaction of the bare actinide cations with H2O and CH4.1–4 The formation of U2+–NH3 is exothermic by as much as −72.65 kcal mol−1, which is larger than that computed for the U+–NH3 complex (−42.12 kcal mol−1) and significantly larger than that for the U–NH3 complex (−7.97 kcal mol−1). This may attributed to the extra charge on U2+, which provides significant electrostatic interaction for the U2+–NH3 complex. In addition, the possible formation of UNH2+ and UNH22+ (quintet and quartet state, respectively) from the H–UNH2 intermediate by the cleavage of the H–U bond were also considered. Our scan calculation results indicate that this hydrogen–uranium bond breaking process is a barrierless intrinsic transition. It is similar to the formation process of UNH2 during the reaction of U + NH3.
Despite these qualitative similarities in the dehydrogenation channels, some differences exist in the mechanism. First, in the case of U+ + NH3, the quartet state remains as the entire lowest-energy reaction path. After the HUNH2+ intermediate, the system does not occur along the two reaction pathways at lowest-energy spin surface such as those found for the U + NH3 case. The U+ reaction leads to the dehydrogenation on the entire lowest-energy reaction path. The isomerization channel competes only at the higher energy doublet spin surface. Second, our study indicated that U2+ reacts with NH3 to produce only UNH2+, implying that dehydrogenation is the only channel in this reaction. Unfortunately, despite careful reviews, all the attempts to localize TS1 along the quintet spin surface were unsuccessful. Although this deficiency prevents us from characterizing the quintet spin surface, the TS1 structure is definitely very high in energy, and it is certain that this reaction requires a spin crossing from the quintet spin surface to the triplet spin surface of the products. The change in spin state probably occurs in the vicinity of the first transition state before the formation of the intermediate complex II. The rest of the dehydrogenation reaction evolves along the triplet spin surface.
A comparison of the activation barrier heights (in Table 3) indicates that the reaction of U2+ and NH3 has to surpass the highest first activation barrier (around 57.16 and 33.06 kcal mol−1 higher than U atom and U+ at B3LYP/SDD method, respectively). On the other hand, the exothermic energy of the dehydrogenation reaction decreases on going from U to U+ and finally U2+. The reactivity of uranium species toward ammonia N–H bond activation should be related to the electrons in 5f orbitals because evidence is emerging that the 5f electrons increase the size of activation barrier in the early actinide species and the direct participation of 5f orbitals makes the insertion process unfavorable.5
To conclude this section, our results reveal that the uranimine HN![[double bond, length as m-dash]](https://www.rsc.org/images/entities/char_e001.gif) UH2 is the lowest energy final product in the reaction of the U atom and NH3, whereas the dehydrogenation products have the lowest energies in the case of U+ and U2+. The reaction mechanism of the formation of primary reaction products are given below along with reaction energies computed by the relativistic B3LYP/SDD methods.
UH2 is the lowest energy final product in the reaction of the U atom and NH3, whereas the dehydrogenation products have the lowest energies in the case of U+ and U2+. The reaction mechanism of the formation of primary reaction products are given below along with reaction energies computed by the relativistic B3LYP/SDD methods.
| U + NH3 → U–NH3 → HUNH2 → HNUH2, ΔE = −47.72 kcal mol−1 | (2) |
| U + NH3 → U–NH3 → HUNH2 → UNH + H2, ΔE = −38.06 kcal mol−1 | (3) |
| U+ + NH3 → U+–NH3 → HUNH2+ → HNUH2+, ΔE = −6.07 kcal mol−1 | (4) |
| U+ + NH3 → U+–NH3 → HUNH2+ → UNH+ + H2, ΔE = −33.17 kcal mol−1 | (5) |
| U2+ + NH3 → U2+–NH3 → HUNH22+ → UNH2+ + H2, ΔE = −25.13 kcal mol−1 | (6) |
3.2 Bonding analysis
To evaluate the bonding evolution of each species involved in the studied reaction pathways, different topological methods such as ELF, AIM and NBO analysis were performed. The ELF calculation did not provide a clear core–valence separation on the U center when the effective core potential (ECP) was used. However, evidence is emerging that electron density obtained from a small-core ECP calculation is sufficient to reproduce not only the correct topology of the uranium–ligand bonds but also the values of the local properties3,21,45 because the deeper uranium core has little impact on the topological properties of the valence. Therefore, the small-core RECP used in this work is probably responsible for these observations. ELF and AIM analysis were performed using wave functions computed at the PW91/SDD method along with the 60 electron SDD small-core RECP.The ELF localization domains (η = 0.70) of the lowest-energy minima and transition states, corresponding to the U + NH3 reaction pathway are collated in Fig. 7, whereas those corresponding to U+(2+) + NH3 are reported in the Supporting Information (Fig. S1 and S2†). We have also listed the AIM parameters of these species in Tables 4–6. It is worth mentioning that these AIM parameters of bond critical points (bcp) are powerful tools in investigating the characterization and evolution of chemical bonds.39,46–48
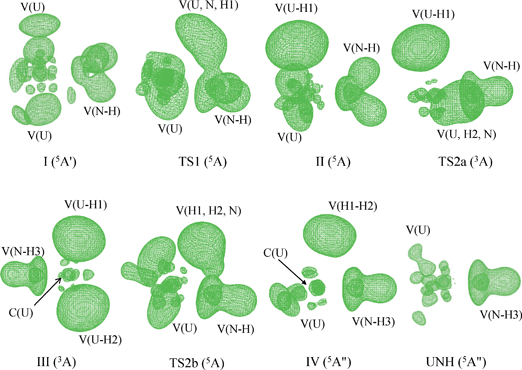 | ||
| Fig. 7 ELF localization domains (η = 0.70) of the lowest energy minima and transition states corresponding to the U + NH3 reaction pathway. | ||
| Bond | I (5A′) | TS1 (5A) | II (5A) | TS2a (3A) | III (3A) | TS2b (5A) | IV (5A′′) | |||||||
|---|---|---|---|---|---|---|---|---|---|---|---|---|---|---|
| ρ(bcp) | ▽2ρ(bcp) | ρ(bcp) | ▽2ρ(bcp) | ρ(bcp) | ▽2ρ(bcp) | ρ(bcp) | ▽2ρ(bcp) | ρ(bcp) | ▽2ρ(bcp) | ρ(bcp) | ▽2ρ(bcp) | ρ(bcp) | ▽2ρ(bcp) | |
| a ρ(bcp) and ▽2ρ(bcp) in au. For H2 ρ(bcp) = 0.259 au; ▽2ρ(bcp) = −1.021 au. For the N–H bond in NH3 ρ(bcp) = 0.329 au; ▽2ρ(bcp) = −1.398 au. | ||||||||||||||
| U–N | 0.049 | +0.141 | 0.089 | +0.234 | 0.119 | +0.264 | 0.190 | +0.341 | 0.209 | +0.426 | 0.165 | +0.363 | 0.189 | +0.423 |
| N–H1 | 0.318 | −1.382 | 0.147 | −0.136 | ||||||||||
| N–H2 | 0.318 | −1.382 | 0.319 | −1.377 | 0.316 | −1.290 | 0.128 | −0.050 | 0.132 | −0.070 | ||||
| N–H3 | 0.318 | −1.382 | 0.320 | −1.391 | 0.319 | −1.313 | 0.322 | −1.423 | 0.317 | −1.365 | 0.320 | −1.365 | 0.317 | −1.331 |
| U–H1 | 0.084 | +0.039 | 0.089 | +0.016 | 0.093 | +0.005 | 0.060 | +0.136 | 0.033 | +0.101 | ||||
| U–H2 | 0.093 | +0.005 | ||||||||||||
| H1–H2 | 0.132 | −0.244 | 0.237 | −0.868 | ||||||||||
| Bond | I (4A′) | TS1 (4A) | II (4A) | TS2a (2A) | III (2A) | TS2b (4A′) | IV (4A′) | |||||||
|---|---|---|---|---|---|---|---|---|---|---|---|---|---|---|
| ρ(bcp) | ▽2ρ(bcp) | ρ(bcp) | ▽2ρ(bcp) | ρ(bcp) | ▽2ρ(bcp) | ρ(bcp) | ▽2ρ(bcp) | ρ(bcp) | ▽2ρ(bcp) | ρ(bcp) | ▽2ρ(bcp) | ρ(bcp) | ▽2ρ(bcp) | |
| a ρ(bcp) and ▽2ρ(bcp) in au. For H2 ρ(bcp) = 0.259 au; ▽2ρ(bcp) = −1.021 au. For the N–H bond in NH3 ρ(bcp) = 0.329 au; ▽2ρ(bcp) = −1.398 au. | ||||||||||||||
| U–N | 0.063 | +0.148 | 0.119 | +0.226 | 0.140 | +0.267 | 0.222 | +0.386 | 0.229 | +0.446 | 0.184 | +0.383 | 0.213 | +0.431 |
| N–H1 | 0.318 | −1.438 | 0.129 | −0.080 | ||||||||||
| N–H2 | 0.318 | −1.437 | 0.317 | −1.434 | 0.315 | −1.365 | 0.102 | +0.046 | 0.135 | −0.079 | ||||
| N–H3 | 0.318 | −1.437 | 0.317 | −1.434 | 0.316 | −1.365 | 0.317 | −1.512 | 0.308 | −1.444 | 0.318 | −1.457 | 0.316 | −1.417 |
| U–H1 | 0.097 | +0.012 | 0.114 | −0.053 | 0.111 | −0.066 | 0.072 | +0.119 | ||||||
| U–H2 | 0.089 | +0.069 | 0.111 | −0.066 | 0.039 | +0.138 | ||||||||
| H1–H2 | 0.127 | −0.219 | 0.234 | −0.853 | ||||||||||
| Bond | I (5A′) | TS1 (3A) | II (3A) | TS2 (3A′′) | IV (3A′′) | UNH (3A′′) | ||||||
|---|---|---|---|---|---|---|---|---|---|---|---|---|
| ρ(bcp) | ▽2ρ(bcp) | ρ(bcp) | ▽2ρ(bcp) | ρ(bcp) | ▽2ρ(bcp) | ρ(bcp) | ▽2ρ(bcp) | ρ(bcp) | ▽2ρ(bcp) | ρ(bcp) | ▽2ρ(bcp) | |
| a ρ(bcp) and ▽2ρ(bcp) in au. For H2 ρ(bcp) = 0.259 au; ▽2ρ(bcp) = −1.021 au. For the N–H bond in NH3 ρ(bcp) = 0.329 au; ▽2ρ(bcp) = −1.398 au. | ||||||||||||
| U–N | 0.061 | +0.134 | 0.130 | +0.235 | 0.173 | +0.241 | 0.203 | +0.377 | 0.246 | +0.463 | 0.252 | +0.467 |
| N–H1 | 0.317 | −1.462 | 0.104 | −0.001 | ||||||||
| N–H2 | 0.317 | −1.462 | 0.309 | −1.457 | 0.299 | −1.372 | 0.180 | −0.293 | ||||
| N–H3 | 0.317 | −1.462 | 0.310 | −1.468 | 0.304 | −1.448 | 0.304 | −1.556 | 0.302 | −1.509 | 0.301 | −1.528 |
| U–H1 | 0.125 | −0.129 | 0.095 | +0.012 | ||||||||
| U–H2 | 0.038 | +0.098 | ||||||||||
| H1–H2 | 0.097 | −0.081 | 0.237 | −0.897 | ||||||||
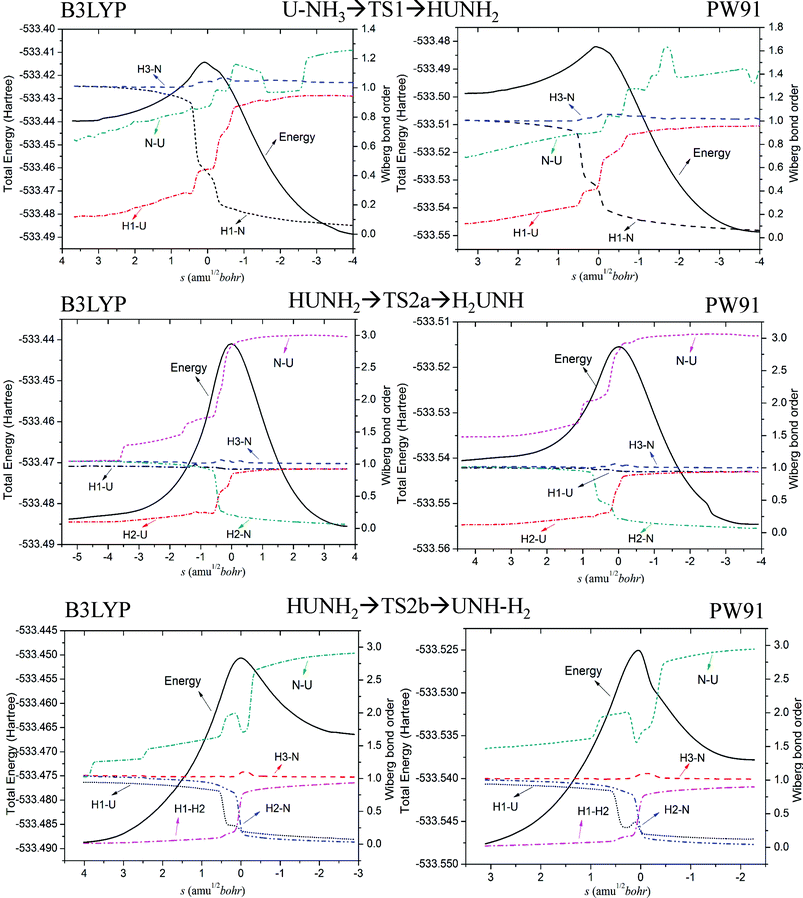
Fig. 8 clearly shows that as the reaction proceeds, the bond order of breaking bonds gradually decreases to zero, while that of the new bonds gradually increases. Furthermore, the position of the transition state is close to the crossing region of these two sets of bond order (the forming bond and the breaking bond). As can be seen in the TS2b process of Fig. 8, the U–N bond order curve has a small valley in the vicinity of the transition state. This may due to the fact that the trisynaptic basin V(H1, H2, N) gathers more electrons of system compared with other basins. Wiberg bond order analysis suggests that the “U–N” bond in those products are in fact showing multiple bond character, with a high bond order (around 3.0) in HNMH2 (M = U and U+) and H2AnNH (An = U, U+ and U2+).
To analyze the relative contribution of 5f electrons/orbitals in the title reaction, we performed the NBO analysis for final complexes (III and IV), and the results are summarized in Table 7. As seen in this table, a direct participation of 5f orbitals and a df hybridization with a large contribution of 6d orbitals is observed in these final complexes, as observed during the reaction of early actinide ions with CH4.5 Significant contribution of 5f orbitals is found in the chemical bond of the U2+ complex. Therefore, these features suggest that the 5f-orbital participation is important in the reactivity of uranium species.
| Reaction | Complex | Atom | Charge | Electron configuration | Bond character |
|---|---|---|---|---|---|
| Isomerization | HNUH2 (III) | U | −0.359 | 5f2.31 6d0.75 | f[22.83%] d[62.70%] |
| 7s0.33 7p0.03 | s[14.24%] p[0.22%] | ||||
| N | −0.487 | 2s0.79 2p2.20 | s[56.40%] p[ 43.59%] | ||
| HNUH2+ (III) | U | 1.938 | 5f2.67 6d1.18 | f[60.68%] d[38.72%] | |
| 7s0.27 7p0.07 | s[0.29%] p[0.30%] | ||||
| N | −0.900 | 2s0.79 2p2.10 | s[2.74%] p[97.25%] | ||
| Dehydrogenation | H2–UNH (IV) | U | 0.928 | 5f3.12 6d1.10 | f[29.66%] d[61.89%] |
| 7s0.90 7p0.03 | s[8.18%] p[0.27%] | ||||
| N | −1.283 | 2s1.62 2p4.65 | s[53.20%] p[46.80%] | ||
| H2–UNH+ (IV) | U | 1.784 | 5f3.27 6d0.91 | f[42.37%] d[57.54%] | |
| 7s0.11 7p0.02 | s[0.00%] p[0.09%] | ||||
| N | −1.213 | 2s1.63 2p4.57 | s[0.00%] p[99.99%] | ||
| H2–UNH2+ (IV) | U | 2.395 | 5f2.90 6d0.74 | f[68.10%] d[31.83%] | |
| 7s0.05 7p0.01 | s[0.00%] p[0.07%] | ||||
| N | −0.945 | 2s1.63 2p4.30 | s[0.00%] p[99.98%] |
3.3 A comparison between the reaction of uranium species with H2O, CH4 and NH3
Water, methane and ammonia are isoelectronic molecules.14,50 The mechanisms of the gas phase reaction between the U atom with H2O has been studied by Andrews and co workers12 by reacting laser-ablated U atoms with H2O during condensation under excess argon. The isomerization channel (H2UO was the product) and the H2 elimination channel (decomposed to UO + H2) were observed. These two similar pathways have also been addressed in our present study in the U + NH3 reaction. To the best of our knowledge, the gas-phase study of U atom + CH4 is scarce, and little is known about their intermediates and mechanisms.The reaction of U cations (U+ and U2+) with H2O or CH4 have been well-studied by several earlier investigations.1,5,21,24,51 Comparisons of the obtained results show that the reaction mechanisms are similar but the energetics are significantly different.
As seen in Fig. 3 and 5 in the present work and the PES of U+(2+) reacting with H2O and CH4 in the literature mentioned above, the behavior of the mechanisms is similar in all the systems considered, especially for the dehydrogenation channel. It can be summarized that in the first stage the reactants form a stable ion–dipole complex (I), U–MHx+(2+) (M = O, N and C; x = 2, 3 or 4, respectively). Then, the U+(2+) inserts into the M − H bond, followed by the first M − H bond breaking, which is realized by a first transition state TS1. After that, the system forms the inserted intermediate (II) HUMHy+(2+) (y = 1, 2 or 3), which lies lower in energy than the reactants. After passing through a four-center transition state TS2b, the reaction proceeds to yield a molecular hydrogen complex, (H2)UMHz+(2+) (z = 1 or 2). Finally, UMHz+(2+) + H2 products are formed directly from this hydrogen complex.
Another similarity is that the entire dehydrogenation path occurs along the ground spin surface, and the intermediate II is the global minimum in U+ + H2O, CH4 and NH3. Whereas in the case of U2+, the dehydrogenation channel evolves an intersystem, crossing between the quintet and triplet state, and the global minimum is the complex I.
In addition to the similarities between mechanisms, there are differences in the energetics. The relative energy of complex I and dehydrogenation products with respect to the ground state reactants as well as the activation barriers of the transition states for the reaction of U+(2+) + H2O, CH4 and NH3 are listed in Table 8. To guarantee the reliability, we selected the reported values that were computed by the same method B3LYP/SDD for the comparison. It can be seen that the relative energy of complex I decreases on going from NH3 to H2O and finally CH4. The reaction with NH3 has the highest activation barrier in TS1, whereas the highest activation barrier of TS2b is found in the reaction with H2O. Both NH3 and H2O cases are exothermic, and the most exothermic is the reaction with H2O. On the contrary, U+(2+) + CH4 were computed to be endothermic, particularly the U2+ should not activate CH4, which is in accordance with the experimental observations.24
| Reaction | ΔEIa | TS1b | TS2bc | ΔEpd |
|---|---|---|---|---|
| a Energy difference between the complex I and the ground state reactants.b Energy difference between the transition state TS1 and the second complex I.c Energy difference between the transition state TS2b and the third complex II.d Energy difference between the dehydrogenation products and the ground state reactants.e in the present work.f Ref. 1.g Ref. 21.h Ref. 24. | ||||
| U+ + NH3e | −42.12 | 28.20 | 24.69 | −33.17 |
| U2+ + NH3e | −72.65 | 61.26 | 13.96 | −25.13 |
| U+ + H2Of | −30.91 | 14.52 | 31.56 | −49.65 |
| U2+ + H2Of | −52.26 | 34.27 | 29.79 | −30.28 |
| U+ + CH4g | −21.6 | 18.88 | 27.48 | 16.94 |
| U2+ + CH4h | −24.61 | 39.67 | 9.08 | 24.13 |
4. Conclusions
The theoretical calculations have been performed to investigate the mechanism of the gas phase reaction of U and U+(2+) with NH3. The present results contribute to a better understanding of the two types of reaction channels, isomerization and dehydrogenation, for the title reactions. The bonding nature was analyzed on the basis of ELF, AIM and NBO calculations. The main conclusions can be summarized as follows.(i) For the U + NH3 reaction, there is a spin surface crossing in the isomerization pathway. It is different from that of the U+ + NH3 and U2+ + NH3, in which no spin crossing was found on the lowest energy surface. Our calculations indicate that the lowest energy pathway of both the channels is exothermic, which does not involve reaction barriers over the reactant asymptotes. The formation of HNUH2 is the reaction with the higher exothermicity, calculated at −47.72 kcal mol−1 at B3LYP/SDD level of theory.
(ii) In the case of U+ + NH3, the minimum energy pathway was computed as the dehydrogenation. The dehydrogenation pathway evolves along the quartet state from the initial complex to the final products. The isomerization channel competes only at the higher energy doublet spin surface.
(iii) For the U2+ + NH3 reaction, UNH2+ was found to be the only product generated from the dehydrogenation. This reaction has to surpass the highest barrier for the first transition state compared to that of the U and U+ cases. On the contrary, the second barrier height of U2+ and NH3 is the lowest.
(iv) ELF analysis indicated that the U–N bond in all species is characterized by high ionic character. This fact is supported by the AIM results, which provide important insights into the chemical bond evolution of the reactions. The results indicate that the ▽2ρ(bcp) for U–N bcps becomes more positive, indicating that the ionic character of the U–N chemical bonds becomes stronger.
Acknowledgements
We are very grateful to Dr Sobereva for many helpful discussions and who provided us the Multiwfn package. Computer time made available by the Center of High Performance Computing at Physics discipline of Sichuan University is gratefully acknowledged.Notes and references
- M. D. C. Michelini, N. Russo and E. Sicilia, Angew. Chem., Int. Ed., 2006, 45, 1095–1099 CrossRef CAS PubMed.
- M. D. C. Michelini, N. Russo and E. Sicilia, J. Am. Chem. Soc., 2007, 129, 4229–4239 CrossRef CAS PubMed.
- M. E. Alikhani, M. D. C. Michelini, N. Russo and E. Sicilia, J. Phys. Chem. A, 2008, 112, 12966–12974 CrossRef CAS PubMed.
- G. Mazzone, M. D. C. Michelini, N. Russo and E. Sicilia, Inorg. Chem., 2008, 47, 2083–2088 CrossRef CAS PubMed.
- K. J. de Almeida and H. A. Duarte, Organometallics, 2009, 28, 3203–3211 CrossRef CAS.
- K. J. de Almeida and H. A. Duarte, Organometallics, 2010, 29, 3735–3745 CrossRef CAS.
- J. Zhou and H. B. Schlegel, J. Phys. Chem. A, 2010, 114, 8613–8617 CrossRef CAS PubMed.
- M. Santos, J. Marcüalo, A. P. de Matos, J. K. Gibson and R. G. Haire, J. Phys. Chem. A, 2002, 106, 7190–7194 CrossRef CAS.
- G. P. Jackson, F. L. King, D. E. Goeringer and D. C. Duckworth, J. Phys. Chem. A, 2002, 106, 7788–7794 CrossRef CAS.
- B. Y. Liang, L. Andrews, J. Li and B. E. Bursten, J. Am. Chem. Soc., 2002, 124, 6723–6733 CrossRef CAS PubMed.
- J. K. Gibson, R. G. Haire, M. Santos, J. Marcüalo and A. P. de Matos, J. Phys. Chem. A, 2005, 109, 2768–2781 CrossRef CAS PubMed.
- B. Y. Liang, R. D. Hunt, G. P. Kushto, L. Andrews, J. Li and B. E. Bursten, Inorg. Chem., 2005, 44, 2159–2168 CrossRef CAS PubMed.
- M. H. Chen, H. Lu, J. Dong, L. Miao and M. F. Zhou, J. Phys. Chem. A, 2002, 106, 11456–11464 CrossRef CAS.
- N. Russo and E. Sicilia, J. Am. Chem. Soc., 2001, 122, 2588–2596 CrossRef PubMed.
- M. D. C. Michelini, N. Russo and E. Sicilia, Inorg. Chem., 2004, 43, 4944–4952 CrossRef CAS PubMed.
- M. F. Zhou, M. H. Chen, L. N. Zhang and H. Lu, J. Phys. Chem. A, 2002, 106, 9017–9023 CrossRef CAS.
- X. F. Wang, L. Andrews and C. J. Marsden, Chem.–Eur. J., 2008, 14, 9192–9201 CrossRef CAS PubMed.
- X. F. Wang, L. Andrews and C. J. Marsden, Chem.–Eur. J., 2007, 13, 5601–5606 CrossRef CAS PubMed.
- G. A. Shamov, G. Schreckenbach and T. N. Vo, Chem.–Eur. J., 2007, 13, 4932–4947 CrossRef CAS PubMed.
- W. Koch and M. C. Holthausen, A Chemist's Guide to Density Functional Theory, Wiley-VCH, New York, 2000 Search PubMed.
- E. Di Santo, M. D. C. Michelini and N. Russo, Organometallics, 2009, 28, 3716–3726 CrossRef CAS.
- E. Di Santo, M. D. C. Michelini and N. Russo, J. Phys. Chem. A, 2009, 113, 14699–14705 CrossRef CAS PubMed.
- P. Li, W. X. Niu, X. F. Tian, T. Gao and H. Y. Wang, Int. J. Quantum Chem., 2004, 114, 760–768 CrossRef.
- E. Di Santo, M. Santos, M. D. C. Michelini, J. Marçalo, N. Russo and J. K. Gibson, J. Am. Chem. Soc., 2011, 133, 1955–1970 CrossRef CAS PubMed.
- A. D. Becke, J. Chem. Phys., 1993, 98, 1372–1377 CrossRef CAS PubMed.
- A. D. Becke, J. Chem. Phys., 1993, 98, 5648–5652 CrossRef CAS PubMed.
- C. Lee, W. Yang and R. G. Parr, Phys. Rev. B: Condens. Matter Mater. Phys., 1988, 37, 785–789 CrossRef CAS.
- J. P. Perdew, J. A. Chevary, S. H. Vosko, K. A. Jackson, M. R. Pederson, D. J. Singh and C. Fiolhais, Phys. Rev. B: Condens. Matter Mater. Phys., 1992, 46, 6671–6682 CrossRef CAS.
- J. P. Perdew, K. Burke and Y. Wang, Phys. Rev. B: Condens. Matter Mater. Phys., 1996, 54, 16533–16539 CrossRef CAS.
- J. Tao, J. P. Perdew, V. N. Staroverov and G. E. Scuseria, Phys. Rev. Lett., 2003, 91, 146401 CrossRef.
- C. Adamo and V. Barone, J. Chem. Phys., 1999, 110, 6158–6169 CrossRef CAS PubMed.
- J. P. Perdew, K. Burke and M. Ernzerhof, Phys. Rev. Lett., 1996, 77, 3865 CrossRef CAS.
- A. D. Boese and M. L. M. Jan, J. Chem. Phys., 2004, 121, 3405–3416 CrossRef CAS PubMed.
- W. Kuchle, M. Dolg, H. Stoll and H. Preuss, J. Chem. Phys., 1994, 100, 7535–7542 CrossRef PubMed.
- (a) R. Krishnan, J. S. Binkley, R. Seeger and J. A. Pople, J. Chem. Phys., 1980, 72, 650–654 CrossRef CAS PubMed; (b) J. P. Blaudeau, M. P. McGrath, L. A. Curtiss and L. Radom, J. Chem. Phys., 1997, 107, 5016–5021 CrossRef CAS PubMed.
- M. J. Frisch, G. W. Trucks, H. B. Schlegel, G. E. Scuseria, M. A. Robb, J. R. Cheeseman, J. A. Montgomery, Jr, T. Vreven, K. N. Kudin, J. C. Burant, J. M. Millam, S. S. Iyengar, J. Tomasi, V. Barone, B. Mennucci, M. Cossi, G. Scalmani, N. Rega, G. A. Petersson, H. Nakatsuji, M. Hada, M. Ehara, K. Toyota, R. Fukuda, J. Hasegawa, M. Ishida, T. Nakajima, Y. Honda, O. Kitao, H. Nakai, M. Klene, X. Li, J. E. Knox, H. P. Hratchian, J. B. Cross, V. Bakken, C. Adamo, J. Jaramillo, R. Gomperts, R. E. Stratmann, O. Yazyev, A. J. Austin, R. Cammi, C. Pomelli, J. W. Ochterski, P. Y. Ayala, K. Morokuma, G. A. Voth, P. Salvador, J. J. Dannenberg, V. G. Zakrzewski, S. Dapprich, A. D. Daniels, M. C. Strain, O. Farkas, D. K. Malick, A. D. Rabuck, K. Raghavachari, J. B. Foresman, J. V. Ortiz, Q. Cui, A. G. Baboul, S. Clifford, J. Cioslowski, B. B. Stefanov, G. Liu, A. Liashenko, P. Piskorz, I. Komaromi, R. L. Martin, D. J. Fox, T. Keith, M. A. Al-Laham, C. Y. Peng, A. Nanayakkara, M. Challacombe, P. M. W. Gill, B. Johnson, W. Chen, M. W. Wong, C. Gonzalez and J. A. Pople, Gaussian 03, Revision E.01, Gaussian Inc., Wallingford CT, 2004 Search PubMed.
- A. D. Becke and K. E. Edgecombe, J. Chem. Phys., 1990, 92, 5397–5403 CrossRef CAS PubMed.
- A. Savin, R. Nesper, S. Wengert and T. R. Fassler, Angew. Chem., Int. Ed. Engl., 1997, 36, 1808–1832 CrossRef CAS.
- T. Lu and F. Chen, J. Comput. Chem., 2012, 33, 580–592 CrossRef CAS PubMed.
- R. F. W. Bader, Atoms in Molecules. A quantum theory, Clarendon, Oxford, 1990 Search PubMed.
- A. E. Reed and F. Weinhold, J. Chem. Phys., 1985, 83, 1736–1740 CrossRef CAS PubMed.
- A. E. Reed, L. A. Curtiss and F. Weinhold, Chem. Rev., 1988, 88, 899–926 CrossRef CAS.
- V. Bakken, J. M. Millam and H. B. Schlegel, J. Chem. Phys., 1999, 111, 8773–8777 CrossRef CAS PubMed.
- J. Blaise and J.-F. Wyart, International Tables of Selected Constants, Energy Levels and Atomic Spectra of Actinides, Vol. 20, Tables of Constants and Numerical Data, Paris, 1992 Search PubMed.
- S. F. Vyboishchikov, A. Sierraalta and G. Frenking, J. Comput. Chem., 1996, 18, 416–429 CrossRef.
- C. H. Suresh and N. Koga, Inorg. Chem., 2002, 41, 1573–1578 CrossRef CAS PubMed.
- Y. Zhao and D. G. Truhlar, J. Phys. Chem. A, 2004, 108, 6908–6918 CrossRef CAS.
- C. H. Suresh and P. K. Sajith, Inorg. Chem., 2011, 50, 8085–8093 CrossRef PubMed.
- K. B. Wiberg, Tetrahedron, 1968, 24, 1083–1096 CrossRef CAS.
- H. A. Bent, J. Chem. Educ., 1996, 43, 170–186 CrossRef.
- P. Li, W. X. Niu, X. F. Tian, T. Gao and H. Y. Wang, J. Phys. Chem. A, 2013, 117, 3761–3770 CrossRef CAS PubMed.
Footnote |
| † Electronic supplementary information (ESI) available. See DOI: 10.1039/c4ra03525a |
| This journal is © The Royal Society of Chemistry 2014 |

