Dual dispersive extraction combined with electrothermal vaporization inductively coupled plasma mass spectrometry for determination of trace REEs in water and sediment samples

X. Q. Guo, X. T. Tang, M. He, B. B. Chen, K. Nan, Q. Y. Zhang and B. Hu*
Key Laboratory of Analytical Chemistry for Biology and Medicine (Ministry of Education), Department of Chemistry, Wuhan University, Wuhan 430072, P.R. China. E-mail: binhu@whu.edu.cn; Fax: +86-27-68754067; Tel: +86-27-87652162

Received 23rd February 2014 , Accepted 14th April 2014

First published on 16th April 2014


Abstract

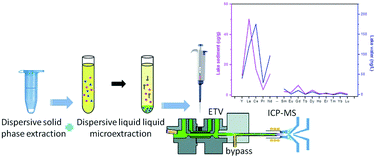
A simple and efficient two-step method based on dispersive solid phase extraction (D-SPE) and dispersive liquid–liquid microextraction (DLLME) has been developed for the separation and preconcentration of 15 rare earth elements (REEs) from environmental water and sediment samples, followed by electrothermal vaporization-inductively coupled plasma mass spectrometry (ETV-ICP-MS) detection. With Chelex 100 as the adsorbent of D-SPE, target REEs were firstly extracted and the retained REEs were then desorbed by 0.1 mol L−1 HNO3. After 125 mmol L−1 Tris and 40 mmol L−1 1-phenyl-3-methyl-4-benzoylpyrazolone (PMBP) were added into the above elution solution, target REEs were further preconcentrated into CCl4 by DLLME. The developed dual extraction technique exhibited high enrichment factors (234 to 566-fold) and good anti-interference ability. Various parameters affecting the extraction of target REEs by D-SPE and DLLME were investigated in detail. Under the optimal conditions, the limits of detection (LODs, 3σ) for target REEs were in the range of 0.003–0.073 ng L−1 with the relative standard deviations (CY,La,Ce,Pr,Nd,Gd,Dy = 1.0 ng L−1, CSm,Eu,Tb,Ho,Er,Tm,Yb,Lu = 0.2 ng L−1, n = 7) ranging from 6.7 to 11.5%. The proposed method of D-SPE-DLLME-ETV-ICP-MS was successfully applied to the determination of 15 REEs in water and sediment samples with the recoveries of 78–115% and 75–117% for the spiked water and sediment samples, respectively. To validate the accuracy of the method, a Certified Reference Material of GBW07301a stream sediment was analyzed and the determined values were in good agreement with the certified values.

Introduction

Rare earth elements (REEs) find wide applications in many fields, e.g. as superconductors and supermagnets in industry, petrogenetic tracers in geochemistry, microelement fertilizer in agriculture, feed additives in animal stockbreeding, and magnetic resonance imaging reagents in medicine.1,2 Consequently, more and more REEs have been discharged and accumulated in environment, such as natural water and sediment, and finally enter the human body through the food chain.3 It was demonstrated that trace REEs has inhibitory as well as stimulatory effects on the crystallization of urinary stones.4 Therefore, the determination of REEs in natural water and sediment is crucial for the public health safety and environmental pollution control.

Due to the low concentration level of REEs in real-world water and sediment samples and the complicated sample matrix, an efficient separation and preconcentration technique is frequently required prior to their determination. Up to the present, solid phase extraction (SPE),5–9 capillary microextraction (CME),10 cloud point extraction (CPE),11 and liquid phase microextraction (LPME)12–14 have been employed for the determination of REEs in environmental, biological and food samples. Among them, SPE with a suitable adsorption material was most widely employed in REEs analysis due to its distinct advantages, such as simple operation, fast kinetics, low-cost, less pollution to the environment and easy automation. Various adsorption materials including alkyl phosphinic acid resin,6 polyhydroxamic acid chelating resin,4 2,6-diacetylpyridine functionalized Amberlite XAD-4 resin,9 iminodiacetate chelating resin (Chelex 100)15–17 and multi-walled carbon nanotubes7,8 were widely used. Among them, Chelex 100 has been proven to be very efficient for the preconcentration of REEs. Pasinli et al.17 made a thorough comparison of adsorption efficiency of different adsorption materials, including various zeolites (clinoptilolite, mordenite, zeolite Y, zeolite Beta), ion-exchangers (Amberlite CG-120, Amberlite IR-120, Rexyn 101, Dowex 50W X18) and chelating resins (Muromac, Chelex 100, Amberlite IRC-718) for REEs. The experimental results demonstrated that clinoptilolite, zeolite Y and Chelex 100 displayed fast kinetics for REEs sorption (higher than 96% in 1 min), and 0.1 mol L−1 HNO3 can desorb REEs from zeolite Y and Chelex 100 quantitatively. SPE could provide excellent sample cleanup ability, but it consumed large sample volume if high enrichment factors (EFs) were anticipated, resulting in a long analytical time.

Dispersive liquid–liquid microextraction (DLLME) has been proposed by Rezaee et al.18 in 2006, which possesses merits of simple operation, fast dynamics, high EFs and batch operation, and has been widely employed in trace analysis. However, DLLME seriously suffers from complex or “dirty” sample matrices. With 2,6-pyridinedicarboxylic acid (2,6-PDCA) as complex reagent, methanol as disperser solvent, trioctylmethylammonium chloride–chloroform as the extraction solvent, Chandrasekaran et al.12 developed a method of DLLME combined with ICP-MS for the determination of REEs in groundwater. This method provided relatively high EFs (about 100-fold), while was only suitable for groundwater analysis. Since SPE has excellent sample cleanup ability, DLLME has high EFs, and the desorption solvent of SPE matches the DLLME well, the coupling of SPE and DLLME will endow the dual extraction technique both excellent anti-interference ability and high EFs. Fattahi et al.19 developed a dual extraction method of SPE and DLLME for ultra preconcentration of chlorophenols for the first time. The elution solvent of SPE (acetone) was employed as the disperser solvent in the subsequent DLLME procedure for further preconcentration of target chlorophenols. After two-step extraction, the EFs for target chlorophenols were in the range of 4390–17[thin space (1/6-em)]870-fold. Han et al.20 developed a method of dispersive solid phase extraction (D-SPE)-DLLME combined with gas chromatography-mass spectrometry (GC-MS) for the determination of polybrominated diphenyl ethers in bottled beverage samples. Since matrix solid phase extraction (MSPD) has good sample cleanup ability for solid and semi-solid samples, Wang et al.21 proposed a method of MSPE-DLLME combined with GC-electron capture detector (ECD) for the determination of pyrethroids in soil samples. Guo et al.22 developed a dual extraction method of vortex assisted micro-solid phase extraction (VA-μ-SPE) and DLLME for the preconcentration and separation of phthalate esters from water samples. In order to further improve the selectivity of the dual extraction technique, Djozan et al.23 synthesized molecularly imprinted microspheres with methamphetamine as template, and a method of molecularly imprinted SPE combined with DLLME has been developed for the selective extraction and preconcentration of methamphetamine and ecstasy from urine samples. The above facts demonstrated that the dual extraction by combining SPE with DLLME was an efficient approach to improve overall extraction time and analyte preconcentration, and simultaneously, to enable extraction from the samples with more complex matrix.

ICP-MS has been proven to be the most efficient analytical technique for elements and speciation analysis due to its merits of high sensitivity, wide linear range and multi-element analysis ability. However, it has low tolerance toward the organic solvent, and high percentage of organic solvent in the sample may destabilize or extinguish the ICP discharge owing to the relative high solvent vapor pressure and the solvent loading of the plasma.24 Electrothermal vaporization (ETV), as an efficient sample introduction technique for ICP, has some merits of high transport efficiency, low sample consumption, low absolute detection limits and allowing direct introduction of organic solvent into ICP. In addition, the use of chemical modifiers, such as pivaloyltrifluoroacetone (PTA),25 1-phenyl-3-methyl-4-benzoyl-pyrazalone-5 (PMBP)26 and polytetrafluoroethene (PTFE),27 can improve the vaporization and atomization behavior of REEs, eliminate the matrix effect, and therefore improve the analytical performance of ETV-ICP-MS. Consequently, ETV-ICP-MS has become a sensitive methodology for the determination of REEs. In our previous works, the combination of LPME with ETV-ICP-OES/MS has been developed for the determination of trace elements and element speciation in various real-world samples.28–32

The aim of this work was to develop a method of dual extraction technique (dispersive solid phase extraction (D-SPE) and DLLME) combined with ETV-ICP-MS for the determination of REEs in environmental water and sediment samples. With commercial Chelex 100 as the adsorption material in D-SPE, the target REEs were first separated and preconcentrated by D-SPE. With PMBP as chelating reagent of target REEs and chemical modifier in ETV-ICP-MS, ethanol as disperser solvent, the eluent of D-SPE (0.1 mol L−1 HNO3) was buffered and then subjected to further preconcentration by DLLME. Various factors influencing the extraction of REEs by D-SPE and DLLME were studied in detail. The developed method was applied to the determination of REEs in environmental water and sediment samples for validation.

Experimental

Standard solutions and reagents

Stock solutions (1 mg mL−1) of Y, La, Ce, Pr, Nd, Sm, Eu, Gd, Tb, Dy, Ho, Er, Tm, Yb and Lu were prepared by dissolving a certain amount of their specpure oxides (Merck, Darmstadt, Germany) in dilute HCl. The solution of 40 mmol L−1 PMBP was prepared by dissolving 0.5566 g PMBP (AR, Sinopharm Chemical Reagent Co., Ltd, Shanghai, China) in 50 mL ethanol. And 125 mmol L−1 Tris was prepared by dissolving 0.7571 g Tris (Wuhan Life Technology Co., Ltd, Wuhan, China) in 50 mL high purity water. Working standard solutions were prepared by diluting the stock standard solutions with high purity water to the required concentrations. High purity water was obtained by a Milli-Q water purification system (18.25 MΩ cm, Millipore, Molsheim, France). Analytical grade reagents were used unless otherwise specified. HNO3 (Sinopharm Chemical Reagent Co., Ltd, Shanghai, China) was purified by a sub-boiling system before use. Plastic and glass containers and all other laboratory materials that would come into contact with samples or standards were stored in 20% (v/v) nitric acid over 24 h, and rinsed with high purity water prior to use.

Chelex 100 (200–400 mesh, Biotechnology Grade) was purchased from Bio-Rad Laboratories (Hercules, America). The resin (2.0 g) was washed three times with 0.5 mol L−1 HNO3. Excess HNO3 was removed by rinsing with high purity water. The resin was finally dispersed in high purity water to form Chelex 100-water dispersion (200 mg mL−1).

Instruments

A modified commercial WF-4C graphite furnace (Beijing Second Optics, Beijing, China) was available as an electrothermal vaporizer and connected to an Agilent 7500a ICP-MS (Agilent, Tokyo, Japan). Details on the modification of the graphite furnace and its connection with ICP-MS have been described previously.25,27 The ICP-MS operation conditions were optimized with conventional pneumatic nebulization method prior to connecting with ETV device. Pyrolytic graphite coated graphite tubes were used throughout this work. The operation conditions for ETV-ICP-MS and the temperature program for simultaneous determination of target REEs were summarized in Table 1. A KQ 5200DE model Ultrasonicator (Shumei Instrument Factory, Kunshan, China) was employed for sample mixing. A WX-4000 microwave-accelerated digestion system (Shanghai EU Microwave Chemistry Technology Co. Ltd, Shanghai, China) and SKML model temperature control heating panel (Beijing, China) were employed for sample digestion.
Table 1 Operation conditions of ICP-MS and temperature programs for ETV-ICP-MS
Operation conditions of ICP-MS
RF power 1250 W
Outer gas flow rate 15 L min−1
Carrier gas flow rate 0.7 L min−1 (for PN) and 0.4 L min−1 (for ETV)
Sampling depth 7.0 mm
Sampler/skimmer diameter orifice Nickel 1.0 mm/0.4 mm
Scanning mode Peak-hopping
Dwell time 10 ms
Integration mode Peak area
Monitored isotope 89Y, 139La, 140Ce, 141Pr, 146Nd, 147Sm, 153Eu, 158Gd, 159Tb, 163Dy, 165Ho, 166Er, 169Tm, 172Yb, 175Lu
 
Temperature programs of graphite furnace for ETV-ICP-MS
Drying step 200 °C, ramp 5 s, hold 15 s
Vaporization step 1700 °C, 4 s
Cooling step 100 °C, 5 s
Cleaning step 2600 °C, 3 s


Sample preparation

East Lake surface water (Wuhan, China) was collected and filtered through a 0.45 μm filter membrane immediately, then kept in refrigerator at 4 °C before use. The lake and river sediments were collected from East Lake and Yangze River (Wuhan, China), respectively. The collected sediments were dried in the air, ground, sieved (80 mesh) and stored in sample vials.

For sediment digestion, 50 mg GBW07301a (stream sediment), East Lake and Yangze River sediment were weighed and put into PTFE digestion vessel, respectively. After adding 5 mL HNO3, 3 mL HF and 1 mL H2O2, the vessel was capped and settled for 5 min. The vessel was then placed on a turntable and subjected to microwaves. The microwave system was operated as follows: 4 min at 15 atm and 160 °C, 4 min at 18 atm and 190 °C, 20 min at 22 atm and 210 °C. Mixed acids were employed as the blank and subjected to the same procedure as described above. After digestion, the vessel was heated to near dryness at 150 °C on an electric hot plate, diluted with high purity water and calibrated to 50 mL. The above digested solution was diluted by 500-fold and adjusted to pH 4.0 by diluted NaOH prior to D-SPE-DLLME extraction.

Dispersive solid phase extraction procedures

An aliquot of 25 mL sample solution (pH = 4.0) containing 15 target REEs was transferred to the extraction vial followed by the addition of 0.25 mL 200 mg mL−1 Chelex 100 dispersion. Then the vial was covered with cap and shaken for 20 min. After extraction, the vial was standing for 2 min to settle down the resin. The upper layer solution was removed by a disposable polyethylene pipette, and the Chelex 100 resin settled in the bottom of the vial was cleaned with high purity water and transferred to a 1.5 mL centrifuge tube. The target REEs retained on the resin was then desorbed with 1.0 mL 0.1 mol L−1 HNO3 by vortex for 2 min. Finally, 0.9 mL desorption solution was transferred to a 15 mL centrifuge tube.

Dispersive liquid–liquid microextraction procedures

1.0 mL 125 mmol L−1 Tris and 150 μL 40 mmol L−1 PMBP–ethanol was added to the desorption solution of D-SPE, and was calibrated to 4.0 mL. The whole solution was shaken for 1 min and sonicated for 10 min to mix the sample solution and promote the complex formation between PMBP and REEs prior to DLLME. Then, 300 μL ethanol (containing 15 μL CCl4) was rapidly injected into the aforementioned solution by using a 1.0 mL syringe, and a cloudy solution was formed immediately. Phase separation was achieved by centrifugation at 4000 rpm for 4 min. After centrifugation, a small droplet of CCl4 was sedimented in the bottom of conical test tube. Then, 10.0 μL sedimented phase was withdrawn into the microsyringe and then injected into the graphite furnace for ETV-ICP-MS analysis.

ETV-ICP-MS procedures

After the ETV unit was connected to the ICP-MS and the system was stabilized, 10.0 μL of analytes in the organic solvent was injected into the graphite furnace. During the drying step of the temperature program, the dosing hole of the graphite furnace was kept open to remove water and other vapors. Then it was sealed with a graphite probe 5–10 s prior to the high-temperature vaporization step, the vaporized analytes were transported into the plasma source by a carrier gas (argon) and the peak-hop transient mode for data acquisition was used to detect the ions selected.

Results and discussion

Optimization of D-SPE procedures

The selected adsorption material of Chelex 100 resin contained iminodiacetate group, which has strong affinity to transition metals, even in the presence of high salt. The adsorption mechanism was based on the chelation interaction between iminodiacetate group and REEs. Various parameters affecting the extraction of target REEs by D-SPE, including sample pH, adsorption time, eluent time/concentration/volume, were investigated in detail. The conventional pneumatic nebulization (PN)-ICP-MS was employed for the optimization of D-SPE parameters. The adsorption efficiency was defined as the ratio of adsorption amount of target REEs by the sorbent to its original amount. And the recovery was defined as the ratio of elution amount of target REEs to its original amount.
Effect of sample pH. The pH value plays an important role with respect to the adsorption of target REEs on Chelex 100, and the effect of sample pH (2.0–7.0) on the adsorption efficiency of target REEs by D-SPE was investigated. The experimental results demonstrate that the adsorption efficiency of target REEs was increased rapidly with increasing pH from 2.0 to 2.5, and a quantitative adsorption with adsorption percentages in the range of 92–100% was obtained with further increasing pH from 3.0 to 7.0. Considering that REEs may be precipitated at higher pH value, sample pH 4.0 was employed for further experiments.
Effect of adsorption time. In order to speed up the adsorption of target REEs onto the Chelex resin and ensure quantitative retention of target analytes in a minimized time, the mixed solution containing target REEs and Chelex 100 resin were shaken by a shaker, and the effect of adsorption time on the adsorption efficiency of target REEs was studied in the range of 2–120 min. The experimental results show that the adsorption efficiency of target REEs was increased rapidly with the increase of extraction time from 2 to 10 min, and quantitative adsorption efficiency was achieved after 20 min shaking. Therefore, the extraction time was selected as 20 min.
Effect of HNO3 concentration and volume. Due to the low adsorption efficiency of target REEs at low pH, diluted HNO3 solution was employed for fast and quantitative elution of analytes from the resin by vortex. The effect of HNO3 concentration on the recovery of target REEs was investigated with its concentration varying in the range of 0.05–0.5 mol L−1. The experimental results in Fig. 1 indicate that 0.1 mol L−1 HNO3 was sufficient to simultaneously and quantitatively recover target REEs from the chelating resin. With 0.1 mol L−1 HNO3 as the eluent, the effect of eluent volume in the range of 0.5–2.0 mL on the recovery of target REEs was studied. The results show that all target REEs could be quantitatively recovered when the eluent volume was higher than 0.5 mL, and the recovery kept almost constant when the eluent volume was higher than 1.0 mL. Therefore, 1.0 mL 0.1 mol L−1 HNO3 was employed as the eluent.
image file: c4ra01576b-f1.tif
Fig. 1 Effect of HNO3 concentration on the recovery of target REEs. CREEs = 1 μg L−1; sample pH, 4.0; extraction time, 20 min; desorption time, 2 min; volume of eluent, 1 mL; sample volume, 25 mL.
Effect of desorption time. The effect of desorption time on the recovery of target REEs by vortex was investigated with time changing from 0.5 to 5 min. The experimental results show that the target REEs could be quantitatively recovered in the whole investigated time range, indicating a fast desorption dynamics. And the recovery of target REEs was slightly increased with the increase of desorption time from 0.5 to 2 min, and then kept almost constant with further increase of desorption time. Hence, 2 min was selected as desorption time.

Optimization of DLLME procedures

The extraction of target REEs by DLLME was based on the hydrophobic interaction between target REEs and the extraction solvent. PMBP can form stable, hydrophobic complex with REEs, and the PMBP–REEs complex could be effectively extracted by hydrophobic organic solvent and easily vaporized into ICP via ETV under low vaporization temperature in subsequent ETV-ICP-MS determination.26,33 Thus, herein PMBP was employed as chelating reagent in the DLLME process and chemical modifier in subsequent ETV-ICP-MS measurement, respectively. Various parameters affecting the complex formation and extraction of target REEs was investigated in detail with model solutions (without D-SPE step).
Effect of sample pH. It is well known that sample pH plays an unique role on the metal–PMBP chelates formation and their subsequent extraction because the existing form of metal ions and PMBP are pH dependent. Therefore, the effect of sample pH ranging from 4.0 to 9.0 on the extraction efficiency of target REEs was investigated. From Fig. 2, it can be seen that the signal intensity of target REEs was increased rapidly when the pH was increased from 4.0 to 6.0, with the further increase of pH 6.0 to 7.0, the signal intensity was slowly increased; no obvious variation of the signal intensity was observed when the pH was varied in the range of 7.0–9.0. Therefore, sample pH of 8.0 was employed for further experiment.
image file: c4ra01576b-f2.tif
Fig. 2 Effect of sample pH on the extraction efficiency of target REEs by DLLME. CREEs = 1.0 μg L−1; extraction solvent, CCl4; disperser solvent, methanol; PMBP concentration, 1 mmol L−1; sample volume, 4 mL.
Effect of extraction solvent and volume. According to the extraction mechanism of DLLME, the type and volume of extraction solvent definitely affects the extraction efficiency. Basically, the extraction solvent in DLLME should satisfy the following requirements: it should be immiscible with water, has higher density than water, and has high extraction efficiency for PMBP–REEs. Several extraction solvent including carbon tetrachloride (CCl4), chloroform (CHCl3) and 1,2-dichloroethane (C2H4Cl2) were investigated as extraction solvent for the extraction of target REEs by DLLME. In order to obtain the same sediment volume (15 μL), 50 μL CHCl3 and C2H4Cl2, and 20 μL CCl4 was employed as the extraction solvent due to their different water solubility. The experimental results indicate that CCl4 showed better extraction efficiency and reproducibility than CHCl3 and C2H4Cl2. The reason for this is that CHCl3 and C2H4Cl2 have relatively larger water solubility than CCl4, resulting in a large portion of the extraction solvent of CHCl3 or C2H4Cl2 was lost during the extraction procedure, which decreased the extraction efficiency and worsened the reproducibility. Therefore, CCl4 was employed as the extraction solvent in further experiment.

With CCl4 as extraction solvent, the effect of extraction solvent volume in the range of 10–30 μL on the extraction efficiency of target REEs was investigated. (The sediment phase of DLLME with varied extraction solvent volume was completely injected into ETV-ICP-MS.) The experimental results illustrate that the signal intensity of target REEs kept almost constant when the extraction solvent volume varied from 10 to 25 μL, and was decreased when the volume was higher than 25 μL. In order to get both high enrichment factors and good reproducibility, the volume of CCl4 was fixed at 15 μL.

Effect of disperser solvent and volume. The disperser solvent in DLLME would assist the formation of stable emulsions in the sample solution containing extraction solvent, and help the extraction of target analytes. Therefore, the disperser solvent should be miscible with both extraction solvent and aqueous sample solution. Four kinds of disperser solvent, acetone, methanol, ethanol and acetonitrile were studied for the DLLME of target REEs. The experimental results in Fig. 3 indicate that ethanol and acetonitrile exhibited better extraction performance than methanol and acetone. Compared with acetonitrile, ethanol is cheaper and has lower toxicity, and the formed cloudy solution was stable. Therefore, ethanol was employed as disperser solvent in subsequent experiment.
image file: c4ra01576b-f3.tif
Fig. 3 Effect of disperser solvent on the extraction efficiency of REEs by DLLME. CREEs = 0.5 μg L−1; extraction solvent and volume, 15 μL methanol; disperser solvent volume, 0.4 mL; sample pH, 8.0; PMBP concentration, 1 mmol L−1; sample volume, 4 mL.

With ethanol as disperser solvent, the effect of disperser solvent volume on the extraction efficiency of target REEs was investigated. The experimental results demonstrate that with 0.3 mL ethanol as disperser solvent, relatively high extraction signal intensity and better reproducibility of all target REEs were obtained. Therefore, the volume of ethanol was fixed at 0.3 mL.

Effect of PMBP concentration. PMBP was employed as the chelating reagent for extraction of REEs by DLLME, and the concentration of PMBP would affect the formation of hydrophobic complex and thus the extraction efficiency of target REEs. Fig. 4 is the effect of PMBP concentration on the extraction efficiency of DLLME for target REEs. It can be seen that the target REEs could not be extracted in the absence of PMBP, and the signal intensity was increased rapidly with the increase of PMBP concentration from 0 to 0.8 mmol L−1, and kept almost constant with further increase of PMBP concentration to 2.0 mmol L−1. Hence, 1.5 mmol L−1 PMBP was employed in the following experiment.
image file: c4ra01576b-f4.tif
Fig. 4 Effect of PMBP concentration on the extraction efficiency of REEs by DLLME. CREEs = 0.5 μg L−1; extraction solvent and volume, 15 μL methanol; disperser solvent and volume, 0.3 mL ethanol; sample pH, 8.0; sample volume, 4 mL.
Effect of coexisting ions. To investigate the interference of the common coexisting ions on the target REEs, two sample solutions were prepared. One sample solution contained only target REEs, each of 0.1 μg L−1, and the other one contained target REEs (each of 0.1 μg L−1) and a certain amount of coexisting ions (i.e. 2000 mg L−1 K+ (KCl), 2000 mg L−1 Na+ (NaCl), 1000 mg L−1 Ca2+ (Ca(NO3)2), 500 mg L−1 Mg2+ (MgSO4), 1 mg L−1 Al3+ (Al(NO3)3), 1 mg L−1 Ba2+ (BaCl2)). The spiked amount of the coexisting ions was referred to the concentration level of coexisting ions in real-world water and sediment samples.34–37 These two samples were subjected to the same D-SPE-DLLME-ETV-ICP-MS procedure, and the intensity obtained for each target REE in both samples was compared. As can be seen in Fig. 5, the signal intensity of target REEs obtained in the presence of coexisting ions was comparable with that obtained in the absence of coexisting ions, indicating that the proposed method had good anti-interference ability and was suitable to the analysis of target REEs in environmental and sediment samples.
image file: c4ra01576b-f5.tif
Fig. 5 Effect of interfering ions 2000 mg L−1 K+ (KCl), 2000 mg L−1 Na+ (NaCl), 1000 mg L−1 Ca2+ (Ca(NO3)2), 500 mg L−1 Mg2+ (MgSO4), 1 mg L−1 Al3+ (Al(NO3)3), 1 mg L−1 Ba2+ (BaCl2) on the signal of 0.1 μg L−1 REEs (n = 3).

Optimization of ETV temperature program

PMBP has been demonstrated to be an excellent chemical modifier for ETV-ICP spectrometry determination of REEs.26,33 With PMBP used as chemical modifier, the heating program including drying temperature and vaporization temperature was optimized for vaporization of target REEs. Fixing the drying temperature as 200 °C and drying time as 10 s, the effect of vaporization temperature on the signal intensity of target REEs in the range of 600–2400 °C was investigated. The experimental results indicate that the signal intensity of target REEs was increased with the increase of vaporization temperature from 600 to 1500 °C, and kept almost constant with further increase of vaporization temperature from 1700 to 2400 °C. Hence, a temperature of 1700 °C was selected as the vaporization temperature for the simultaneous determination of target REEs by ETV-ICP-MS. By fixing the vaporization temperature at 1700 °C and vaporization time at 4 s, the effect of drying temperature on the signal intensity of target REEs was also studied in the range of 100–500 °C. The results demonstrate that the signal intensity of all target REEs kept constant when the drying temperature was varied from 100 to 300 °C, and was decreased rapidly when the temperature was higher than 400 °C, probably due to the decomposition of PMBP–REEs complex. Therefore, drying temperature was fixed at 200 °C in subsequent experiment.

Under the optimized heating program, the signal profiles of target REEs were obtained by ETV-ICP-MS, and Fig. 6 shows the representative signal profiles of Y, Gd, Tb and Lu with/without PMBP as chemical modifier. These results imply that PMBP could react with target REEs to form REEs–PMBP chelates which can be easily vaporized and transported from the furnace to the plasma under a low vaporization temperature of 1700 °C, which were coincided with those results obtained in our previous research work.26


image file: c4ra01576b-f6.tif
Fig. 6 The signal profile of Y, Gd, Tb, Lu in ETV-ICP-MS with and without PMBP as chemical modifier. 1.0 ng REEs with 0.2 μmol PMBP; drying, 200 °C, ramp, 5 s, hold 15 s; vaporization temperature, 1700 °C, vaporization time, 4 s. Y, Gd, Tb, Lu, the signal profile with PMBP; Y′, Gd′, Tb′, Lu′, the signal profile without PMBP; V, the signal of analyte at vaporization temperature; C, the residual signal of the analyte at cleaning temperature 2700 °C.

Analytical performance

The analytical performance of the proposed method was evaluated under the optimum conditions, and the results are listed in Table 2. The limits of detection (LODs, evaluated as the concentration corresponding to three times the standard deviation of 11 runs of the blank solution) towards standard aqueous solution were calculated to be 0.003–0.073 ng L−1 with the relative standard deviations (RSDs) ranging from 6.7 to 11.5% (CY,La,Ce,Pr,Nd,Gd,Dy = 1.0 ng L−1; CSm,Eu,Tb,Ho,Er,Tm,Yb,Lu = 0.2 ng L−1, n = 7). The linear range of the proposed method covered 3 or 4 orders of magnitude with the correlation coefficient in the range of 0.9931–0.9988. The enrichment factors (EFs, defined as the slope ratio of the calibration curve obtained by ETV-ICP-MS with and without D-SPE-DLLME pretreatment) for target REEs were varied from 234 to 566-fold. The proposed method exhibited higher EFs for Tb, Dy, Ho, Er, Tm, Yb and Lu than La, Ce, Pr, Nd, Sm and Eu probably because the extraction constant of the former REEs with PMBP was higher than the other REEs (lg[thin space (1/6-em)]Kex,La = −7.19; lg[thin space (1/6-em)]Kex,Ce = −6.56; lg[thin space (1/6-em)]Kex,Nd = −5.67; lg[thin space (1/6-em)]Kex,Sm = −5.00; lg[thin space (1/6-em)]Kex,Eu = −5.33; lg[thin space (1/6-em)]Kex,Gd = −4.77; lg[thin space (1/6-em)]Kex,Dy = −4.42; lg[thin space (1/6-em)]Kex,Er = 1.36; lg[thin space (1/6-em)]Kex,Yb = −3.89; lg[thin space (1/6-em)]Kex,Y = −4.40).40 A comparison of analytical performance achieved by D-SPE-DLLME-ETV-ICP-MS with that achieved by several other approaches is summarized in Table 3. Compared with the SPE based method,8,38,39 the developed D-SPE-DLLME-ETV-ICP-MS exhibited higher EFs and lower LODs. Compared with the DLLME based method proposed by Chandrasekaran et al.,12 the developed D-SPE-DLLME possesses higher EFs and good anti-interference ability. It should be noted that the improvement of the analytical performance of the developed method are attributed to the high EFs of dual dispersive extraction technique and the improved sensitivity of ETV-ICP-MS.
Table 2 Analytical performance data obtained by D-SPE-DLLME-ETV-ICP-MS (n = 3)
REEs Linear equation R2 Linear range/ng L−1 LOD/ng L−1 RSDa% n = 7 EFs
a CY,La,Ce,Pr,Nd,Gd,Dy = 1.0 ng L−1; CSm,Eu,Tb,Ho,Er,Tm,Yb,Lu = 0.2 ng L−1.
Y y = 5[thin space (1/6-em)]023[thin space (1/6-em)]830x + 3111 0.9977 0.1–200 0.031 7.8 387
La y = 24[thin space (1/6-em)]070[thin space (1/6-em)]070x − 6963 0.9951 0.2–200 0.040 9.0 234
Ce y = 4[thin space (1/6-em)]523[thin space (1/6-em)]010x − 1646 0.9983 0.2–200 0.048 11.3 321
Pr y = 6[thin space (1/6-em)]695[thin space (1/6-em)]020x − 1928 0.9988 0.2–200 0.038 11.3 347
Nd y = 1[thin space (1/6-em)]385[thin space (1/6-em)]740x + 3462 0.9966 0.5–200 0.073 11.5 341
Sm y = 1[thin space (1/6-em)]358[thin space (1/6-em)]920x − 1981 0.9955 0.02–200 0.006 8.6 344
Eu y = 4[thin space (1/6-em)]484[thin space (1/6-em)]300x − 6557 0.9973 0.02–200 0.004 8.3 352
Gd y = 1[thin space (1/6-em)]706[thin space (1/6-em)]520x − 3996 0.9946 0.2–200 0.026 6.7 390
Tb y = 16[thin space (1/6-em)]049[thin space (1/6-em)]400x − 90 0.9931 0.01–200 0.003 10.0 475
Dy y = 5[thin space (1/6-em)]890[thin space (1/6-em)]230x − 4518 0.9982 0.05–200 0.014 7.9 546
Ho y = 24[thin space (1/6-em)]140[thin space (1/6-em)]400x − 3651 0.9969 0.01–200 0.003 7.5 537
Er y = 7[thin space (1/6-em)]336[thin space (1/6-em)]190x + 302 0.9972 0.01–200 0.003 8.5 472
Tm y = 32[thin space (1/6-em)]742[thin space (1/6-em)]000x − 5273 0.9969 0.02–200 0.004 9.0 557
Yb y = 6[thin space (1/6-em)]022[thin space (1/6-em)]560x − 668.5 0.9976 0.05–200 0.008 9.9 462
Lu y = 32[thin space (1/6-em)]938[thin space (1/6-em)]700x − 5586 0.9970 0.01–200 0.003 9.9 566


Table 3 Comparison of analytical performance obtained by this method with that found in the literatures for determination of target REEsa
Methods LODs (ng L−1) and EFs Ref.
Y La Ce Pr Nd Sm Eu Gd Tb Dy Ho Er Tm Yb Lu
a Note: the number in bracket represents enrichment factor for target REE by different methods; CY,La,Ce,Pr,Nd,Gd,Dy = 1.0 ng L−1; CSm,Eu,Tb,Ho,Er,Tm,Yb,Lu = 0.2 ng L−1.
DLLME-ICP-MS 0.55 (99.7) 0.34 (99.5) 0.16 (95.6) 0.52 (93.8) 0.25 (94.2) 0.21 (96.9) 0.19 (95.8) 0.05 (96.1) 0.20 (94.9) 0.08 (96.6) 0.18 (96.1) 0.16 (99.0) 0.24 (99.8) 0.16 (101.8) 12
Online SPE-ICP-MS 0.14 (5) 0.15 (5) 0.022 (5) 0.041 (5) 0.021 (5) 0.019 (5) 0.020 (5) 0.015 (5) 0.018 (5) 0.015 (5) 0.019 (5) 0.013 (5) 0.014 (5) 0.016 (5) 38
SPE-ICP-MS 0.038 (33.3) 0.135 (33.3) 0.159 (33.3) 0.034 (33.3) 0.095 (33.3) 0.028 (33.3) 0.026 (33.3) 0.018 (33.3) 0.028 (33.3) 0.032 (33.3) 0.018 (33.3) 0.027 (33.3) 0.021 (33.3) 0.024 (33.3) 0.016 (33.3) 8
MSPE-ICP-MS 0.15 (50) 0.16 (50) 0.21 (50) 0.69 (50) 1.49 (50) 0.18 (50) 0.07 (50) 0.54 (50) 0.04 (50) 0.21 (50) 0.05 (50) 0.07 (50) 0.04 (50) 0.20 (50) 0.04 (50) 39
D-SPE-DLLME-ETV-ICP-MS 0.031 (387) 0.040 (234) 0.048 (321) 0.038 (347) 0.073 (341) 0.006 (344) 0.004 (352) 0.026 (390) 0.003 (475) 0.014 (546) 0.003 (537) 0.003 (472) 0.004 (557) 0.008 (462) 0.003 (566) This work


Real sample analysis

The developed method was applied for the determination of target REEs in environmental water and sediment samples, and external calibration methodology (the calibration standards were subjected to the same preconcentration procedure as samples) was employed for the quantification. To validate the accuracy of the proposed method, the Certified Reference Material of GBW07301a stream sediment was analyzed and the analytical results are listed in Table 4. As can be seen, the determined values obtained by D-SPE-DLLME-ETV-ICP-MS were in good agreement with the certified values for all target REEs. The developed method was further applied for the determination of target REEs in water and sediment samples, and the analytical results together with the recoveries are listed in Tables 5 and 6. As can be seen, all target REEs were found in water and sediment samples, and the recovery of target REEs ranged from 78 to 115% for the spiked water samples and from 75 to 117% for the spiked sediment samples, respectively.
Table 4 Analytical results for REEs in Certified Reference Material of GBW07301a sediment
Elements GBW07301a (μg g−1)
Found Certified
Y 20 ± 1 22 ± 2
La 39 ± 2 41 ± 2
Ce 88 ± 5 81 ± 6
Pr 10 ± 1 9.3 ± 0.7
Nd 38 ± 4 36 ± 3
Sm 6.6 ± 0.4 6.7 ± 0.4
Eu 1.7 ± 0.1 1.7 ± 0.2
Gd 6.1 ± 0.7 5.6 ± 0.5
Tb 0.74 ± 0.06 0.81 ± 0.06
Dy 4.1 ± 0.2 4.3 ± 0.2
Ho 0.73 ± 0.05 0.79 ± 0.07
Er 2.4 ± 0.1 2.3 ± 0.3
Tm 0.37 ± 0.005 0.34 ± 0.03
Yb 2.2 ± 0.04 2.3 ± 0.2
Lu 0.40 ± 0.03 0.38 ± 0.04


Table 5 The analytical results of REEs in East Lake water and Yangze River water samples
Analytes Added (ng L−1) Lake water Yangze River
Found Recovery Found Recovery
Y 0 15.2 ± 0.7 46.8 ± 0.5
5 19.8 ± 0.5 91% 52.3 ± 6.6 110%
20 33.8 ± 1.4 93% 65.2 ± 1.3 92%
La 0 71.9 ± 2.6 188 ± 3
5 75.9 ± 1.5 80% 192 ± 19 87%
20 90.2 ± 2.9 91% 207 ± 8 92%
Ce 0 21.6 ± 1.1 63.3 ± 1.6
5 26.7 ± 0.8 101% 68.1 ± 13 96%
20 42.4 ± 1.4 104% 79.1 ± 4.1 79%
Pr 0 4.35 ± 0.35 12.0 ± 0.5
5 9.21 ± 0.29 97% 16.6 ± 1.9 91%
20 23.0 ± 0.4 93% 28.7 ± 1.1 83%
Nd 0 12.9 ± 1.4 51.0 ± 2.7
5 17.7 ± 1.1 96% 55.8 ± 6.9 96%
20 31.7 ± 1.9 94% 68.8 ± 2.8 89%
Sm 0 1.81 ± 0.12 7.77 ± 0.30
5 7.30 ± 0.14 110% 12.8 ± 0.7 100%
20 20.8 ± 0.6 95% 24.8 ± 1.4 85%
Eu 0 2.01 ± 0.14 5.30 ± 0.11
5 7.14 ± 0.05 103% 10.0 ± 0.3 95%
20 20.6 ± 1.1 93% 22.5 ± 0.8 86%
Gd 0 14.8 ± 0.3 38.1 ± 1.3
5 18.7 ± 0.4 78% 43.3 ± 3.4 105%
20 32.1 ± 0.9 87% 55.6 ± 1.4 88%
Tb 0 0.33 ± 0.14 1.24 ± 0.02
5 5.70 ± 0.05 107% 6.59 ± 0.15 107%
20 18.3 ± 0.7 90% 19.3 ± 0.7 90%
Dy 0 3.02 ± 0.06 11.3 ± 0.2
5 8.15 ± 0.14 103% 15.9 ± 0.1 92%
20 20.0 ± 0.9 85% 27.5 ± 0.3 81%
Ho 0 0.42 ± 0.06 1.55 ± 0.05
5 5.31 ± 0.16 98% 6.91 ± 0.09 107%
20 18.1 ± 0.4 88% 19.9 ± 0.7 92%
Er 0 0.61 ± 0.09 2.10 ± 0.04
5 5.43 ± 0.08 96% 7.37 ± 0.26 105%
20 18.4 ± 0.5 89% 20.6 ± 0.5 92%
Tm 0 0.17 ± 0.06 0.63 ± 0.02
5 5.30 ± 0.05 103% 6.36 ± 0.08 115%
20 17.8 ± 0.3 88% 19.7 ± 0.9 95%
Yb 0 1.85 ± 0.12 5.73 ± 0.18
5 6.74 ± 0.10 98% 10.1 ± 0.4 87%
20 18.4 ± 0.3 83% 23.4 ± 1.1 88%
Lu 0 0.64 ± 0.06 0.97 ± 0.19
5 5.19 ± 0.04 91% 6.29 ± 0.10 106%
20 19.5 ± 0.6 94% 19.8 ± 1.1 94%


Table 6 The analytical results of REEs in Lake sediment and River sediment samples
Elements Added (μg g−1) Lake sediment River sediment
Found Recovery Found Recovery
Y 0.00 10.6 ± 1.1 5.46 ± 0.20
2.50 12.5 ± 1.6 76% 7.48 ± 0.32 81%
10.00 20.5 ± 1.0 99% 15.3 ± 0.4 98%
La 0.00 32.2 ± 2.2 14.0 ± 0.3
2.50 34.1 ± 3.1 76% 16.0 ± 0.8 77%
10.00 42.9 ± 1.8 107% 23.5 ± 1.9 95%
Ce 0.00 46.6 ± 2.8 52.3 ± 1.4
2.50 49.4 ± 4.0 113% 54.4 ± 2.0 83%
10.00 57.0 ± 2.3 104% 60.9 ± 5.2 85%
Pr 0 7.9 ± 1.4 4.17 ± 0.65
2.5 10.5 ± 0.2 105% 6.91 ± 1.00 109%
10 18.4 ± 0.8 105% 14.5 ± 0.7 103%
Nd 0 26.0 ± 2.2 23.0 ± 2.4
2.5 28.9 ± 0.4 117% 28.3 ± 1.3 100.9%
10 35.6 ± 1.8 95% 33.3 ± 0.7 103%
Sm 0.00 3.97 ± 0.25 2.77 ± 0.13
2.50 6.27 ± 0.65 92% 4.86 ± 0.10 84%
10.00 14.4 ± 0.6 100% 12.2 ± 1.1 94%
Eu 0.00 0.67 ± 0.05 0.35 ± 0.03
2.50 3.40 ± 0.35 109% 3.00 ± 0.03 106%
10.00 12.1 ± 0.5 115% 11.6 ± 0.8 112%
Gd 0.00 2.92 ± 0.42 0.83 ± 0.07
2.50 4.97 ± 0.69 78% 2.71 ± 0.08 75%
10.00 12.8 ± 0.6 99% 10.8 ± 1.0 100%
Tb 0.00 0.40 ± 0.02 0.23 ± 0.01
2.50 2.73 ± 0.30 93% 2.62 ± 0.08 96%
10.00 10.6 ± 0.4 102% 10.2 ± 0.5 100%
Dy 0.00 2.21 ± 0.33 1.59 ± 0.26
2.50 4.77 ± 0.30 103% 3.77 ± 0.10 87%
10.00 12.4 ± 0.4 102% 10.9 ± 0.8 94%
Ho 0.00 0.40 ± 0.04 0.21 ± 0.01
2.50 2.73 ± 0.21 93% 2.66 ± 0.04 98%
10.00 10.5 ± 0.4 101% 10.2 ± 0.6 100%
Er 0.00 1.36 ± 0.05 0.77 ± 0.06
2.50 3.51 ± 0.32 86% 3.14 ± 0.15 95%
10.00 11.1 ± 0.7 97% 10.2 ± 0.5 95%
Tm 0.00 0.23 ± 0.01 0.14 ± 0.01
2.50 2.59 ± 0.27 94% 2.58 ± 0.04 98%
10.00 10.7 ± 0.7 104% 10.3 ± 0.3 102%
Yb 0.00 1.08 ± 0.08 0.59 ± 0.01
2.50 3.30 ± 0.34 89% 2.80 ± 0.04 88%
10.00 10.9 ± 0.7 99% 10.1 ± 0.3 95%
Lu 0.00 0.17 ± 0.02 0.079 ± 0.004
2.50 2.65 ± 0.29 99% 2.61 ± 0.02 101%
10.00 10.3 ± 0.4 101% 9.98 ± 0.38 99%


Conclusions

A novel method of dual extraction technique (D-SPE-DLLME) coupling with ETV-ICP-MS has been developed for the determination of trace REEs in environmental water and sediment samples. In the first extraction step of D-SPE, the target REEs were adsorbed on the adsorption material of Chelex 100 resin and then desorbed by diluted HNO3, realizing the preliminary preconcentration and separation of target REEs from the complicated sample matrix. And the target REEs was further preconcentrated by DLLME with PMBP as the chelating reagent.

The proposed method presented high EFs and was applicable for the determination of target REEs in complicated sediment samples.

Acknowledgements

The authors would like to thank the National Science Foundation of China (no. 21175102) and Science Fund for Creative Research Groups of NSFC (no. 20621502, 20921062) for their financial supports. This work is also supported by “the Fundamental Research Funds for the Central Universities (114009)” and SRFDP (20110141110010).

Notes and references

  1. X. Pang, D. C. Li and A. Peng, Environ. Sci. Pollut. Res., 2002, 9, 143–148 CrossRef CAS.
  2. D. E. Reichert and M. J. Welch, Coord. Chem. Rev., 2001, 212, 111–131 CrossRef CAS.
  3. C. Y. Chen, P. Zhang and Z. F. Chai, Anal. Chim. Acta, 2001, 439, 19–27 CrossRef CAS.
  4. C. Koeberl and P. M. Bayer, J. Alloys Compd., 1992, 180, 63–70 CrossRef CAS.
  5. S. A. Kumar, S. P. Pandey, N. S. Shenoy and S. D. Kumar, Desalination, 2011, 281, 49–54 CrossRef CAS PubMed.
  6. Q. Fu, L. M. Yang and Q. Q. Wang, Talanta, 2007, 72, 1248–1254 CrossRef CAS PubMed.
  7. P. Liang, Y. Liu and L. Guo, Spectrochim. Acta, Part B, 2005, 60, 125–129 CrossRef PubMed.
  8. J. Cho, K. W. Chung, M. S. Choi and H. J. Kim, Talanta, 2012, 99, 369–374 CrossRef CAS PubMed.
  9. C. Karadaş, D. Kara and A. Fisher, Anal. Chim. Acta, 2011, 689, 184–189 CrossRef PubMed.
  10. L. Zhang, B. B. Chen, M. He and B. Hu, J. Sep. Sci., 2013, 36, 2158–2167 CrossRef CAS PubMed.
  11. Y. J. Li and B. Hu, J. Hazard. Mater., 2010, 174, 534–540 CrossRef CAS PubMed.
  12. K. Chandrasekaran, D. Karunasagar and J. Arunachalam, J. Anal. At. Spectrom., 2012, 27, 1024–1031 RSC.
  13. M. H. Mallah, F. Shemirani and M. G. Maragheh, Environ. Sci. Technol., 2009, 43, 1947–1951 CrossRef CAS.
  14. X. J. Liu and Z. F. Fan, Chromatographia, 2009, 70, 481–487 CAS.
  15. I. Kim, S. Kim and G. Kim, Aquat. Geochem., 2010, 16, 611–620 CrossRef CAS.
  16. K. Takeda and Y. Arikawa, Bunseki Kagaku, 2005, 54, 939–943 CrossRef CAS.
  17. T. Pasinli, A. E. Eroglu and T. Shahwan, Anal. Chim. Acta, 2005, 547, 42–49 CrossRef CAS PubMed.
  18. Y. Assadi, M. Rezaee, M. R. M. Hosseinia, E. Aghaee, F. Ahmadi and S. Berijani, J. Chromatogr. A, 2006, 1116, 1–9 CrossRef PubMed.
  19. N. Fattahi, S. Samadi, Y. Assadi and M. R. M. Hosseini, J. Chromatogr. A, 2007, 1169, 63–69 CrossRef CAS PubMed.
  20. Y. Han, X. Y. Jia, X. L. Liu, T. C. Duan and H. T. Chen, J. Sep. Sci., 2011, 34, 1047–1054 CrossRef CAS PubMed.
  21. H. Wang, H. Y. Yan and J. D. Qiao, J. Sep. Sci., 2012, 35, 292–298 CrossRef CAS PubMed.
  22. L. Guo and H. K. Lee, J. Chromatogr. A, 2013, 1300, 24–30 CrossRef CAS PubMed.
  23. D. Djozan, M. A. Farajzadeh, S. M. Sorouraddin and T. Baheri, J. Chromatogr. A, 2012, 1248, 24–31 CrossRef CAS PubMed.
  24. Z. F. Xu, C. Q. Liu, H. X. Zhang, Y. J. Ma and S. L. Lin, Anal. Sci., 2003, 19, 1625–1629 CrossRef CAS.
  25. S. W. Wu, M. He, B. Hu and Z. C. Jiang, Microchim. Acta, 2007, 159, 269–275 CrossRef CAS.
  26. J. Yin, B. Hu, M. He and Z. C. Jiang, Anal. Chim. Acta, 2007, 594, 61–68 CrossRef CAS PubMed.
  27. Y. F. Zhang, Z. C. Jiang, M. He and B. Hu, Environ. Pollut., 2007, 148, 459–467 CrossRef CAS PubMed.
  28. L. B. Xia, B. Hu, Z. C. Jiang, Y. L. Wu and Y. Liang, Anal. Chem., 2004, 76, 2910–2915 CrossRef CAS PubMed.
  29. L. B. Xia, B. Hu, Z. C. Jiang, Y. L. Wu, R. Chen and L. Li, J. Anal. At. Spectrom., 2006, 21, 362–365 RSC.
  30. L. B. Xia, Y. L. Wu and B. Hu, J. Mass Spectrom., 2007, 42, 803–810 CrossRef CAS PubMed.
  31. L. B. Xia, X. Li, Y. L. Wu, B. Hu and R. Chen, Spectrochim. Acta, Part B, 2008, 63, 1290–1296 CrossRef PubMed.
  32. L. Li and B. Hu, Talanta, 2007, 72, 472–479 CrossRef CAS PubMed.
  33. T. Y. Peng and Z. C. Jiang, J. Anal. At. Spectrom., 1998, 13, 75–78 RSC.
  34. X. Q. Cao, J. W. Wan, W. Chen and C. Wang, Saf. Environ. Eng., 2009, 02, 27–32 Search PubMed.
  35. S. G. Dai, Environmental chemistry, Higher eduction press, Beijing, 2006, pp. 164–166 Search PubMed.
  36. Q. Liu, Environmental Chemistry, Chemical Industry Press, Beijing, 2004, pp. 27–28 Search PubMed.
  37. F. S. Wei, G. Z. Yang, D. Z. Jiang, Z. H. Liu and B. Z. Sun, Chin. J. Environ. Monit., 1991, 1, 1–6 Search PubMed.
  38. Y. B. Zhu, A. Itoh, T. Umemura, H. Haraguchi, K. Inagaki and K. Chiba, J. Anal. At. Spectrom., 2010, 25, 1253–1258 RSC.
  39. S. W. Su, B. B. Chen, M. He, B. Hu and Z. W. Xiao, Talanta, 2014, 119, 458–466 CrossRef CAS PubMed.
  40. T. H. Zhou, E. K. Wang and W. Z. Lu, Handbook of Analytical Chemistry, Chemical Industry Press, Beijing, 1997, pp. 93–96 Search PubMed.

This journal is © The Royal Society of Chemistry 2014