 Open Access Article
Influence of the relative humidity on the morphology of inkjet printed spots of IgG on a non-porous substrate
Liyakat Hamid Mujawar†ab,
J. G. M. Kuertencd,
D. P. Siregarc,
Aart van Amerongen*a and
Willem Nordebe
aFood and Biobased Research, Biomolecular Sensing and Diagnostics, Wageningen University and Research Centre, Bornse Weilanden 9, 6708 AA Wageningen, The Netherlands. E-mail: Aart.vanamerongen@wur.nl; Fax: +31 317 483 011; Tel: +31 317 480 164
bLaboratory of Physical Chemistry and Colloid Science, Wageningen University, Dreijenplein 6, 6703 HB Wageningen, The Netherlands. E-mail: Liyakat.mujawar@gmail.com; Willem.Norde@wur.nl
cDepartment of Mechanical Engineering, Eindhoven University of Technology, P. O. Box 513, 5600 MB Eindhoven, The Netherlands. E-mail: J.G.M.Kuerten@tue.nl
dFaculty EEMCS, University of Twente, P.O. Box 217, 7500 AE Enschede, The Netherlands. E-mail: daniel.siregar@gmail.com
eUniversity Medical Center Groningen, University of Groningen, A. Deusinglaan 1, 9713 AV Groningen, The Netherlands
First published on 29th April 2014
Abstract
During the drying of inkjet printed droplets, the solute particles (IgG-Alexa-635 molecules) in the drop may distribute unevenly on the substrate, resulting in a “coffee-stain” spot morphology. In our study, we investigated the influence of the relative humidity on the distribution of inkjet printed fluorophore labeled IgG molecules on a polystyrene substrate. A theoretical model for an evaporating droplet was developed in order to predict the changes in the spot diameter, height and volume of a drying droplet. An experiment was performed where a sessile droplet was monitored using a CCD camera installed on a goniometer and good agreement was found between the experimental results and simulation data. We also compared the predicted morphology for an inkjet-printed microarray spot with the experimental results where IgG molecules were printed for various relative humidities. The spot morphology of the dried spots was analyzed by a confocal laser microscopy. At a lower relative humidity (i.e., <60%), a spot morphology resembling a coffee stain was prominent, whereas a more homogeneous distribution was observed when droplets were printed and dried at a higher relative humidity (∼70%).
1. Introduction
Inkjet printing is one of the most versatile techniques used for depositing a range of polymers and colloid materials onto various substrates.1–6 In the past, researchers have demonstrated the application of inkjet printing to produce microarrays7–9 of various biomolecules on non-porous substrates, such as glass10–13 and plastic.14,15 Such non-porous substrates are preferred over porous substrates16 since they are cost-durable and easily available. However, the printing of biomolecules (for e.g., producing biochips) on non-porous substrates is a challenge because the distribution of the biomolecules is influenced by parameters such as temperature, relative humidity17–19 (RH) and solvent15,20 (pH and composition). The most commonly observed non-homogeneous distribution of inkjet printed spots, often termed the ‘coffee-stain’ effect, was studied in detail by Deegan et al.21–23 Deegan mentioned three conditions for the coffee-stain shape: pinning of the contact line, a higher evaporation rate at the edge of the droplet and a volatile solvent. Since surface tension tends to keep the drop in the shape of a spherical cap during the evaporation of the solvent, a pinned contact line and a higher evaporation rate at the edge of the droplet result in a flow of the solution toward the edge of the drop, thereby causing the coffee-stain effect. Sommer and Rozlosnik24 argued that the coffee-stain effect can also take place for an unpinned contact line. An extension to this model was proposed by Fischer,25 where the shape of the droplet is not assumed to be spherical during the evaporation process. Van Dam and Kuerten26 proposed an extension for the calculation of the curvature of the droplet shape in order to incorporate a less flat micro-scale droplet than was assumed in the previous model.While printing, controlled evaporation of the droplet17 (by maintaining a constant relative humidity) is of crucial importance. In our research, we have demonstrated the influence of various relative humidities (40 ± 1%/50 ± 1%/60 ± 1%/70 ± 1% and 80 ± 1%) on the distribution of inkjet printed biomolecules. Using a non-contact microarrayer, fluorophore-labeled antibody molecules (IgG-Alexa-635) were printed and dried under similar conditions and the spot morphology of the biomolecules in the dried spots was analyzed by confocal laser scanning microscopy. From the observed profiles of the spots, we could determine the distribution pattern of the IgG molecules printed and dried at various relative humidities.
Furthermore, we present a mathematical model for the fluid dynamics and the distribution of the solute molecules. The model is based on considering three major aspects: the flow of the liquid due to evaporation, convection and diffusion of the solute, and binding of the solute molecules to the substrate.
2. Materials and methods
2.1 Mathematical model
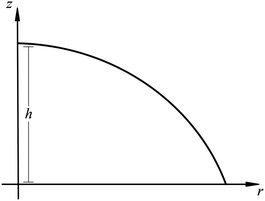
The mathematical model covers the dynamics of the solvent due to evaporation, the change in concentration of the solute and the binding of the solute molecules to the surface. Fig. 1 depicts an axially symmetric droplet on a smooth horizontal substrate, where h denotes the height of the droplet, and z and r are the vertical and radial coordinates.A complete model for the flow inside the droplet is provided by the three-dimensional Navier–Stokes equation and the continuity equation for an incompressible fluid. However, a study of the order of the magnitude of the terms in these equations reveals that the model can be simplified by the lubrication approximation.25–28 The most important assumption in this simplified model is that the Reynolds number is so small that the convective terms in the Navier–Stokes equation are negligible. This assumption leads to a simplified form of the Navier–Stokes equation in case the height of the droplet is small compared to its radius. In this approach, the radial velocity component of the solvent, u, can explicitly be determined from the shape of the droplet and the pressure difference between the inside and the outside of the droplet at the liquid–air interface:28
 | (1) |
 | (2) |
The pressure within the droplet is determined by the surface tension and the local curvature of the droplet–air interface, according to the Laplace pressure30
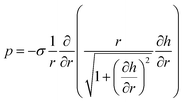 | (3) |
The term in the denominator accounts for the exact radius of the curvature of an axially symmetric drop. It allows us to extend the range of the validity of the lubrication approximation to the case with a larger ratio between the height and radius. In case the contact line of the droplet is not pinned to the substrate, the dynamics of the contact line are incorporated in the model by adding the disjoining pressure to (3).30 The disjoining pressure, which accounts for the molecular interaction near the contact line, is only unequal to zero in a small region near the contact line and keeps the contact angle constant.
We will also apply the lubrication approximation to cases where the height and radius of the droplet are almost equal. For the calculation of the shape history of the droplet during evaporation, the lubrication approximation has no influence, since the surface tension keeps it in a spherical cap shape. During the first part of the evaporation, when the contact angle is still large, the velocity profile in the droplet is not exactly given by the solution of the lubrication approximation, but it turns out that the deviations are small and have a very small effect on the solute concentration.
During the evaporation process, the change in the solute concentration is determined by three physical phenomena: the loss of solvent by evaporation, convection and diffusion of the solute in the solvent, and the adsorption of solute molecules to the substrate. The loss of solvent not only increases the solute concentration but also leads to transport of the solute by diffusion. Adsorption leads to a local decrease of the solute concentration in the region near the liquid–substrate interface. Hence, the concentration distribution of the solute is governed by a two dimensional convection–diffusion equation30
 | (4) |
The adsorption of the solute determines the surface coverage and influences the function of the biomolecule. Here, we make use of a model by Kurrat et al.31 where adsorption may happen in a reversible and an irreversible way. This model describes the dependency of the mass adsorption rate on the concentration of the solute particles near the liquid–substrate interface, Cs. We indicate the reversibly and irreversibly adsorbed mass per unit area by Mr and Mi, respectively. The rates of adsorption for the reversible and irreversible processes are given by32
 | (5) |
 | (6) |
 | (7) |
2.2 Experimental
While printing under various relative humidities, other printing conditions, such as temperature, voltage (88 V) and pulse (49 μs), were kept constant. Prior to printing, the hood of the printer was allowed to be conditioned for 15 minutes at the set humidity value. After printing, the substrate was incubated and dried under the same conditions for one hour and stored in a sealed aluminium pouch. After overnight drying, the printed spots were analyzed by CLSM to study the spot morphology and the distribution of the IgG molecules in the spot.
3. Instrumentation
3.1 Goniometer
The influence of the relative humidity on the drying of the droplet was analyzed by monitoring the change in contact angle (θ), diameter (D), volume (V) and height (h) of a liquid droplet using a contact angle measuring system (G10, Krüss GmbH, Hamburg, Germany). A 2 μL MQ water droplet was placed on the surface of a polystyrene slide and analyzed by an in-built CCD video camera (Sony XC-77CE). All the parameters were measured with the drop analysis software (DSA-1).The change in contact angle (θ) and volume (V) for a droplet of IgG-Alexa (200 μg mL−1) was monitored at two different relative humidity levels, ∼19% and ∼75% respectively. The measurements at 19% relative humidity were performed in a room where the default humidity was 19 ± 1%. For the measurements at 75 ± 1% relative humidity, the HTA™ PS slide was placed inside a transparent home-made chamber which was pre-saturated with water. Prior to placing the droplet on the HTA™ polystyrene surface, the relative humidity inside the chamber was monitored for one hour using a portable thermohygrometer (Testo AG, Lenzkirch, Germany). The relative humidity was found to be 75 ± 1%. This transparent chamber was positioned on the stage of the goniometer and using a micropipette, a droplet was placed on the HTA™ polystyrene surface. Two independent sets of experiments were performed to confirm the results.
3.2 Confocal laser scanning microscopy (CLSM) imaging
The distribution of the fluorophore-labeled IgG molecules printed at various humidities on the HTA™ PS slide was analyzed by confocal laser scanning microscopy (Carl Zeiss Axiovert 200 microscope, Zeiss, Jena, Germany), equipped with a LSM 5 Exciter. The spots were scanned at 10x magnification and the configuration of the objective was LD Plan-Neofluar 10x/0.30 Korr M27. The CLSM was set at 633 nm with a He–Ne laser, the size of the pinhole was 206 nm and the transmission was 11%. The dimensions of the scanner were X: 1272.79 μm, Y: 1272.79 μm, respectively. The mean intensity of the spots was analyzed by “Zen 2008” software, and the homogeneity of the spots was investigated using ImageJ software. A cross-section profile plot for each of the nine spots was calculated and the final plot data were made after averaging these values along with the standard deviation. The total intensity for each spot was also calculated as the product of the mean intensity and the surface area of the spots.3.3. Atomic force microscopy (AFM)
The surface characteristics of the HTA-PS slide were analyzed by atomic force microscopy (Asylum MFP-3D, Santa Barbara, CA, USA) using the tapping-mode (in air). An area of 90 μm × 90 μm was scanned (256 lines) at a frequency of 0.4 Hz. The RMS roughness of the bare HTA-PS slide was calculated as 9.2 nm, which implies a smooth surface relative to the drop dimensions.4. Results and discussion
4.1 Evaporation model
The validation of the evaporation model is presented in this subsection. Numerical results are compared with experimental results from an experiment in which a droplet of MQ water was evaporated at a relative humidity of ∼19%. The experiment has been performed twice, yielding almost equal results.Fig. 2 shows the comparison between the numerical and experimental results during the evaporation. The experimental results clearly indicate that the contact line is not pinned: after a short initial time, the diameter monotonically decreased during the evaporation and as a result, the contact angle remains constant with time. Therefore, we included the disjoining pressure in the model with a constant contact angle of 90°. Fig. 2B shows the droplet volume as a function of time. During the whole evaporation process, the experimental results agree very well with the model results and show the typical behavior for an unpinned contact line, in which the rate of mass loss is proportional to the radius of the droplet.30 In Fig. 2A, it can be seen that the experimentally measured diameter is almost constant during the first stages of the evaporation process, after which it starts decreasing at the same rate as in the model. This indicates that the contact line was pinned during the first stages and then started retracting. This finding is consistent with the results observed by Bourgès-Monnier and Shanahan,33 who performed measurements on the evaporation of sessile droplets of water and n-decane on various substrates. They found a decreasing contact angle during the first stages of evaporation until a certain contact angle was reached. After that, the contact angle remained constant and the diameter of the droplet started decreasing. This effect was attributed to the receding contact angle. Initially, the contact angle is larger than the receding contact angle and the contact line remains pinned until the receding contact angle has been reached. Indeed, our results also show a slightly decreasing contact angle during the initial 3 minutes of the drying, after which a constant contact angle is found.
The results for the droplet height, displayed in Fig. 2C, are consistent with this explanation: initially the measured decrease in height is larger than predicted by the model, but after 2–3 minutes they decrease at the same rate. The systematic difference between the droplet height and radius in the experiment indicates that the contact angle is slightly lower than 90 degrees or that the shape is not exactly a spherical cap, which could be an effect of gravity. The results are consistent with standard models in the literature34,35 for a constant contact angle, as V2/3 is a linear function of time.
4.2 Experimental analysis of drying a liquid droplet at two different humidities (∼19% and ∼75%)
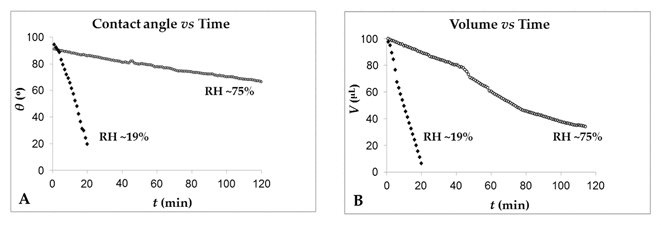
As shown in Section 4.1, after an initial period in which the contact angle decreased to the value of the receding contact angle,33 an unpinned situation was observed for a pure liquid droplet drying on a substrate. We also studied the influence of two different relative humidities, i.e. ∼19% and ∼75%, on the drying of a droplet of IgG-Alexa-635 (200 μg mL−1) by monitoring the change in the contact angle (θt) and volume (V).It was found that irrespective of the relative humidity used, the initial contact angle (θ0) for a sessile droplet on a PS surface was ∼93°. The change in contact angle (θ) during the drying process was faster at a lower RH: in 20 seconds, θ decreased to 46° at RH ∼19%, whereas at RH ∼75%, it decreased to 86° (Fig. 3A). These observations are in agreement with the studies performed earlier by Lages et al., who used modified gold surfaces and observed the change in the contact angle (θ) for aqueous solutions under controlled conditions.36 Irrespective of the relative humidity used for drying, the contact angle changed with time (see Fig. 3A), thus implying that, in contrast to a droplet of MQ water, the contact line of a liquid droplet containing IgG molecules was pinned.
The influence of the relative humidity on the drop volume history was also significant. At RH ∼19%, evaporation of the initial volume (2 μL) to 0.6 μL occurred in less than 20 minutes, whereas at RH ∼ 75%, it took 120 minutes (Fig. 3B). This difference is much larger than expected based on the dependence of the evaporation rate on the relative humidity. Our observations are in line with those presented by Liu18 et al. who, at a lower humidity (47%), observed a significant decrease in the sessile drop volume of pure water compared to the same experiment at a higher humidity (80%).
The data presented in Section 4.1 (i.e., for pure MQ water) depicts the unpinned contact line situation whereas in the presence of IgG molecules, the contact line is pinned. This contrasting behaviour in the presence and absence of protein molecules has already been explained by Choi et al.37 According to these authors, in an evaporating droplet the protein molecules tend to adsorb on the substrate surface, thus reducing its surface hydrophobicity. With increasing protein concentration, pinning of the contact line is promoted, which, in turn, influences the contact angle of the liquid droplet.
4.3 Influence of the relative humidity on mass distribution
In this subsection, the influence of the relative humidity on the deposited solute mass is described. The relative humidity determines the magnitude of the evaporation term compared to the convective term in the evolution equation for the droplet height, eqn (1). In this study, we chose relative humidity values ranging between 0.3 and 0.9 and considered a droplet with a pinned contact line, an initial volume of 250 pL and a diameter of 100 μm. The consideration of a pinned contact line model can be well understood with the results explained in Section 4.2. We choose higher rate constants for adsorption than Kurrat et al.,31 in order to take into account the effect of the hydrophobicity32 of the substrate in our case.According to the value for the area of a single molecule adopted by Kurrat et al.,31 the maximum possible adsorbed mass density equals 3.7 mg m−2, whereas the initial concentration leads to an average deposited mass density of 6.4 mg m−2. This implies that not all the molecules present in the solution can be adsorbed. After the liquid has completely evaporated there will still be molecules lying on the substrate, but unbound. These unbound molecules will be removed in a rinsing step after drying, whereas the adsorbed molecules will remain on the substrate.
Fig. 4A shows the profiles of the total deposited mass density, including both the adsorbed and the unbound molecules, and Fig. 4B shows the profiles of the adsorbed mass density. Without diffusion and adsorption, the deposition profile is independent of the relative humidity. The time scale increases with increasing relative humidity, leading to larger evaporation times, but the resulting deposition profile after complete drying is constant. It shows a large deposition peak at the edge of the droplet, since all the solute molecules are transported to the edge during evaporation. Adding diffusion obviously broadens this peak. Since diffusion does not depend on the relative humidity, but the convection velocity is lower at a higher relative humidity, the effect of diffusion is larger at a higher relative humidity. However, also with diffusion, the coffee-stain-shaped deposit layer is still observed for all the values of relative humidity considered.
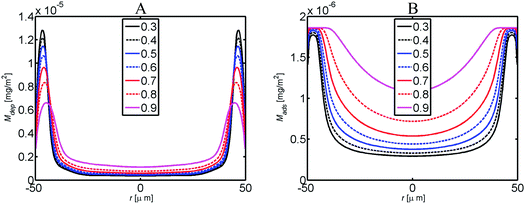 | ||
| Fig. 4 Total deposited mass density (A) and adsorbed mass density (B) as functions of the radial coordinate for the various values of relative humidity simulated with the model. | ||
If the effect of adsorption is also added, the slower convection at a higher relative humidity gives the molecules more time to adsorb on the substrate before they reach the edge of the droplet. Therefore, the resulting adsorption profile (Fig. 4B) is more uniform. Note that at the highest relative humidity, the maximum possible adsorbed mass density is almost reached even in the center of the droplet. At a low relative humidity, both the total deposited mass density and the adsorbed mass density show the coffee-stain shape.
4.4 Experimental analysis of the influence of relative humidity on the fluorescence of inkjet printed IgG molecules
Spots of fluorophore-labeled IgG molecules printed and dried on a non-porous surface showed variations in the spot morphology and fluorescence intensity depending on the ambient relative humidity. The average mean intensity and total intensity of the inkjet printed spots had a maximum when the biomolecules were printed and dried at a relative humidity of 60% (see Fig. 5).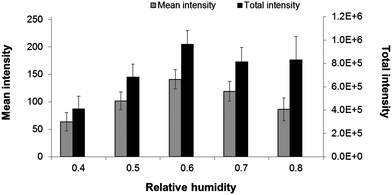 | ||
| Fig. 5 Based on measured CLSM data, average mean intensity (shaded) and average total intensity (solid) of the IgG-Alexa-635 spots printed on a surface at various relative humidities. | ||
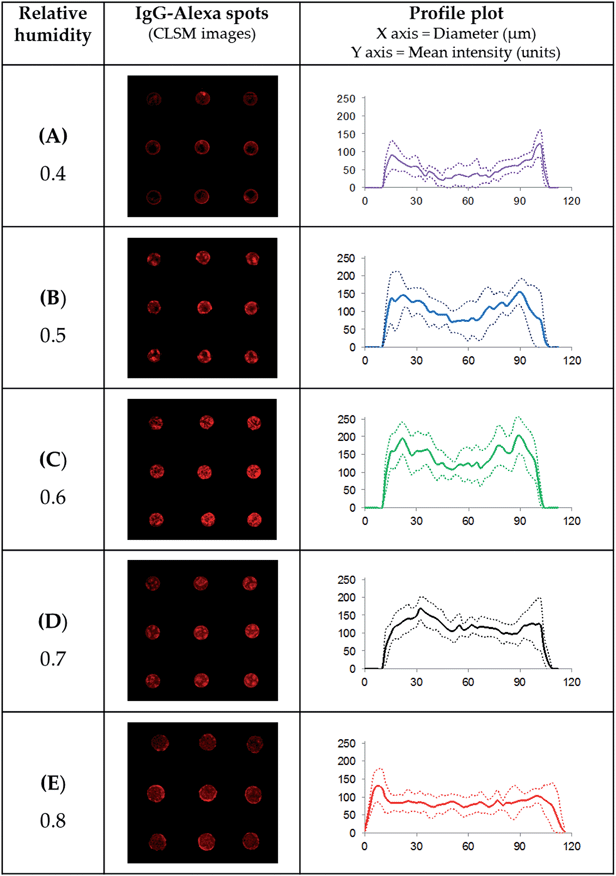
At low humidity (∼0.4), the morphology pattern of the spots of IgG-Alexa-635 showed a non-homogeneous distribution, which resembles a coffee-stain-shape (see Fig. 6A). The intensity profile plot clearly shows higher fluorescence at the edge of the spot compared to the overall spot area, thus confirming an inhomogeneous distribution. The higher fluorescence intensity observed at the edge of the spot is due to a higher locally deposited mass of biomolecules, as observed in the results of the model of the total mass distribution (see Fig. 4A). This uneven distribution results from the pinning of the contact line of the evaporating droplet,21 which in turn causes internal convection within the droplet, creating an outward flow of the IgG molecules towards the edge of the spot.22
When printing was performed at high relative humidities (>40%), the overall uniformity of the spots increased with increasing humidity, which is consistent with the simulation results shown in the previous section. As shown in the profile diagram, the fluorescence intensity was higher at the edge of the spot when the drop was dried at 40 ± 1% and 50 ± 1% relative humidity, with a very low fluorescence intensity in the central part of the spot (see Fig. 6A and B). Upon raising the relative humidity to 60 ± 1%, (RH ∼ 0.6), the drying time further increased and the coffee-stain-effect reduced compared to the drying of similar droplets at lower relative humidities (see Fig. 6C). A better and more homogeneous distribution was observed when the IgG molecules were printed at 70 ± 1% (RH ∼ 0.7), where the profile plot was much more uniform (see Fig. 6D). This situation may be explained by the fact that at a higher relative humidity, the droplet has a longer drying time and hence shows less internal convection. This allows the IgG molecules present within the sessile droplet to be adsorbed on the substrate rather than being transported to the edges. Moreover, at a higher relative humidity, the effect of diffusion, which counteracts high local solute concentrations, becomes more prominent compared to the effect of convection. However, although the spot morphology at RH ∼0.7 was more uniform than at RH ∼0.6, both the mean and total fluorescence intensities were higher at RH ∼0.6. This may indicate that the conditions for the binding of the IgG molecule at the surface may be more favorable at RH ∼0.6 compared to ∼0.7. A further increase in the humidity (up to RH ∼0.8) resulted in increased spreading of the droplet, which was clearly demonstrated by the larger spot diameter (117 μm) compared to the 96 μm observed for IgG-Alexa spots printed and dried at 40 ± 1% humidity (see Fig. 6E). Also at RH ∼0.8, the spot morphology was more uniform than the spot morphology at RH ∼0.4, although the total intensity was less than at RH ∼0.6 (see Fig. 6, right panel). The spots in Fig. 6 at 80% humidity are more homogeneously distributed compared to those printed at RH 40 ± 1% or 50 ± 1%, and the higher fluorescence observed at the edges may be due to the formation of multi-layers during the process of evaporation. Fig. 4A shows that this excess adsorption is more likely to occur at the edges, since the number of deposited molecules is much higher there than in the central part due to convection.
A comparison of the CLSM profile plot with the total mass distribution profile also shows slightly higher mass deposition, even though the droplet was dried at RH ∼0.8 (compared with Fig. 4A).
The results of the numerical simulations for the case of a pinned contact line also showed similar behavior to that observed in the experiments (see Fig. 3A), i.e., when a sessile drop was allowed to evaporate at a lower relative humidity, the contact line was pinned and the resulting mass distribution was non-homogeneous, which was confirmed by experimental results as well.
Based on the plot profile diagram in Fig. 6, it can be concluded that the overall spot morphology was irregular when the IgG-Alexa-635 molecules were printed and dried at lower humidities (<60°), whereas the fluorescence intensity was distributed more evenly when higher relative humidities (>60°) were applied. The mechanism behind the non-homogeneous distribution of the molecules at lower humidity has already been demonstrated for colloidal polystyrene particles by Chhasatia17 et al. Using a CCD camera they showed that at lower humidity, the outward migration of the colloidal particles was higher, giving rise to a coffee-stain-shaped spot, whereas with increasing relative humidity, the distribution of the colloidal particles was more uniform. Similar studies on the relation between a pinned contact line and ring formation at lower humidity have been reported by Deegan et al.23
In our study, we focused on establishing optimal humidity conditions for obtaining a more homogeneous distribution of printed IgG molecules on the substrate HTA-PS slide. The experimental results were in line with theoretical simulations. To overcome the coffee-stain effect, Eral et al. demonstrated the process of electrowetting.38 They showed that the applied electrostatic forces prevented the three phase contact line and generated an internal flow field, thereby preventing the accumulation of solutes along the contact line. Additionally, researchers have shown that the incorporation of additives to the printing buffer can also improve the non-homogeneous distribution in an inkjet printed spot.39–43 The influence of a polymeric additive to improve the functionality, i.e. the antigen binding capacity, of printed antibody molecules is the subject of our next paper.
5. Conclusions
Through numerical simulations and experiments, we have demonstrated the influence of the relative humidity on the mass distribution of inkjet-printed fluorophore labeled IgG molecules on non-porous substrates. It was found that at low humidity, the printed molecules are non-homogeneously distributed, thus resulting in coffee-stain-shaped spots. With increasing relative humidity, the coffee-stain-like appearance decreased and a more homogeneously distributed spot morphology was achieved. The best morphological results were obtained at a relative humidity of 70%, but with respect to mean and total fluorescence intensities, we conclude that the optimum relative humidity for printing the IgG molecules onto non-porous substrates is between 60 and 70% relative humidity. The results compare favorably with the results of a numerical model in which it is assumed that the contact line of the droplet is pinned during the evaporation process.Acknowledgements
This research was supported by the Dutch Technology Foundation STW, Applied-Science Division of NWO (Dutch Organisation for Scientific Research), and the Technology Program of the Ministry of Economic Affairs of The Netherlands.References
- J. N. Talbert, F. He, K. Seto, S. R. Nugen and J. M. Goddard, Enzyme Microb. Technol., 2014, 55, 21–25 CrossRef CAS PubMed.
- N. Komuro, S. Takaki, K. Suzuki and D. Citterio, Anal. Bioanal. Chem., 2013, 405, 5785–5805 CrossRef CAS PubMed.
- T. Soga, Y. Jimbo, K. Suzuki and D. Citterio, Anal. Chem., 2013, 85, 8973–8978 CrossRef CAS PubMed.
- W. Shen, M. Li, C. Ye, L. Jiang and Y. Song, Lab Chip, 2012, 12, 3089–3095 RSC.
- X. Li, J. Tian, G. Garnier and W. Shen, Colloids Surf., B, 2010, 76, 564–570 CrossRef CAS PubMed.
- H. H. Lee, K. S. Chou and K. C. Huang, Nanotechnology, 2005, 16, 2436–2441 CrossRef CAS PubMed.
- P. Arenkov, A. Kukhtin, A. Gemmell, S. Voloshchuk, V. Chupeeva and A. Mirzabekov, Anal. Biochem., 2000, 278, 123–131 CrossRef CAS PubMed.
- S. Choudhuri, J. Biochem. Mol. Toxicol., 2004, 18, 171–179 CrossRef CAS PubMed.
- I. Barbulovic-Nad, M. Lucente, Y. Sun, M. Zhang, A. R. Wheeler and M. Bussmann, Crit. Rev. Biotechnol., 2006, 26, 237–259 CrossRef CAS PubMed.
- L. H. Mujawar, W. Norde and A. van Amerongen, Analyst, 2013, 138, 518–524 RSC.
- R. L. DeRosa, J. A. Cardinale and A. Cooper, Thin Solid Films, 2007, 515, 4024–4031 CrossRef CAS PubMed.
- M. Dufva, Biomol. Eng., 2005, 22, 173–184 CrossRef CAS PubMed.
- W. Kusnezow and J. D. Hoheisel, J. Mol. Recognit., 2003, 16, 165–176 CrossRef CAS PubMed.
- Y. Liu, C. M. Li, W. Hu and Z. Lu, Talanta, 2009, 77, 1165–1171 CrossRef CAS PubMed.
- L. H. Mujawar, A. van Amerongen and W. Norde, Talanta, 2012, 98, 1–6 CrossRef CAS PubMed.
- L. H. Mujawar, A. Moers, W. Norde and A. Van Amerongen, Anal. Bioanal. Chem., 2013, 405, 7469–7476 CrossRef CAS PubMed.
- V. H. Chhasatia, A. S. Joshi and Y. Sun, Appl. Phys. Lett., 2010, 97, 231909 CrossRef PubMed.
- C. Liu, E. Bonaccurso and H.-J. Butt, Phys. Chem. Chem. Phys., 2008, 10, 7150–7157 RSC.
- M. J. Mackel, S. Sanchez and J. A. Kornfield, Langmuir, 2007, 23, 3–7 CrossRef CAS PubMed.
- W. Kusnezow, A. Jacob, A. Walijew, F. Diehl and J. D. Hoheisel, Proteomics, WILEY-VCH Verlag GmbH & Co. KGaA, Weinheim, Germany, 2003, pp. 254–264 Search PubMed.
- R. D. Deegan, O. Bakajin, T. F. Dupont, G. Huber, S. R. Nagel and T. A. Witten, Nature, 1997, 389, 827–829 CrossRef CAS PubMed.
- R. D. Deegan, O. Bakajin, T. F. Dupont, G. Huber, S. R. Nagel and T. A. Witten, Phys. Rev. E: Stat. Phys., Plasmas, Fluids, Relat. Interdiscip. Top., 2000, 62, 756–765 CrossRef CAS.
- R. D. Deegan, Phys. Rev. E: Stat. Phys., Plasmas, Fluids, Relat. Interdiscip. Top., 2000, 61, 475–485 CrossRef CAS.
- A. P. Sommer and N. Rozlosnik, Cryst. Growth Des., 2005, 5, 551–557 CAS.
- B. J. Fischer, Langmuir, 2002, 18, 60–67 CrossRef CAS.
- D. B. van Dam and J. G. M. Kuerten, Langmuir, 2008, 24, 582–589 CrossRef CAS PubMed.
- S. Howison, Practical Applied Mathematics: Modelling, Analysis, Approximation, Cambridge University Press, UK, 2005, p. 1, ISBN 13 978-0-521-84274-3 Search PubMed.
- J. G. M. Kuerten and D. P. Siregar, Drying of inkjet-printed droplets, in Inkjet-based micromanufacturing, ed. J. G. Korvink, P. J. Smith and D.-Y. Shin, Wiley-VCH, 2012 Search PubMed.
- Y. O. Popov, Phys. Rev. E: Stat., Nonlinear, Soft Matter Phys., 2005, 71, 036313 CrossRef.
- D. P. Siregar, J. G. Kuerten and C. W. van der Geld, J. Colloid Interface Sci., 2013, 392, 388–395 CrossRef CAS PubMed.
- R. Kurrat, J. J. Ramsden and J. E. Prenosil, J. Chem. Soc., Faraday Trans., 1994, 90, 587–590 RSC.
- P. Van Dulm and W. Norde, J. Colloid Interface Sci., 1983, 91, 248–255 CrossRef CAS.
- C. Bourges-Monnier and M. E. R. Shanahan, Langmuir, 1995, 11, 2820–2829 CrossRef CAS.
- D. S. Golovko, H. J. Butt and E. Bonaccurso, Langmuir, 2009, 25, 75–78 CrossRef CAS PubMed.
- G. Guena, C. Poulard and A. M. Cazabat, Colloid J., 2007, 69, 1–8 CrossRef CAS.
- C. Lages and E. Mèndez, Anal. Bioanal. Chem., 2007, 388, 1689–1692 CrossRef CAS PubMed.
- C.-H. Choi and C.-J. C. Kim, Langmuir, 2009, 25, 7561–7567 CrossRef CAS PubMed.
- H. B. Eral, D. M. Augustine, M. H. G. Duits and F. Mugele, Soft Matter, 2011, 7, 4954–4958 RSC.
- Y. Deng, X. Y. Zhu, T. Kienlen and A. Guo, J. Am. Chem. Soc., 2006, 128, 2768–2769 CrossRef CAS PubMed.
- F. Diehl, S. Grahlmann, M. Beier and J. D. Hoheisel, Nucleic Acids Res., 2001, 29, E38 CrossRef CAS PubMed.
- M. K. McQuain, K. Seale, J. Peek, S. Levy and F. R. Haselton, Anal. Biochem., 2003, 320, 281–291 CrossRef CAS.
- K. Pappaert, H. Ottevaere, H. Thienpont, P. Van Hummelen and G. Desmet, BioTechniques, 2006, 41, 609–616 CrossRef CAS PubMed.
- P. Wu and D. W. Grainger, J. Proteome Res., 2006, 5, 2956–2965 CrossRef CAS PubMed.
Footnote |
| † Present address: Center of Excellence in Environmental Studies, King Abdulaziz University, P.O. Box 80216, Jeddah 21589, Saudi Arabia. |
| This journal is © The Royal Society of Chemistry 2014 |

