Effect of carbon type on the performance of a direct or hybrid carbon solid oxide fuel cell

N. Kaklidisa, V. Kyriakoubc, I. Garagounisbc, A. Arenillasd, J. A. Menéndezd, G. E. Marnellos*ab and M. Konsolakis*e
aDepartment of Mechanical Engineering, University of Western Macedonia, GR-50100 Kozani, Greece. E-mail: gmarnellos@uowm.gr
bChemical Process & Energy Resources Institute, Centre for Research & Technology Hellas, GR-57001 Thermi, Thessaloniki, Greece
cDepartment of Chemical Engineering, Aristotle University of Thessaloniki, University Box 1517, Thessaloniki 54124, Greece
dInstituto Nacional del Carbon, Apartado 73, 33080 Oviedo, Spain
eSchool of Production Engineering and Management, Technical University of Crete, GR-73100 Chania, Crete, Greece. E-mail: mkonsol@science.tuc.gr; Tel: +30 28210 37682 Web: www.tuc.gr/konsolakis.html

Received 5th February 2014 , Accepted 7th April 2014

First published on 8th April 2014


Abstract

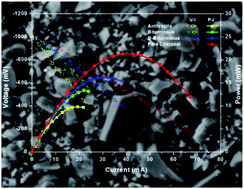
The impact of carbon type on the performance of the direct carbon fuel cell (DCFC) or hybrid carbon fuel cell (HCFC) is investigated by utilizing bare carbon or carbon/carbonate mixtures as feedstock, respectively. In this regard, four different types of carbons, i.e. bituminous coal (BC), demineralised bituminous coal (DBC), anthracite coal (AC) and pine charcoal (PCC), are employed as fuels in a SOFC of the type: carbon (carbonate)|Cu–CeO2/YSZ/Ag|Air. The results reveal that in the absence of carbonates (DCFC configuration) the optimum performance, in terms of maximum power density (Pmax), is obtained for the charcoal sample, which demonstrated a power output of ∼12 mW cm−2 at 800 °C, compared to 3.4 and 4.6 mW cm−2 with the anthracite and bituminous samples, respectively. Demineralization treatment of bituminous coal is found to improve the DCFC performance resulting in a maximum power density of 5.5 mW cm−2. A similar trend in terms of maximum power density, i.e., PCC > DBC > BC > AC, is obtained in the hybrid carbon fuel cell (HCFC) employing a eutectic mixture of lithium and potassium carbonates (62 mol% Li2CO3 + 38 mol% K2CO3) in the anode compartment at a carbon/carbonate weight ratio of 4[thin space (1/6-em)]:[thin space (1/6-em)]1. An enhancement of up to 185% in the maximum power density is achieved by admixing molten carbonates with carbon feedstock, with its extent being dependent on carbon type and temperature. The obtained results are interpreted on the basis of carbon physicochemical characteristics and their impact on DCFC performance. It is found that the observed trend in volatile matter, porosity and structure disorder is perfectly correlated with the achieved power output. In contrast, high ash and sulfur contents notably inhibit the electrochemical performance. The superior performance demonstrated by pine charcoal in conjunction with its availability and renewable nature, reveals the potential of biomass as feedstock in both DCFCs and HCFCs.


Introduction

Direct Carbon Fuel cells (DCFCs) have recently attracted growing attention, as one of the most promising energy conversion technologies. In fact, DCFCs represent the only electrochemical system which can effectively exploit the chemical energy of solid carbonaceous materials. In sharp contrast to conventional coal-fired plants, in DCFCs the chemical energy of carbonaceous feedstock can be directly converted to electricity with a low CO2 footprint per unit of produced energy.1,2 Moreover, DCFCs have several advantages, compared to conventional power plants and gas-fed SOFCs, itemized as follows: (i) their theoretical efficiency reaches to nearly 100%, due to the very low entropy change of carbon oxidation (ΔS° = 2.9 J K−1 mol−1),1,3–5 (ii) unlike gaseous (hydrogen, methane, etc.) and liquid fuels (alcohols, etc.), solid carbonaceous fuels are cheap and abundant, including coal, coke, biomass, the organic fraction of municipal solid wastes (MSW), etc.,3,6 (iii) DCFCs have lower emissions compared to coal-fired plants, involving mainly CO2, which can be captured and sequestrated; furthermore they result to almost zero NOx emissions due to no direct contact between fuel and air,7 (iv) the volumetric energy density of carbon (20 kW h L−1) is notably higher compared to that of gaseous or liquid fuels, such as methane (4.2 kW h L−1), hydrogen (2.4 kW h L−1) and diesel (9.8 kW h L−1).8

DCFCs can be categorized into three types according to the electrolyte employed: molten carbonates, molten hydroxides and solid oxides.1,2 Among them, the latter, i.e. the carbon-fed solid oxide fuel cells, offer the well-established advantages of oxygen anion conducting SOFCs. However, the limited interaction between solid fuel and solid electrolyte–electrode interphase is the main restriction toward carbon direct electro-oxidation and hence high DCFC performance.

Recently, a hybrid DCFC concept has been proposed as an alternative approach to overcome the above limitations. It merges the SOFC and molten carbonate fuel cell technologies, by employing a solid electrolyte to separate the anode and cathode compartments while at the same time a molten carbonate electrolyte is utilized in the anode compartment.9–11 Relevant studies on this particular type of fuel cell demonstrate that the cell performance can be substantially improved by the presence of a eutectic mixture of carbonates. The latter is due to the increased fluidity of carbon inside the anodic chamber and its transfer to the active electrochemical zone (AEZ) where the electro-oxidation reactions are taking place.9–12 Nevertheless, the use of molten salts results in high degradation rates due to the corrosive nature of carbonates. In this regard, coal gasification is an appealing option as it allows to solid fuel to fully access the anode and eliminates the use of molten media, reducing however the thermodynamic efficiency.1,2 Other major issues that need to be addressed in order to improve the DCFC performance and to take this technology to commercialization stage are: utilization of readily available and low cost carbon sources instead of carbon black, development of state-of-the-art cell materials with adequate mechanical, physicochemical and electrical properties, development of an efficient continuous fuel delivery system and up-scaling of the technology.1,2

The reaction scheme that is responsible for power generation in DCFCs is quite complex, compared to gas fueled SOFCs, involving both direct and indirect carbon oxidation reactions.1,2,13 Particularly, at the cathode the electrochemical reduction of oxygen is taking place resulting to the formation of oxygen ions, which then are transported across the electrolyte membrane into the anode AEZ:

 
O2 + 4e → 2O2− (1)

The primary anode reaction involves the electrochemical oxidation of carbon particles in contact with the solid electrolyte–electrode interface (AEZ) via the following reaction:

 
C + 2O2− → CO2 + 4e (2)

An alternative process of power generation involves a two-step (indirect) carbon electro-oxidation at the anodic side, first to CO and then to CO2:

 
C + O2− → CO + 2e (3)
 
CO + O2− → CO2 + 2e (4)

Reactions (2) and (3) are notably hindered by the limited solid–solid interactions; however carbon transfer to anode can be significantly increased by the high carbon fluidity provided by the molten carbonates, when they are co-fed with carbon in the anode chamber. Furthermore in the presence of carbonates, the following reactions can be simultaneously carried out in the anode, resulting in carbon consumption:

 
C + 2CO32− → 3CO2 + 4e (5)
 
C + CO32− → CO + CO2 + 2e (6)
 
2C + CO32− → 3CO + 2e (7)

The CO2 formed at the active electrochemical zone or directly employed as gasifying agent in anode compartment can further chemically react with solid carbon toward CO formation:

 
C + CO2 → 2CO (8)

Reaction (8) is known as the reverse Boudouard reaction and it is strongly favoured at temperatures higher than ∼700 °C. Although the reverse Boudouard reaction is a non-electrochemical reaction, it has a key role in the DCFC performance; its gaseous product, CO, can easily diffuse at the AEZ much more rapidly than the solid carbon, contributing to power generation via the reaction (4).

The above described mechanism, proposed by Gür and Huggins,14 can account for the performance of several DCFCs employing a solid oxide cell configuration.15 Thus, the overall carbon fuel cell efficiency can be ascribed mainly to gas-AEZ interactions, rather than to the extremely limited carbon-AEZ contact.15

To date various carbons have been tested as fuels in DCFCs in order to reveal their efficacy as energy carriers. It has been found that their physical and chemical properties notably affect the electrochemical reactivity of carbon and the lifetime of the DCFCs.16–19 For instance, Vutetakis et al.18 observed a deterioration of DCFC performance by various mineral impurities, whereas Cherepy et al.16 reported a degradation of cell performance by the sulfur contained in petroleum coke. However, as recently reviewed2 the fuel of choice in DCFC applications is carbon black. Thus, the employment of other types of readily available and cheaper carbons sources, such as biomass, would be highly desirable. In this regard, charcoals derived from biomass, organic wastes or petroleum residues have many advantages as DCFC feedstock, since they are inexpensive, easy to store, available worldwide and highly conductive20–23 so they constitute a promising renewable carbon source.

Based on the above aspects the present study aims at assessing the impact of carbon type on DCFC performance. In this regard, three different types of carbons, i.e. bituminous coal, anthracite coal and pine charcoal, were employed as fuels in a carbon-fed SOFC. To reveal the impact of inorganic compounds on the DCFC characteristics the bituminous coal is further subjected to a demineralization process. The obtained results are interpreted by considering the different physicochemical properties of the various types of carbon and their impact on the DCFC performance.

Experimental

Carbon fuels

Three different types of carbons from Spanish basin were employed as fuels in a direct carbon-fed SOFC: a bituminous coal (BC), an anthracite coal (AC) and a pine charcoal (PCC). To evaluate the possible influence of inorganic compounds on the chemical and electrochemical processes occurring in DCFCs, the bituminous coal was demineralised with the aim to obtain the corresponding counterpart but without mineral matter. The demineralization process was performed by stirring the coal sample in a Teflon beaker with diluted HCl at 75 °C for 45 min. Then the sample was filtered and washed with distilled water. In a second step the filtered sample was again stirred in a Teflon beaker with HF again for 45 min at 75 °C. The resulting sample was filtered and washed with distilled water. Finally, the sample was once more washed with concentrated HCl while stirring again for 45 min at 75 °C. The final demineralised sample (DBC) was then filtered and washed with distilled water until neutral pH and dried at 110 °C overnight.

Fuel preparation in a HCFC

In the hybrid mode of operation, carbon fuels were appropriately admixed with a eutectic mixture of lithium and potassium carbonates (62 mol% Li2CO3–38 mol% K2CO3, Sigma Aldrich) in a carbon/carbonate weight ratio of 4/1 (800 mg carbon + 200 mg carbonate). For fuel preparation the bare carbon was initially diluted in 250 mL of n-hexane and agitated in an ultrasonic device for 15 min before the addition of carbonate mixture. The resulting solution was stirred on a heating plate at 70 °C for 4 h until all the n-hexane evaporated.

Carbons characterization

The fuel samples included in this study (i.e., BC, DBC, AC and PCC) were fully characterized, in terms of petrographic and chemical composition, surface area and porosity (BET), crystalline structure (XRD, Raman) and morphology (SEM). Before characterization studies all samples were milled and sieved to under 75 μm, in order to obtain a similar particle size distribution.

Petrographic analysis

The petrographic composition of the coals (BC and AC) was analyzed in order to quantify the maturity of the coals. The petrographic composition and the reflectance measurements were performed on pellets with randomly oriented particles using a MPV-Combi (Leitz) microscope equipped with oil immersion objectives in polarized light. The petrographic composition was performed by point-counting analysis following the ISO 7404/3 (2009) procedure to determine the presence of maceral in coals.

Chemical analysis

The coals were also chemically characterized by means of elemental analysis (C, H, N, S and O wt% content) in a LECO CHNS-932 (C, H, N, S) and LECO VTF-9000 (O) analyzer. Proximate analysis (volatile matter, ash and moisture content) was carried out in a LECO TGA-601 apparatus. Ash composition was determined by X-ray fluorescence in a Bruker SRS 3000 device.

Textural analysis

The textural characteristics (surface area and porosity) of the coals were determined by means of N2 adsorption–desorption isotherms at −196 °C in the pressure range of 0–1 bar in a Micromeritics Tristar 3020 apparatus.

Structural analysis

Diffractograms were recorded in a Bruker D8 powder diffractometer equipped with a monochromatic Cu-Kα X-ray source and an internal standard of silicon powder. Diffraction data were collected by step scanning with a step size of 0.02° in the range of 5–90°, with an interval of 2 s between steps. Raman spectroscopy was carried out in a labRam HRU using JYV-Jobin Yvon equipment and a laser CDPS532-DPSS at 24.3 mW. The data were acquired in 800–3500 cm−1 range.

Morphological analysis

The morphology of the four carbonaceous feedstock was examined by scanning electron microscopy (SEM) on a Quanta FEG 650 microscope, equipped with an Apollo X detector for EDX measurements.

DCFC fabrication

The fuel cell experiments were carried out in a reactor cell consisting of an 8 mol% yttria-stabilized zirconia (YSZ) tube (15 cm long, 16 mm ID, 19 mm OD, 0.9 mm thickness), closed at its bottom end and encased in a tubular furnace. The cathodic electrode was deposited on the outside bottom end of the YSZ tube, prepared from a silver paste (05X Metallo-organic AG RESINATE) after calcination in static air at 850 °C for 2 h. The heating and cooling rate was 4 °C min−1. The working electrode (anode) was 20 wt% Cu/CeO2. It was prepared from Cu–CeO2 powder (synthesized via wet impregnation and calcined at 550 °C for 2 h) mixed with ethylene glycol at a 1[thin space (1/6-em)]:[thin space (1/6-em)]2 weight ratio. The solution was heated to 200 °C and stirred at 400 rpm until half of the volume was evaporated. The viscous paste was then deposited, with the aid of a paintbrush, on the inside bottom of the YSZ tube. The calcination procedure involved heating, under atmospheric air, to 850 °C for 2 h with a heating rate of 4 °C min−1. After calcination, the cell was left to cool down naturally and at 200 °C, the electrode was reduced in a flow of pure H2 (30 cm3 min−1) for 2 h. The resulting weight of the anodic electrode was 115 mg, resulting in an apparent electrode surface area of 1.7 cm2. Cell connections were established by means of Au wires.

DCFC testing

The fuel cell, loaded with 800 mg of carbon fuel, was heated from room temperature to 750 °C at a heating rate of 4 °C min−1. A certified standard of CO2 (99.99% purity, Air Liquide) was employed as purging gas at the anode side, whereas the cathode was exposed to atmospheric air. The gas flow was controlled by mass flowmeters (Tylan FM 360) and was introduced into the reactor cell with a total flowrate of 30 cm3 (STP) min−1. Fuel cell experiments were carried out at 750 and 800 °C at atmospheric pressure. The developed cell voltage and electrical current were monitored with the use of digital multi-meters (RE60-69) and the external resistive load was controlled by a resistance box (Time Electronics 1051). Analysis of the gas composition was performed by online gas chromatography using a SRI 8610B chromatograph equipped with a Molecular Sieve 5A and a Porapak Q column, with He as the carrier gas.

Results and discussion

Characterization studies

Morphological analysis of carbon fuels. Representative SEM micrographs of different carbons, employed as fuels, are shown in Fig. 1. The difference in nature between the coals (Fig. 1a–c) and the pine charcoal (Fig. 1d) can be seen clearly, as the remaining plant structure can still be observed in the latter. The effect of demineralization is also revealed by the absence of white spots in DBC sample (Fig. 1b), which are due to the mineral content (Fig. 1a). The high mineral matter content of the sample AC is also notable in the micrograph Fig. 1c.
image file: c4ra01022a-f1.tif
Fig. 1 SEM micrographs of (a) bituminous coal, (b) demineralized bituminous coal, (c) anthracite coal and (d) pine charcoal.
Chemical analysis of carbon fuels. The different maturation of the two coals (i.e. BC and AC) was revealed with the petrographic analysis. Table 1 shows the different maceral composition of the two coals. The vitrinite and liptinite content is very similar in both coals, while the inertinite presence is very different. The usual control parameter for the coal evolution (i.e. reflectance) also indicates a higher maturation of the anthracite coal.
Table 1 Petrographic composition of the coal samples
Fuels Reflectance (%) Vitrinite (vol%) Liptinite (vol%) Inertinite (vol%)
BC 1.50 80.6 0.2 17.4
AC 2.25 78.4 0.0 1.0


This different evolution of the two coals results in different chemical composition. In Table 2 the proximate and ultimate analysis of the samples studied are shown. It can be observed that the volatile matter content increases from AC to BC and PCC. The AC sample has the highest ash and sulphur content, which could contribute to performance deterioration. In contrast, PCC has the highest volatile matter and oxygen content, which may contribute to a higher reactivity of this fuel and therefore a higher carbon conversion. All these chemical parameters are expected to influence to a great extent the DCFC characteristics and performance. On the other hand, it can be verified that the demineralization process performed with the BC sample, eliminated the mineral matter (i.e. the ash content decreased from 4.6 to 0.4 wt%) without any other chemical modification (i.e. volatiles, C, H, N, S wt%), except for a slight increase in the oxygen content due to the acid treatment.

Table 2 Proximate and ultimate analysis of the fuel samples
Fuels Proximate analysis (wt%) Ultimate analysis (wt%, dry ash free basis)
VM Asha Moisturea C H N S O
a On dry basis.  
AC 9.7 32.5 1.5 88.6 4.0 1.5 2.2 3.7
BC 18.5 4.6 1.0 91.9 4.7 1.5 0.9 1.0
DBC 18.1 0.4 1.2 89.9 4.3 1.6 0.7 3.5
PCC 32.4 1.6 5.5 75.6 3.9 0.3 0.0 20.7


The effect of demineralization in the case of PCC is anticipated to be insignificant because of the low mineral matter content of the original sample (i.e. 1.6 wt%). On the other hand, in the case of AC the ash content is very high (i.e. 32.5 wt%) thus the demineralization process is expected to notably reduce the mineral matter content. In this regard, it has been reported that acid washing has a notable effect on the physicochemical characteristics of different carbon fuels and in turn to cell performance. A slight to moderate increase in power output has been reported.2 However, it should be noted that demineralization process is not recommended for coals with high ash content, such as AC, because it is a time- and cost-consuming process. Demineralisation is proposed for coals with low to moderate ash content.

Textural and structural analysis of carbon fuels. Fuel samples were also characterized in terms of their physical structure. The porosity of the carbon fuels that influences the diffusion of the reactants throughout the structure was determined by N2 adsorption–desorption isotherms which are depicted in Fig. 2.
image file: c4ra01022a-f2.tif
Fig. 2 Nitrogen adsorption–desorption isotherms at −196 °C of the carbon fuels studied.

It can be seen that in all cases the porosity is very low, resulting in a BET area lower than 10 m2 g−1. However, it is worth noting that the AC sample shows the lowest adsorption, and therefore the lowest available porosity, of all samples. Furthermore, it seems that the PCC sample has a higher volume of mesopores (the so-called transport pores) due to its higher adsorption in the region of the medium relative pressures (see Fig. 2).

Although, the demineralization process is expected to increase the BET surface area due to carbon leach out, this is not the case here. The latter can be mainly attributed to the relatively low elimination of mineral matter in the case of BC; ash content is decreased from 4.6 to 0.4 wt% upon demineralization. On the other hand, in low surface area samples (<10 m2 g−1 for BC and DBC), the experimental error of BET method could be significant, prohibiting the accurate estimation of BET areas. Furthermore, the destruction of pore walls and the blocking of micropores entrance by oxygen complexes that could be induced by the acid treatment can be further accounted for the inferior textural properties of DBC sample.24,25

The structure of carbons is critical since it determines their reactivity and conductivity, which in turn affects the overall cell performance. Fig. 3 shows the X-ray spectra of the fuels studied. The typical peaks of the carbonaceous structure at (002) and (100) can be observed at ca. 25° and 43°, respectively; the latter is less intense due to the presence of amorphous carbon with more or less ordered structure. However, it is evident that the principal peak (002), at ca. 25°, is broader in the PCC sample compared to BC or DBC, implying a less ordered structure. Samples BC and DBC are nearly identical indicating that the demineralisation process did not produce substantial changes. Finally, sample AC should, in theory, present a more ordered structure compared to other fuels, but the high mineral matter content (i.e. 32.5 wt%) hampers the clear analysis of this sample.


image file: c4ra01022a-f3.tif
Fig. 3 X-ray diffraction spectra of the carbon fuels studied.

To further explore the crystallite structure of AC, BC and PCC fuels, the Raman spectra of these samples were acquired (Fig. 4). All coals showed a D and G band at ca. 1350 and 1600 cm−1, respectively, although they are not very well resolved. This is clearly due to the inherent structure disorder of coals and biomass. Although, it is very difficult to evaluate quantitatively differences in the structure order of the fuels studied, the ratio of the intensity of D and G bands is usually considered as most reliable in order to evaluate the degree of order/disorder. This ratio generally increases with the degree of disorder in graphitic materials.26 The corresponding values of ID/IG of the fuels studied are 0.68, 0.73 and 0.85, for AC, BC and PCC, respectively. Even though these values are not very different, there is a clear tendency to increase the disorder from the anthracite coal, to bituminous coal and finally the pine charcoal. The latter exhibited the most disordered structure, as also confirmed by XRD results (Fig. 3).


image file: c4ra01022a-f4.tif
Fig. 4 Raman spectra of carbon fuels in 800–3500 cm−1 range.

Cell performance

Fig. 5 shows the impact of carbon type on DCFC performance, in terms of developed current and power density, at 750 and 800 °C under CO2 flow. It is obvious that the best performance is obtained by the PCC sample which demonstrates a maximum power density of 7.0 and 12.0 mW cm−2 at 750 and 800 °C, respectively. Under the same conditions much lower power density values are obtained with the AC, BC and DBC, implying the superiority of biomass as a feedstock in DCFCs. The enhanced performance of DBC compared to BC should also be noted, implying the beneficial effect of the demineralization process on cell performance. Thus, the following order, in terms of maximum power density, is recorded: PCC > DBC > BC > AC (Table 3).
image file: c4ra01022a-f5.tif
Fig. 5 Effect of carbon type on DCFC performance at 750 and 800 °C. Feedstock: 800 mg carbon; CO2 flow = 30 cc min−1.
Table 3 Effect of carbon type and fuel cell mode of operation (direct or hybrid) on cell characteristics at 750 °C and 800 °C
Carbon type DCFCa HCFCb
Pmax (mW cm−2) OCVc (mV) I0d (mA cm−2) Pmax (mW cm−2) OCV (mV) I0 (mA cm−2)
a Feedstock: 800 mg carbon.b Feedstock: 800 mg carbon + 200 mg carbonates.c Open Circuit Voltage (OCV).d Exchange current density (I0) estimated from Tafel plots.
750 °C
AC 1.25 −923 0.32 3.57 −985 1.22
BC 2.51 −740 0.76 4.47 −992 2.02
DBC 3.18 −845 1.75 5.20 −1005 2.44
PCC 7.00 −927 2.67 7.86 −1011 4.02
 
800 °C
AC 3.35 −918 1.43 5.77 −1015 1.58
BC 4.65 −780 1.62 7.88 −1030 2.62
DBC 5.53 −880 2.23 9.53 −1024 3.25
PCC 12.00 −985 5.07 12.60 −1037 5.51


The corresponding results obtained in the hybrid carbon solid oxide fuel cell, with a carbon fuel to Li2CO3–K2CO3 electrolyte weight ratio of 4[thin space (1/6-em)]:[thin space (1/6-em)]1, are depicted in Fig. 6. It is evident that the same trend, in relation to the impact of carbon type on cell performance, is obtained under the hybrid mode of operation: PCC > DBC > BC > AC. However, it should be noted that a notable increase in the maximum power density is achieved by utilizing molten carbonates eutectic mixtures at the anode compartment. Depending on carbon type and temperature an enhancement in power output up to 185% is recorded compared to the non-hybrid DCFCs (Table 3). When employing AC and BC as fuels in HCFCs the power output is almost doubled compared to DCFCs. However, in the case of PCC sample the power enhancement is marginal, slightly increasing the achieved maximum power density from 12 to 12.6 mW cm−2 at 800 °C (Table 3).


image file: c4ra01022a-f6.tif
Fig. 6 Effect of carbon type on HCFC performance at 750 and 800 °C. Feedstock: 800 mg carbon + 200 mg carbonates; CO2 flow = 30 cc min−1.

It is of worth noticing that an almost linear correlation between the achieved power density and the CO formation rate at open circuit conditions is observed (Fig. 7) demonstrating the key role of the in situ produced CO, on the DCFC and HCFC performance.


image file: c4ra01022a-f7.tif
Fig. 7 Correlation of maximum power density with the CO formation rate under open circuit conditions in the absence (DCFC) or presence (HCFC) of carbonates at 800 °C. Feedstock = 800 mg carbon (+200 mg carbonates); CO2 flow = 30 cm3 min−1.

It is evident that the CO formation follows the order: PCC > DBC > BC > AC perfectly reflecting the achieved DCFC performance. The latter can be mainly interpreted by taking into account the impact of carbon characteristics (mainly porosity and intrinsic reactivity) on the extent of reverse Boudouard reaction toward CO formation and its subsequent electro-oxidation at the anode AEZ. The present findings are in complete agreement with the “CO shuttle mechanism” proposed by Gür,13–15 suggesting that the produced CO is the active participant in the electro-oxidation reactions taking place at the AEZ instead of solid carbon.

Interestingly, the enhanced performance of HCFC compared to DCFC is followed by higher CO formation rates (Fig. 7). This implies that the improved electrochemical performance of HCFC can be ascribed, apart from the high fluidity of carbon in anode side, to the additional amount of CO formed though the reactions (6) and (7).

Concerning the developed Open Circuit Voltage (OCV), it is of worth mentioning that the absolute OCV values follow, in general, the same trend with the CO formation rate and the achieved electrochemical performance (Fig. 5–7, Table 3). Absolute OCV is increased with the operating temperature and when carbonates are infused in the carbon feedstock. Furthermore, in both the DCFC and HCFC operation, the slope of the cell voltage–current density curves, reflecting the overall cell resistance, is decreasing as the achieved electrochemical performance increases. Always, pine charcoal exhibited the lowest IV slope denoting that it displays the optimum physicochemical properties in view of their impact on overall cell resistance. The latter may include the activation overpotential, the ohmic losses corresponding to cell materials, electrical contacts and carbon feedstock resistance as well as the mass transfer limitations due to the diffusion of the neutral and charged chemical species.

To further gain insight into the impact of carbon type and temperature on DCFC or HCFC performance the exchange current density values, Io, were estimated employing the Tafel equation:27

 
ln|I| = ln|Io| + (αF/RT)η, (9)
where α is the anodic charge transfer coefficient, F is the Faraday's constant, R is the ideal gas constant and T is the absolute temperature.

The determined exchange current density values, which are reflecting the intrinsic rate of the charge transfer reaction taking place at the AEZ, are depicted in Table 3. As it can be obviously noticed, the Io values follow exactly the same trend with the achieved cell performance. They are increased with temperature and with the reactivity of the employed carbonaceous feedstock, while under HCFC operation they are clearly enhanced compared to the carbonates-free cell operation. These findings clearly highlight the impact of carbon reactivity and carbonates addition on charge transfer reactions at the AEZ and in consequence on cell performance. Further electrochemical studies are in progress in order to identify the contribution of each counterpart on the overall cell resistance.

The above presented results clearly revealed that the electrochemical performance strongly depends on the physicochemical characteristics of carbon. Typical results concerning the impact of carbon characteristics on DCFC performance are shown in Fig. 8.


image file: c4ra01022a-f8.tif
Fig. 8 Correlation of maximum power density with the volatile matter (A) and sulphur (B) content. Carbon loading = 800 mg; CO2 flow = 30 cm3 min−1.

It is clear that the volatile matter (Fig. 8A), follows the same trend as the power density output, i.e. PCC > DBC ≈ BC > AC, implying its beneficial role in cell performance. In contrast the sulfur content (Fig. 8B) follows the reverse trend with the achieved maximum power density, suggesting its inhibiting role in DCFC performance. Furthermore taking into account the higher porosity (Fig. 2) and less ordered structure (Fig. 3 and 4) of most effective PCC sample, it can be deduced that porosity and crystal disorder have a pronounced effect on DCFC performance.

The short-term stability of DCFC and HCFC employing bituminous coal as fuel is finally investigated. Fig. 9 depicts the variations in power density and in CO effluent rate with time on stream (16 h) during potensiostatic operation at maximum power voltage (513 and 524 mV for DCFC and HCFC, respectively). The power output of DCFC is slumped from ∼6 mW cm−2 to 1 mW cm−2 in the first 4 hours, then slightly decreased approaching very low values at the end of experiment. An analogous behavior was demonstrated for HCFC; the power is sharply decreased from ∼8 mW cm−2 to 1.5 mW cm−2 in the first 4 hours. Taking into account the batch mode of operation in both cases, the continuously increase consumption of carbon with time on stream can be considered as the limiting factor toward fuel cell degradation. Similar stability behaviour has been demonstrated for several carbon fuel cells operating under batch conditions.28


image file: c4ra01022a-f9.tif
Fig. 9 Variations of power density and CO formation rate with time on stream during the potensiostatic operation of DCFC and HCFC at 800 °C. Feedstock = 800 mg bituminous (+200 mg carbonates); CO2 flow = 30 cm3 min−1.

It is also of worth noticing that the power output almost coincides with the CO formation rate. The latter further verifies the “CO shuttle mechanism”,13–15 implying that the gaseous CO, instead of solid carbon, is the key participant in the electro-oxidation reactions taking place at the AEZ.

Conclusions

The feasibility of employing different types of carbons as fuels in direct carbon solid oxide fuel cells was explored by utilizing anthracite coal, bituminous coal, demineralized bituminous coal and pine charcoal as feedstock. The hybrid mode of operation was investigated by admixing carbon with a eutectic mixture of lithium and potassium carbonates at a carbon/carbonate weight ratio of 4[thin space (1/6-em)]:[thin space (1/6-em)]1. The results revealed that carbon physicochemical characteristics, such as volatile matter, and structure disorder greatly enhanced the performance of fuel cell either in the presence or absence of carbonates, whereas ash and sulphur contents have a detrimental effect. The use of carbonates in HCFCs significantly improves the fuel cell performance, being more intense in low reactive carbons and at lower temperatures. Furthermore a close correlation between the CO formation rate at open circuit conditions and the achieved electrochemical performance was observed indicating that the overall chemical and electrochemical processes are driven by a CO shuttle mechanism. In all cases, the optimum behaviour in terms of maximum power density was obtained for pine charcoal, implying the potential of biomass as fuel in DCFCs, besides other advantages like low cost, worldwide availability and renewable nature.

Acknowledgements

The authors would like to acknowledge financial support from the European project “Efficient Conversion of Coal to Electricity – Direct Coal Fuel Cells”, which is funded by the Research Fund for Carbon & Steel (RFC-PR-10007).

References

  1. S. Giddey, S. P. S. Badwal, A. Kulkarni and C. Munnings, Prog. Energy Combust. Sci., 2000, 38, 360 CrossRef PubMed.
  2. A. C. Rady, S. Giddey, S. P. S. Badwal, B. P. Ladewing and S. Bhattacharya, Energy Fuels, 2012, 26, 1471 CrossRef CAS.
  3. X. Li, Z. Zhu, R. D. Marco, J. Bradley and A. Dicks, J. Phys. Chem. A, 2010, 114, 3855 CrossRef CAS PubMed.
  4. S. Nürnberger, R. Bußar, P. Desclaux, B. Franke, M. Rzepka and U. Stimming, Energy Environ. Sci., 2010, 3, 150 Search PubMed.
  5. W. H. A. Peelen, M. Olivry, S. F. Au, J. D. Fehribach and K. Hemmes, J. Appl. Electrochem., 2000, 30, 1389 CrossRef CAS.
  6. J. Zhang, Z. Zhong, J. Zhao, M. Yang and W. Li, Can. J. Chem. Eng., 2012, 90, 762 CrossRef CAS.
  7. C. G. Lee, K. S. Ahn, H. C. Lim and J. M. Oh, J. Power Sources, 2004, 125, 166 CrossRef CAS PubMed.
  8. S. L. Jain, J. B. Lakeman, K. D. Pointon and J. T. S. Irvine, Solid Oxide Fuel Cells, 2007, 10, 829 Search PubMed.
  9. Y. Nabae, K. D. Pointon and J. T. S. Irvine, Energy Environ. Sci., 2008, 1, 148 CAS.
  10. Y. Nabae, K. D. Pointon and J. T. S. Irvine, J. Electrochem. Soc., 2009, 156, B716 CrossRef CAS PubMed.
  11. C. Jiang and J. T. S. Irvine, J. Power Sources, 2011, 196, 7318 CrossRef CAS PubMed.
  12. X. Xu, W. Zhou and Z. Zhu, RSC Adv., 2014, 4, 2398–2403 RSC.
  13. T. M. Gür, Chem. Rev., 2013, 113, 6179–6206 CrossRef PubMed.
  14. T. M. Gür and R. A. Huggins, J. Electrochem. Soc., 1992, 139, L95 CrossRef PubMed.
  15. B. R. Alexander, R. E. Mitchell and T. M. Gür, J. Power Sources, 2013, 228, 132 CrossRef CAS PubMed.
  16. N. J. Cherepy, R. Krueger, K. J. Fiet, A. F. Jankowski and J. F. Cooper, J. Electrochem. Soc., 2005, 152, A80 CrossRef CAS PubMed.
  17. X. Li, Z. Zhu, R. De Marco, J. Bradley and A. Dicks, J. Power Sources, 2010, 195, 4051 CrossRef CAS PubMed.
  18. D. G. Vutetakis, D. R. Skidmore and H. J. Byker, J. Electrochem. Soc., 1987, 134, 3027 CrossRef CAS PubMed.
  19. R. B. Lima, R. Raza, H. Qin, J. Li, M. E. Lindström and B. Zhu, RSC Adv., 2013, 3, 5083 RSC.
  20. M. Dudek, P. Tomczyk, R. Socha, M. Skrzypkiewicz and J. Jewulski, Int. J. Electrochem. Sci., 2013, 8, 3229 CAS.
  21. S. Y. Ahn, S. Y. Eom, Y. H. Rhie, Y. M. Sung, C. E. Moon, G. M. Choi and D. J. Kim, Energy, 2013, 51, 447 CrossRef CAS PubMed.
  22. I. Suelves, M. J. Lázaro, M. A. Diez and R. Moliner, Energy Fuels, 2002, 16, 878 CrossRef CAS.
  23. J. L. Figueiredo, C. Valenzuela, A. Bernalte and J. M. Encinar, Biol. Wastes, 1989, 28, 217 CrossRef CAS.
  24. X. Li, Z. Zhu, J. Chen, R. De Marco, A. Dicks, J. Bradley and G. Lu, J. Power Sources, 2009, 186, 1 CrossRef CAS PubMed.
  25. J. Zhang, Z. Zhong, D. Shen, J. Zhao, H. Zhang, M. Yang and W. Li, Energy Fuels, 2011, 25, 2187 CrossRef CAS.
  26. J. I. Paredes, S. Villar-Rodil, P. Solís-Fernández, A. Martíınez-Alonso and J. M. D. Tascón, Langmuir, 2009, 25, 5957 CrossRef CAS PubMed.
  27. J. O. M. Bockris and A. K. N. Reddy, Mod. Electrochem., Plenum Press, New York, 1977 Search PubMed.
  28. C. Jiang, J. Ma, A. D. Bonaccorso and J. T. S. Irvine, Energy Environ. Sci., 2012, 5, 6973 CAS.

This journal is © The Royal Society of Chemistry 2014