A patterned colorimetric sensor array for rapid detection of TNT at ppt level†
Anders Berlinera,
Myung-Goo Leeab,
Yagang Zhang‡
c,
Seong H. Parkb,
Raymond Martinoa,
Paul A. Rhodesa,
Gi-Ra Yi*b and
Sung H. Lim*a
aiSense, LLC Mountain View, CA 94043, USA. E-mail: slim@isensesystems.com
bSchool of Chemical Engineering, Sungkyunkwan University, Suwon 440746, South Korea. E-mail: yigira@skku.edu
cDepartment of Chemistry, University of Illinois at Urbana-Champaign, Urbana, Illinois 61801, USA
First published on 5th February 2014
Abstract
We describe a simple photolithographic method for patterning a porous membrane to create well-defined polymer walls to improve the printability of a colorimetric sensor array. The resulting array demonstrated highly selective detection of 2,4,6-trinitrotoluene (TNT) vapour and other nitroaromatic compounds.
Chemical sensors for the rapid detection of explosives are of great importance because of their many military and security applications.1 Frequently, trained canines are used for detecting explosives; however, this method is expensive and not well-suited for continuous monitoring as dogs get easily fatigued.2 As a result, various explosives detection technologies have emerged. For instance, amplifying fluorescent polymers showed selective detection of explosives, and have a detection limit comparable to that of trained dogs.3 Other methods are bulky and require sophisticated instrumentation that is not easily applied to on-site field testing.4 Such examples include gas chromatography coupled with mass spectrometry,5 surface enhanced Raman spectroscopy,6 nuclear quadrupole resonance,7 energy dispersive X-ray diffraction,8 electron capture detection,9 and cyclic voltammetry.10 Ion mobility spectrometry,11 which is commonly used in airports, has sensitivity in the picogram to nanogram range, but is expensive, prone to false positives, and spectrometers must be frequently calibrated. Thus, development of a fast, portable, and sensitive technique to detect trace amounts of TNT vapour still remains a challenge.
Recently, Suslick et al. have developed a disposable colorimetric sensor array (CSA) technology based on nanoporous pigments.12 The nanoporous pigments provide enormous surface area, increasing the interaction surface between analyte and indicator. Such arrays have been successfully applied to detect and identify a wide range of analytes in both gas13 and liquid phase.13b,14 While the nanoporous pigments-based array worked well for a diverse set of analytes, including toxic industrial chemicals, the existing CSA lacked indicators that strongly interact with nitroaromatics, including TNT.
Nitroaromatics are electronic deficient molecules that readily interact with electron rich species; this characteristic can be exploited to design a new colorimetric sensor array capable of detecting nitroaromatics at low vapour concentrations. The Janovsky reaction is an excellent method to detect nitroaromatics with strong bases as shown in Scheme 1.15 This chemical interaction has been known for a century, but typically occurs in liquid phase. We have screened different alkalines, and identified Isamine T-101 (iSense, LLC) to be the most effective in detecting nitroaromatics. When Isamine coated paper is exposed to a trace amount of nitroaromatics, the paper turns dark upon contact (see ESI, Fig. S1†). Unfortunately, the viscous nature of this polymer mixture resulted in poor printability with conventional printing techniques, including a pin-printing method.12a Patterning photoresist onto a porous membrane provided spatial control of viscous formulations, and allowed uniform deposition of the polymer formulations.16 By incorporating these new chromogenic reagents with appropriate formulations into our existing colorimetric sensor array, rapid and direct vapour phase detection of nitroaromatics was made possible.
Several different printing substrates were evaluated for chemical compatibility with our chromogenic reagents and the patterning method, including polyvinyldifluoride (PVDF), polypropylene, polythersulfone, cellulose, glass fiber and nitrocellulose acetate membranes. Among them, only glass fiber and cellulose paper were chemically compatible with our formulations and the process. Most other substrates either changed colour or dissolved upon contact with our formulations. In addition to chemical compatibility, glass fiber also resulted in uniform photo-patterning through the membrane when a mixture of tri(propylene glycol) diacrylate (TPGDA) and trimethylol propane (TMPTA) was used as photoresist. Refractive indices of TPGDA and TMPTA are 1.45 and 1.47, respectively, which are close to the glass fiber (1.43). When the substrate was soaked with the photoresists, it became translucent, minimizing UV light scattering during the photo-curing process. The cellulose paper also worked, but the patterning was not as effective in containing the printed formulation as the glass fiber substrate. In addition, the selected photoresists have low viscosity to allow facile diffusion throughout the membrane without any solvent. The viscosity of TPGDA is less than 20 mPa s and TMPTA has less than 100 mPa s. After the substrate has been soaked with a 9![[thin space (1/6-em)]](https://www.rsc.org/images/entities/char_2009.gif) :
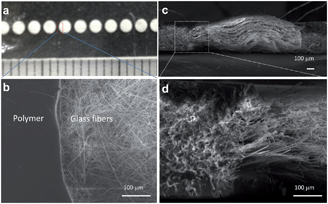
:![[thin space (1/6-em)]](https://www.rsc.org/images/entities/char_2009.gif) 1 mixture of TPGDA and TMPTA, the resulting substrate was exposed to UV light with a photomask to selectively polymerize the monomers (Fig. 1). When the TMPTA concentration was increased, cracks were formed during washing of unreacted monomers due to higher crosslinking density that may have caused inhomogeneous tension during polymerization (see ESI, Fig. S2†).
1 mixture of TPGDA and TMPTA, the resulting substrate was exposed to UV light with a photomask to selectively polymerize the monomers (Fig. 1). When the TMPTA concentration was increased, cracks were formed during washing of unreacted monomers due to higher crosslinking density that may have caused inhomogeneous tension during polymerization (see ESI, Fig. S2†).
 | ||
| Fig. 1 (a) Photograph and (b) SEM image of patterned glass fiber. Cross-sectional SEM images at (c) low and (d) high-magnification. | ||
The patterned membrane was functionalized with 19 different chromogenic reagents by a direct contact printing method. In contrast to our prior works, the pattern array was printed in a linear format and housed in a cartridge with reduced headspace to enhance sensor response (see ESI, Fig. S3–5†). The printing procedure for the 16 nanoporous pigments is previously reported using slotted pins.12a These pigments were fabricated by encapsulating chemoresponsive dyes in a sol–gel matrix. For 3 new indicators based on polymeric amines, formulations are too viscous and difficult to uniformly print onto a membrane. As such, the patterning method to make demarcated polymeric walls is essential for uniform printing of the sensor array. This technique allowed uniform printing of linear sensor arrays (1 × 19) with 1.0 mm spot diameter. The full list of chromogenic reagents used is shown in Table S1 (see ESI†).
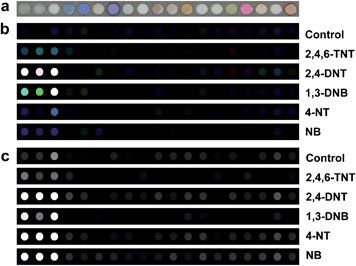
For the vapour analysis, the patterned CSA was imaged with a broad band camera with a colour wheel containing four colour filters (red, green, blue and UV). Colour and UV images were collected before exposure to analytes and at one min intervals after exposure for 30 minutes. The detection time highly depended on the analyte and its concentration, but 5 nitroaromatics at 10% of their saturated vapour pressure could be detected and identified within 10 minutes of exposure as shown in Fig. 2. For each image, we extracted 76-dimensional vectors of the red, green, blue, and UV values by taking the median of all pixels within a 20 pixel radius. The colour vectors can be extracted using SpotFinder (iSense, LLC) or using ImageJ, a public-domain image-processing program available from the National Institutes of Health.
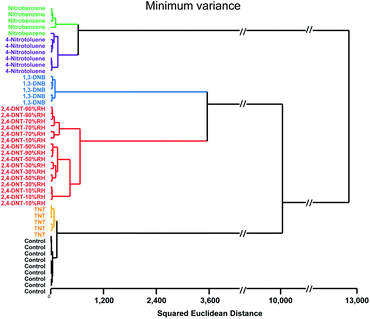
For quantitative analysis, we assembled a database with minimum of quintuplicate runs of five nitroaromatics at approximately 10% of their saturated vapor pressure. The analytes studied included: TNT (0.5 ppb), 2,4-dinitrotoluene (18 ppb), 2,4-dinitrobenzene (110 ppb), 4-nitrotoluene (20 ppm), and nitrobenzene (30 ppm). As the number of the nitro group in a molecule increased, the sensor response increased accordingly. For example, TNT can be detected even at 100 ppt, while dinitro aromatics could be detected at low ppb levels. With 4-nitrotoluene and nitrobenzene, our limits of detection are in ppm range (Table 1). The sensor response to nitroaromatics is irreversible with a wide dynamic range (ppt to ppm range); hence, longer exposure time linearly increased the signal intensity (see ESI, Fig. S10†). Furthermore, when exposed to nitroaromatics, nucleophilic amines (indicators 1–3) showed bathchromic shift for benzene derivatives, while hypsochromic shift was observed for toluene derivatives. The UV channel showed dramatic colour change for all nitroaromatics, which aided more facile discrimination of nitroaromatics. For instance, hierarchical cluster analysis gave discrete clusters for each analyte with 98% accuracy (Fig. 3). One misclassification derived from one trial of nitrobenzene being confused as 4-nitrotoluene, which is not surprising considering that they are both mono-nitro aromatic compounds. HCA also showed that varying relative humidity (range 10% to 90% RH) did not interfere with the classification of 2,4-DNT.
| Analyte | LoD after 10 min | LoD after 30 min |
|---|---|---|
| 2,4,6-Trinitrotoluene | 0.6 ppb | 0.1 ppb |
| 2,4-Dinitrotoluene | 1.7 ppb | 1.3 ppb |
| 1,3-Dinitrobenzene | 11.7 ppb | 7.0 ppb |
| 4-Nitrotoluene | 2.1 ppm | 1.3 ppm |
| Nitrobenzene | 3.0 ppm | 1.9 ppm |
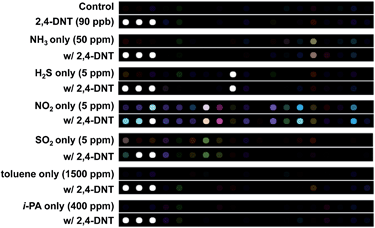
We also evaluated the shelf life of the TNT sensor array by storing the array in a hermetically sealed plastic bag and monitoring the sensor response over time. The stability of the array was remarkably good, and we observed no degradation of the indicators even after 3 months of storage. Furthermore, we evaluated the sensor with various industrial interferents to simulate the real world conditions as shown in Fig. 4. First, 90 ppb of 2,4-DNT was generated and the sensor array showed very slight decrease in sensor response as RH increased. However, we believe this decrease in sensor response is primarily due to surface passivation of the analyte, which is enhanced with increasing humidity. After the end of each trial, we replaced the sensor and flowed clean N2, and observed the 2,4-DNT response, indicative of the presence of 2,4-DNT in the gas flow path. Similarly, several industrial chemicals (e.g., ammonia (NH3), hydrogen sulphide (H2S), nitrogen dioxide (NO2), sulphur dioxide (SO2), toluene and isopropanol) were tested along with the analyte at 30% relative humidity (Fig. 4). Acidic interferents, such as NO2 and SO2, can neutralize the amines, and hence diminish the sensor response to nitroaromatics. However, at their permissible exposure level (PEL), the sensor response to 2,4-DNT diminished nominally, and the analyte can still be detected easily due to sufficient amount of indicators printed on the sensor array. With other interferents, no significant changes in sensor response were observed for the TNT indicators, indicating a great degree of specificity and resistance to interferents. Other nanoporous pigments responded to the tested interferents, but their response was completely orthogonal as shown in Fig. 4.
 | ||
| Fig. 4 Response of 2,4-DNT at 90 ppb in the presence of various interferences at their permissible exposure levels, except for H2S at 1/4 PEL. | ||
In summary, we have developed a new colorimetric indicator implementation, which is capable of detecting TNT at the 100 ppt level. We further developed an effective method to print selected viscous polymer solutions along with our nanoporous pigments using a UV-patterned printing substrate. The 19 spot linear array allowed discrimination of five different nitroaromatic compounds, and the sensor response was orthogonal to potential interferents. The patterned sensor array allows a more diverse set of chromogenic indicators to be printed, allowing highly sensitive and selective detection of nitroaromatics. Furthermore, our patterned linear sensor array showed excellent shelf life (>90 days).
Acknowledgements
We are thankful to Professor Kenneth Suslick for the valuable discussions and suggestions. This work was financially supported by the DARPA RealNose program, iSense LLC, Korea NRF (2010-0029409, 2011-0031978), and the Department of Defence (JIEDDO/TSWG CB3614).Notes and references
- J. Yinon and S. Zitrin, Modern Methods and Applications in Analysis of Explosives, John Wiley & Sons Ltd., Chichester, 1996 Search PubMed.
- K. G. Furton and L. J. Myers, Talanta, 2001, 54, 487 CrossRef CAS.
- (a) A. Narayanan, O. P. Varnavski, T. M. Swager and T. Goodson, III, J. Phys. Chem. C, 2008, 112, 881 CrossRef CAS; (b) A. Rose, Z. G. Zhu, C. F. Madigan, T. M. Swager and V. Bulovic, Nature, 2005, 434, 876 CrossRef CAS PubMed; (c) J. S. Yang and T. M. Swager, J. Am. Chem. Soc., 1998, 120, 11864 CrossRef CAS; (d) J. S. Yang and T. M. Swager, J. Am. Chem. Soc., 1998, 120, 5321 CrossRef CAS; (e) Q. Zhou and T. M. Swager, J. Am. Chem. Soc., 1995, 117, 12593 CrossRef CAS; (f) T. M. Swager, Acc. Chem. Res., 2008, 41, 1181 CrossRef CAS PubMed; (g) S. W. Thomas, G. D. Joly and T. M. Swager, Chem. Rev., 2007, 107, 1339 CrossRef CAS PubMed.
- (a) J. C. Kapoor and G. K. Kannan, Def. Sci. J., 2007, 57, 797 CAS; (b) R. G. Smith, N. D'Souza and S. Nicklin, Analyst, 2008, 133, 571 RSC; (c) H. Ostmark, S. Wallin and H. G. Ang, Propellants, Explos., Pyrotech., 2012, 37, 12 CrossRef; (d) Y. Salinas, R. Martinez-Manez, M. D. Marcos, F. Sancenon, A. M. Costero, M. Parra and S. Gil, Chem. Soc. Rev., 2012, 41, 1261 RSC; (e) J. Yinon, TrAC, Trends Anal. Chem., 2002, 21, 292 CrossRef CAS.
- K. Hakansson, R. V. Coorey, R. A. Zubarev, V. L. Talrose and P. Hakansson, J. Mass Spectrom., 2000, 35, 337 CrossRef CAS.
- (a) H. Ko, S. Chang and V. V. Tsukruk, ACS Nano, 2009, 3, 181 CrossRef CAS PubMed; (b) J. M. Sylvia, J. A. Janni, J. D. Klein and K. M. Spencer, Anal. Chem., 2000, 72, 5834 CrossRef CAS.
- V. P. Anferov, G. V. Mozjoukhine and R. Fisher, Rev. Sci. Instrum., 2000, 71, 1656 CrossRef CAS PubMed.
- R. D. Luggar, M. J. Farquharson, J. A. Horrocks and R. J. Lacey, X-Ray Spectrom., 1998, 27, 87 CrossRef CAS.
- T. F. Jenkins, D. C. Leggett, P. H. Miyares, M. E. Walsh, T. A. Ranney, J. H. Cragin and V. George, Talanta, 2001, 54, 501 CrossRef CAS.
- M. Krausa and K. Schorb, J. Electroanal. Chem., 1999, 461, 10 CrossRef CAS.
- G. A. Eiceman and J. A. Stone, Anal. Chem., 2004, 76, 390A CAS.
- (a) S. H. Lim, L. Feng, J. W. Kemling, C. J. Musto and K. S. Suslick, Nat. Chem., 2009, 1, 562 CrossRef CAS PubMed; (b) S. H. Lim, J. W. Kemling, L. Feng and K. S. Suslick, Analyst, 2009, 134, 2453 RSC.
- (a) L. Feng, C. J. Musto, J. W. Kemling, S. H. Lim and K. S. Suslick, Chem. Commun., 2010, 46, 2037 RSC; (b) C. J. Musto, S. H. Lim and K. S. Suslick, Anal. Chem., 2009, 81, 6526 CrossRef CAS PubMed.
- S. H. Lim, C. J. Musto, E. Park, W. X. Zhong and K. S. Suslick, Org. Lett., 2008, 10, 4405 CrossRef CAS PubMed.
- (a) J. Meisenheimer, Justus Liebigs Ann. Chem., 1902, 323, 205 CrossRef CAS; (b) F. Terrier, Chem. Rev., 1982, 82, 77 CrossRef CAS; (c) G. A. Artamkina, M. P. Egorov and I. P. Beletskaya, Chem. Rev., 1982, 82, 427 CrossRef CAS.
- D. R. Ballerini, X. Li and W. Shen, Microfluid. Nanofluid., 2012, 13, 769 CrossRef.
Footnotes |
| † Electronic supplementary information (ESI) available. See DOI: 10.1039/c3ra47152g |
| ‡ Current address: Xinjiang Technique Institute of Physics & Chemistry Chinese Academy of Sciences, Xinjiang 830011, China. |
| This journal is © The Royal Society of Chemistry 2014 |


