Terminal effects on gelation by low molecular weight chiral gelators†
Hisako
Sato
*a,
Emiko
Nogami
b,
Tomoko
Yajima
b and
Akihiko
Yamagishi
c
aDepartment of Chemistry, Graduate School of Science and Engineering, Ehime University, Matsuyama 790-8577, Japan. E-mail: sato.hisako.my@ehime-u.ac.jp; Fax: +81-89-927-9599; Tel: +81-89-927-9599
bGraduate School of Humanities and Sciences, Ochanomizu University, Tokyo, 112-8610, Japan
cDepartment of Chemistry, Toho University, Funabashi, Chiba 274-8510, Japan
First published on 21st November 2013
Abstract
Gel formation by low molecular mass gelators was investigated. The gelator was trans(RR)- or trans(SS)-N,N′-n-bromoalkanoyl-1,2-diaminocyclohexane (denoted as RR-CnBr or SS-CnBr, respectively; n = the number of carbon atoms in an alkanoyl group). When n was varied from 5 to 12, the gelators formed transparent or opaque or turbid gels in benzene except for n = 8. Focusing on the end effects, the gelation behavior of CnBr was compared with that of non-brominated counterparts (denoted as RR- or SS-Cn). From the vibrational circular dichroism (VCD) spectra of enantiomeric gelator/benzene-d6 gels, the signs of the coupled peaks around 1640 cm−1, which were assigned to the symmetric and asymmetric C![[double bond, length as m-dash]](https://www.rsc.org/images/entities/char_e001.gif) O stretching vibrations from the higher to lower wavenumber, respectively, were opposite between SS-CnBr and SS-Cn (or between RR-CnBr and RR-Cn). On the other hand, the signs of the coupled peaks around 1550 cm−1 assigned to the NH stretching vibrations remained unaffected. The observed reversal of the signs in the C
O stretching vibrations from the higher to lower wavenumber, respectively, were opposite between SS-CnBr and SS-Cn (or between RR-CnBr and RR-Cn). On the other hand, the signs of the coupled peaks around 1550 cm−1 assigned to the NH stretching vibrations remained unaffected. The observed reversal of the signs in the C![[double bond, length as m-dash]](https://www.rsc.org/images/entities/char_e001.gif) O couplet was rationalized in terms of the different modes of stacking in fibrils. In the case of Cn, for example, the molecules were stacked through anti-parallel double intermolecular hydrogen bonds using two pairs of >NH and >C
O couplet was rationalized in terms of the different modes of stacking in fibrils. In the case of Cn, for example, the molecules were stacked through anti-parallel double intermolecular hydrogen bonds using two pairs of >NH and >C![[double bond, length as m-dash]](https://www.rsc.org/images/entities/char_e001.gif) O groups, while, in the case of CnBr, a single intermolecular hydrogen bond was formed with the remaining pair of >NH and >C
O groups, while, in the case of CnBr, a single intermolecular hydrogen bond was formed with the remaining pair of >NH and >C![[double bond, length as m-dash]](https://www.rsc.org/images/entities/char_e001.gif) O groups forming an intramolecular hydrogen bond. Single crystal X-ray analyses were performed for SS-C6Br and SS-C8Br. The results demonstrated that the length of the bromoalkanoyl chains drastically affected the packing modes in crystalline states.
O groups forming an intramolecular hydrogen bond. Single crystal X-ray analyses were performed for SS-C6Br and SS-C8Br. The results demonstrated that the length of the bromoalkanoyl chains drastically affected the packing modes in crystalline states.
Introduction
Organogels form a continuous three-dimensional entangled network in organic solvents.1 Knowledge of the molecular stacking structure in a fibril would be helpful for understanding the origin of driving force for gelation as well as for developing efficient gelators.1–14Vibrational circular dichroism (VCD) is an extension into the infrared and near-infrared regions of the circular dichroism spectrosccopy.15,16 By utilizing a large amount of information concerning 3N-6 normal vibrations (N = the number of atoms in a molecular), the method has been proved to be powerful in determining the absolute configuration and molecular conformation of a chiral molecule in a solution.15 In these years, the VCD method is applied to chiral molecular aggregates.17–28 The VCD spectra of an organogel formed by perfluorinated gelators were measured, for example, in order to analyze the conformation of a chiral gelator in a fibril.14 One of remarkable features was that the gelators gave more than one order larger VCD signals in gels than in solutions. By comparing the observed and calculated spectra, the conformation of a gelator, including the helical winding of perfluorinated chains, was determined.
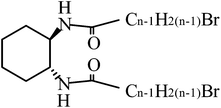
In the present study, gelation was investigated for the gels formed by trans-diaminocyclohexane derivatives with alkanoyl chains of various length. The used gelator molecules were trans(R,R)- or trans(S,S)-N,N′-n-bromoalkanoyl-1,2-diaminocyclohexane (denoted as RR-CnBr or SS-CnBr, respectively; n = the carbon number of alkanoyl chains). The terminal of an alkanoyl group was mono-brominated. The VCD measurements and single crystal X-ray analyses were performed on gels and crystals. With a focus on the terminal effects, gelation behavior was compared between the brominated and non-brominated gelators (denoted as CnBr and Cn, respectively). As a result, the different mode of stacking of gelator molecules was proposed.
The work is an extension of the previous paper on the gelation of Cn.13 These non-brominated gelators, Cn's (n = 6–12), all showed gelation ability. From the VCD studies, it was deduced that, in case of C6 and C7, gelator molecules were stacked through a single chain of intermolecular hydrogen bonds using a pair of >NH and >C![[double bond, length as m-dash]](https://www.rsc.org/images/entities/char_e001.gif) O groups, while, in case of C8, C9, C10 and C12, gelator molecules were stacked with their cyclohexyl rings in parallel, forming the double anti-parallel chains of intermolecular hydrogen bonds using two pairs of >NH and >C
O groups, while, in case of C8, C9, C10 and C12, gelator molecules were stacked with their cyclohexyl rings in parallel, forming the double anti-parallel chains of intermolecular hydrogen bonds using two pairs of >NH and >C![[double bond, length as m-dash]](https://www.rsc.org/images/entities/char_e001.gif) O groups. The main purpose of studying the gelation properties of brominated correspondents was to see how these chain length effects were affected by replacing a terminal hydrogen atom with a bromine atom. The presence of a bulky bromine atom was expected to perturb the regular chain stacking in fibrils.
O groups. The main purpose of studying the gelation properties of brominated correspondents was to see how these chain length effects were affected by replacing a terminal hydrogen atom with a bromine atom. The presence of a bulky bromine atom was expected to perturb the regular chain stacking in fibrils.
Results and discussion
Formation of gels
RR - (or SS-)N,N′-di-n-bromoalkanoyl-1,2-diaminocyclohexane with the alkanoyl chains of various length (denoted as RR- or SS-CnBr; n = the carbon number of alkanoyl chains (Chart 1) was synthesized according to the reported method.5,6 The materials were identified by 1H NMR and mass spectra (see the ESI†). The compounds (denoted by C5Br–C12Br) except for n = 8 gelated various solvents as shown in the ESI.† In case of C7Br, C9Br and C11Br, transparent gels were formed for benzene, toluene, xylene and mesitylene, while, in case of C10Br and C12Br, opaque gels were formed for the same solvents. In case of C5Br and C6Br, a turbid gel was formed, being stable at least for two month. C8Br alone formed no gel for the investigated range of solvents. The photographs of gels in benzene were shown in the ESI.†Table 1 summarizes the critical gel concentrations (CGC's) for benzene at 25 °C. The experiments were performed for both RR- and SS-enantiomers. According to the results, C7Br gave the lowest CGC value among the gelators giving a clear gel. Since C8Br formed no gel, the elongation of an alkanoyl chain by only one carbon atom caused the drastic change of gel capability. No such an effect of alkanoyl chain length was observed in case of Cn's. When the CGC values are compared between CnBr and Cn (or Cn+1), generally the values of CGC were higher for CnBr than for Cn (or Cn+1).13 Replacement of a hydrogen atom with a bromine atom at the terminal position might result in the disturbance of chain stacking in a fibril. This was caused by the increase of the size of the terminal atom: van der Waals radius (RBr) = 0.195 nm, RH = 0.12 nm.
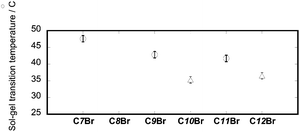
Fig. 1 shows the sol–gel phase transition temperature (Tc) for benzene at the constant concentration of a gelator. According to the figure, C7Br gave the highest Tc, or it formed the most thermally stable gel in a series of CnBr (n = 7, 9, 10, 11 and 12). These were in marked contrast with the results obtained for a series of non-brominated gelators, Cn.13 For the latter groups, the gelation ability increases with the increase of the alkyl chain length. The results are further discussed on the basis of molecular packing in crystals.
Stability was studied for a transparent benzene gel formed by C7Br. At the concentration higher than 0.3 M, the gel was stable for about five months as a transparent gel and gradually gave a white solid around the edge region of the sample after that period. The similar transition of a gel to a crystal was reported elsewhere.29 At the lower concentration (e.g. 0.15 M), the transparent gel was stable for more than ten months. The opaque gels formed by C10Br and C12Br were transformed to turbid gels in two weeks. The photographic images concerning these changes are shown in the ESI.†
SEM observation
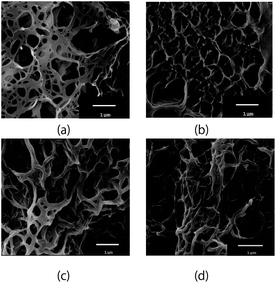
Fig. 2 shows the SEM images of the benzene gels formed by RR- (or SS-) C7Br and RR- (or SS-) C12Br. The results on other gelators (CnBr's; n = 6, 9, 10 and 11) are given in the ESI.† No helically wound fibril was observed in these gels. Instead they took a planar shape with the thickness of ca. 0.1 μm. This was in contrast with what was observed for Cn gels, in which fiber-like fibrils wound helically and their helicity was uniquely dependent on the molecular chirality of a gelator.5 The results suggested that the stacking mode of CnBr was different from that of Cn.IR and VCD measurements
The IR and VCD spectra were recorded on the C6D6 gels formed by chiral CnBr (n = 7–12). Our basic policy in applying the VCD spectroscopy to gel systems is following: (i) a VCD spectrum is measured on a gel sample. The reliability of the spectrum is obtained by the mirror–image relation for the opposite enantiomers. (ii) The peaks in the observed spectrum are assigned by comparing with the theoretical IR spectrum calculated for a single molecule under a certain conformation. (iii) A special attention is paid to the signs of a characteristic peak such as >C![[double bond, length as m-dash]](https://www.rsc.org/images/entities/char_e001.gif) O or –NH2. The conformation of a molecule is optimized so as to reproduce the observed signs of these peaks. It should be emphasized that the sign of a VCD peak is very sensitive to the molecular conformation. (iv) The aggregation model for a fibril is constructed by connecting molecules under the determined conformation. The above policy was applied to the gels by several low-molecular weight gelators.13,14,25
O or –NH2. The conformation of a molecule is optimized so as to reproduce the observed signs of these peaks. It should be emphasized that the sign of a VCD peak is very sensitive to the molecular conformation. (iv) The aggregation model for a fibril is constructed by connecting molecules under the determined conformation. The above policy was applied to the gels by several low-molecular weight gelators.13,14,25
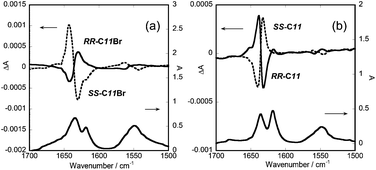
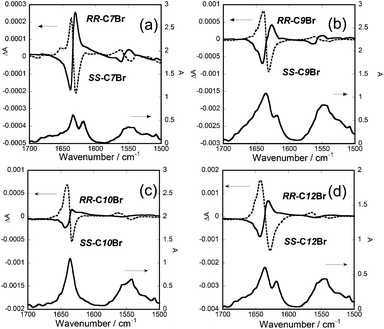
The VCD results are shown in Fig. 3(a) and (b) and 4(a)–(d). The main peaks in the VCD spectra were mirror-imaged between the antipodes in the wavenumber range of 1700–1500 cm−1, confirming the reliability of the measurements. When the gel samples were rotated vertically around the direction of the monitoring light, no change of the spectra was observed. Thus the contribution of linear dichroism was negligible.
Firstly the spectra are compared between the gels by C11Br and C11. As for the weak couplets of the peaks around 1550 cm−1, which were assigned to the bending vibrations of N–H bond, their signs were the same between these two. On the other hand, as for the strong couplet around 1640 cm−1, which was assigned to the stretching vibration of C![[double bond, length as m-dash]](https://www.rsc.org/images/entities/char_e001.gif) O bond, their signs were reversed. In case of RR-C11, for example, the signs of the couplet were plus at 1638 cm−1 and minus at 1632 cm−1. The same reversal of signs was observed for the gelators of n = 8, 9, 10 and 12.13 In contrast, in case of RR-C11Br, the signs of the couplet were plus at 1626 cm−1 and minus at 1645 cm−1. The IR peak corresponding to the couplet was shifted 5 cm−1 towards lower number than the peak of a free C
O bond, their signs were reversed. In case of RR-C11, for example, the signs of the couplet were plus at 1638 cm−1 and minus at 1632 cm−1. The same reversal of signs was observed for the gelators of n = 8, 9, 10 and 12.13 In contrast, in case of RR-C11Br, the signs of the couplet were plus at 1626 cm−1 and minus at 1645 cm−1. The IR peak corresponding to the couplet was shifted 5 cm−1 towards lower number than the peak of a free C![[double bond, length as m-dash]](https://www.rsc.org/images/entities/char_e001.gif) O group, indicating the formation of hydrogen bonds (as reported to be 1655–1620 cm−1 for amide I).30 Thus the observed reversal of the signs suggested the different mode of hydrogen bond between CnBr and Cn.
O group, indicating the formation of hydrogen bonds (as reported to be 1655–1620 cm−1 for amide I).30 Thus the observed reversal of the signs suggested the different mode of hydrogen bond between CnBr and Cn.
Powder X-ray diffraction measurements
The XRD patterns were measured on the powder samples and the toluene gels formed by CnBr's (n = 7–12). Here toluene was chosen instead of benzene in order to avoid drying during measurements. The results are shown in the ESI.† In all of the gel samples, the broad peaks were observed, indicating that these gels were stable enough and composed of less ordered domains.The powder samples of CnBr's (n = 8, 10 and 12) showed several sharp diffraction peaks, indicating that they were composed of well grown crystallines. By indexing each peak, the size of the unit cell was deduced to be a = 1.4–2.2 nm, b = 0.8–1.0 nm and c = 0.4 nm. To this contrary, the powder samples of CnBr's (n = 7, 9 and 11) showed and a broad peak around 2θ ∼ 20° with no sharp peak, indicating that these solids were in low crystallinity. For the present series of gelators, the chain length of an alkanoyl group showed an odd-and-even effect on crystal growth.31
Single crystal X-ray analyses
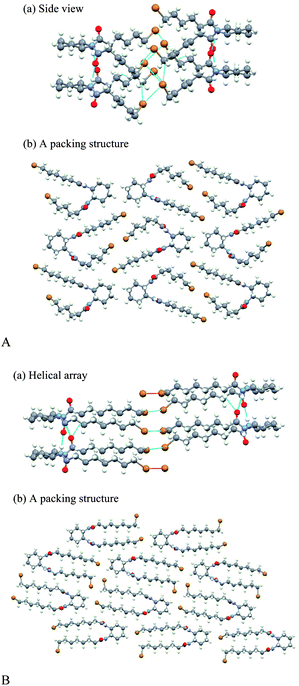
Single crystal X-ray analyses were performed on SS-C6Br and C8Br. These two gelators were the only compounds that provided single crystals among the investigated gelators. The upper and lower pictures in Fig. 5A show the molecular packing structures of SS-C6Br viewed along the b-axis and on the a-axis, respectively. The molecular column extends in the direction of the b-axis, in which the molecule orients its two pairs of NH and CO groups oppositely with respect to the cyclohexyl plane so that two chains of hydrogen bonds are formed along the column axis in an anti-parallel fashion. One of the brominated alkyl groups is bent, taking cis-conformations at the β-carbon from the carbonyl carbon atom. As a result, there is a close contact between the two bromine atoms of the adjacent molecules. Such close packing might be a reason for the fact that C6Br formed a turbid gel and was readily crystallized.The upper and lower pictures in Fig. 5B show the molecular packing structures of SS-C8Br viewed along the c-axis and on the a-axis, respectively. The molecular column extends in the direction of the b-axis, forming two anti-parallel chains of hydrogen bonds as in the case of C6Br. In contrast to C6Br, however, both of alkyl chains are straight in all-trans conformation. They eject oppositely or the one upward and the other downward from the cyclohexyl plane. As a result, the intermolecular Br–Br chain is formed, connecting the terminal bromine atoms in a helical way. Its helicity is determined by the SS/RR configuration of a cyclohexyl part. The high crystallinity of C8Br might be caused by such interactions among bromine atoms.
As stated in the proceeding section, C8Br was unable to form a gel, while C6Br and C7Br were a good gelator. According to the packing structure in a crystal as obtained above, the main reason for the lack of gelation ability in case of C8Br is that the compound readily formed a crystal from many solvents. In the crystal, the molecules stacked with their brominated octanoyl chains stretched in a parallel way (Fig. 5B). The presence of the bulky bromine atom at the terminal caused little steric interference. It would give a clue to the effects of a bromine atom on the stacking in fibrils, if crystal packing is compared between the brominated and non-brominated gelators. There is, however, no such data available for Cn except for C4 which rarely gives a gel.9
Theoretical analyses of VCD spectra
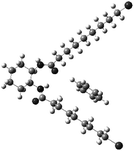
The molecular conformation of a gelator molecule in a fibril was analysed by comparing the observed and theoretical VCD spectra (Fig. 4). The calculated spectra were obtained for a single molecule (details are described in the Calculation details). Fig. 6 shows the optimized structure of a monomeric RR-C9Br associated with a benzene molecule, in which both of alkyl chains took all trans-configuration. Fig. 7 shows the IR and VCD spectra calculated for RR-C9Br under this conformation. The calculated spectra reproduced the observed ones (Fig. 4a) to a satisfactory extent. For example, the signs of the couplet of N–H bending were predicted to locate at 1560 cm−1 with a negative sign and at 1548 cm−1 with a positive sign. The couplet due to C![[double bond, length as m-dash]](https://www.rsc.org/images/entities/char_e001.gif) O stretching was predicted to locate at 1758 cm−1 with a negative sign and at 1730 cm−1 with a positive sign. The signs agreed with the spectra measured on the C6D6 gel.
O stretching was predicted to locate at 1758 cm−1 with a negative sign and at 1730 cm−1 with a positive sign. The signs agreed with the spectra measured on the C6D6 gel.
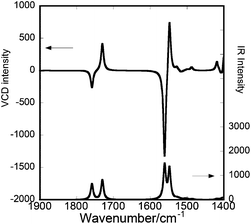 | ||
| Fig. 7 The theoretical IR (lower) and VCD (upper) spectra calculated for RR-C9Br. The gelator molecule is assumed to be associated with a benzene molecule as shown in Fig. 6. | ||
When the optimized structure of RR-C9Br was examined in details, a pair of >NH and >C![[double bond, length as m-dash]](https://www.rsc.org/images/entities/char_e001.gif) O groups on different alkyl chains were positioned closely enough to form an intramolecular hydrogen bond. As for the remaining pair of >NH and >C
O groups on different alkyl chains were positioned closely enough to form an intramolecular hydrogen bond. As for the remaining pair of >NH and >C![[double bond, length as m-dash]](https://www.rsc.org/images/entities/char_e001.gif) O groups, they might form an intermolecular hydrogen bond by using it. According to the previous study, RR-Cn (n = 8, 9, 10 and 12) was proposed to use both of their >NH and >C
O groups, they might form an intermolecular hydrogen bond by using it. According to the previous study, RR-Cn (n = 8, 9, 10 and 12) was proposed to use both of their >NH and >C![[double bond, length as m-dash]](https://www.rsc.org/images/entities/char_e001.gif) O groups for forming intermolecular hydrogen bonds. They are stacked through two anti-parallel chains of hydrogen bonds.13 Thus the observed reversal of the signs of the VCD couplets due to C
O groups for forming intermolecular hydrogen bonds. They are stacked through two anti-parallel chains of hydrogen bonds.13 Thus the observed reversal of the signs of the VCD couplets due to C![[double bond, length as m-dash]](https://www.rsc.org/images/entities/char_e001.gif) O stretches between RR-CnBr and RR-Cn had an origin in the different conformations of these gelators in fibrils.
O stretches between RR-CnBr and RR-Cn had an origin in the different conformations of these gelators in fibrils.
When the molecules are connected by a single chain of hydrogen bonds in the aggregate of CnBr, their cyclohexyl rings are expected to be arranged on a plane in an alternatively opposite direction. The aggregate would take a tape-like shape instead of a fiber-like aggregate as seen for Cn (n = 8, 9, 10, 11 and 12). Based on the present models, the lower gelation capability by CnBr might be related to the weaker binding (or a single chain of hydrogen bonds) in the molecular aggregation.
Conclusion
In conclusion, the replacement of a hydrogen atom with a bromine atom at the terminal of an alkanoyl group influenced drastically the hydrogen bonding interaction at the >C![[double bond, length as m-dash]](https://www.rsc.org/images/entities/char_e001.gif) O and –NH2 in the head group of a gelator. As a result, the dependence of gelation ability on the length of alkanoyl chains was quite different from that for the non-brominated gelators. In this sense, the present work provided a spectroscopic evidence for the propagation of the end effects along an alkyl chain up to the head group of a gelator.
O and –NH2 in the head group of a gelator. As a result, the dependence of gelation ability on the length of alkanoyl chains was quite different from that for the non-brominated gelators. In this sense, the present work provided a spectroscopic evidence for the propagation of the end effects along an alkyl chain up to the head group of a gelator.
Experimental
Syntheses of RR- and SS-CnBr (n = 5–12)
N,N′-dialkanoyl-trans-1,2-diaminocyclohexane (denoted by RR- or SS-CnBr, respectively) were synthesized according to the reported method by Hanabusa et al.5,6 One equivalent of (1R, 2R)- or (1S, 2S)-1,2-diaminocyclohexane was coupled with 2 equiv. of an alkyl acid chloride using excess triethylamine in THF (details in the ESI†). The product was purified by being washed with an aqueous 1 M HCl solution (yields 60–90%). The molecules were identified by 1H NMR, optical rotation and mass spectra. The results of 1H NMR, elemental analyses, mass spectra and optical rotation are shown in the ESI.†Measurements of sol–gel transition temperature
CGC and melting temperature were determined by the method using a magnetic stirrer as described in the previous reports.5,13 As a pre-treatment, the gel was warmed to melt and subsequently cooled to room temperature. A stirrer was placed onto a cooled gel and the gel was warmed slowly. At the melting temperature, the stirrer went down from a surface into the inside of the gel. The test was repeated at least three times. Melting temperatures were obtained reproducibly within ±1 °C. These melting tests were performed for benzene and toluene gels.Differential Scanning Calorimetry (DSC)
DSC measurements were carried out with a DSC6200 (SEIKO, Japan). Heating and cooling were performed at a scan rate of 10 °C min−1. The results are shown in the ESI.†Optical Rotatory Dispersion (ORD) measurements
ORD measurements were carried out with a DIP-1000 (JASCO, Japan). The gelator was dissolved in methanol at about 2 mmol L−1. The ORD of a methanol solution of a gelator was measured at 589 nm by using a 10 cm cell. The results are given in the ESI.†Powder XRD measurements
X-Ray diffraction measurements were performed with a XRD (Ultima IV, Rigaku) under CuKα radiation (λ = 0.15406 nm) at the conditions of 40 kV, 30 mA, and 2θ min−1 scanning. The results are shown in the ESI.†SEM observation
The morphology of the gel samples was investigated with a FE-SEM (JSM-6700FT, Jeol) at 7 kV. The gel samples were placed on a brass mount and freeze-dried.VCD measurements
The VCD spectra were measured using a spectrometer PRESTO-S-2007 (JASCO, Japan).13,14,28 The absorption signals were detected using a liquid nitrogen cooled MCT infrared detector equipped with ZnSe windows. Spectra were recorded at 4 cm−1 resolution. Signals were accumulated for 3000 × 104 scans in about 0.5–2 h. The FT-IR absorbance was adjusted below 1.0 in order to attain the optimal signal-to-noise ratio in VCD measurements. The gel concentration was varied at the critical gel concentration (about 0.15 M). A gel sample for VCD measurements was prepared in the following way: firstly the weighed amount (ca. 10–20 mg) of the enantiomeric sample was dissolved in C6D6 (ca. 200 μL) at 40 °C. Thereafter about 50 μL of the solution was sandwiched between two CaF2 plates with a 50 μm spacer. The transparent film was formed between two CaF2 plates. After cooling to room temperature, the stock solution was transformed into a gel. The reproducible VCD signals were obtained for several samples independently prepared.Single-Xray-measurement
X-ray single crystal diffraction data were collected using Mo-Kα radiation on a Bruker CCD APEX II diffractometer at −80 °C. Structures were solved by direct methods using SHELXL-97. All hydrogen atoms were placed in their ideal positions and all nonhydrogen atoms were refined anisotropically. Detailed crystal structure information is listed in the attached CIF files.Computational details
The monomeric species under the C1 symmetry of RR-C9Br was optimized by Gaussian 09 program at the DFT level (B3LYP functional) with 6-31G(d, p), respectively.32 The monomer with one benzene molecule was also optimized to study for capturing the benzene molecule. The IR and VCD spectra were calculated on the basis of the magnetic field perturbation (MFP) theory. Description of calculated modes was made from the animations of the modes and spectra with Gaussview 5.08 (Gaussian Inc.).Acknowledgements
The authors thank Mr Ryosuke Watanabe (Ehime University) for the syntheses of gelators and measurements of transition temperatures, XRD and SEM samples. We also thanks Dr Kazuya Morimoto and Ms Miwa Ochi (Ehime University) for obtaining SEM images.Notes and references
- Low Molecular Mass Gelators Design, Self-Assembly, Function, ed. F. Fages, Springer, Berling, Heidlberg, 2005 Search PubMed; Molecular Gels, ed. R. G. Weiss and P. Terech, Springer, Netherlands, 2006 Search PubMed.
- M.-O. M. Piepenbrock, G. O. Lloyd, N. Clarke and J. W. Steed, Chem. Rev., 2010, 110, 1960 CrossRef CAS PubMed; L. Frkanex and M. Žinić, Chem. Commun., 2010, 46, 522 RSC; A. Ajayaghosh and V. K. Praveen, Acc. Chem. Res., 2007, 40, 644 CrossRef PubMed; M. George and R. G. Weiss, Acc. Chem. Res., 2006, 39, 489 CrossRef PubMed; L. A. Estroff and A. D. Hamilton, Chem. Rev., 2004, 104, 1201 CrossRef PubMed; P. Terech and R. G. Weiss, Chem. Rev., 1997, 97, 3133 CrossRef PubMed; P. Dastidar, Chem. Soc. Rev., 2008, 37, 2699 RSC.
- J. H. van Esch and B. L. Feringa, Angew. Chem., Int. Ed., 2000, 39, 2263 CrossRef CAS; J. H. van Esch, Langmuir, 2009, 25, 8392 CrossRef PubMed.
- T. Tachibana, T. Mori and K. Hori, Nature, 1979, 278, 578 CrossRef CAS; K. Yabuuchi, E. Marfo-Owusu and T. Kato, Org. Biomol. Chem., 2003, 1, 3464 Search PubMed; Y. Li, T. Wang and M. Liu, Soft Matter, 2007, 3, 1312 RSC; A. R. J. Hirst, I. A. Coates, T. R. Boucheteau, J. F. Miravet, B. Escuder, V. Castelletto, I. W. Hamley and D. K. Smith, J. Am. Chem. Soc., 2008, 130, 9113 CrossRef PubMed.
- K. Hanabusa, M. Yamada, M. Kimura and H. Shirai, Angew. Chem., Int. Ed., 1996, 35, 1949 CrossRef CAS.
- J. H. Jung, Y. Ono, K. Hanabusa and S. Shinkai, J. Am. Chem. Soc., 2000, 122, 5008 CrossRef CAS; K. Hanabusa, K. Maesaka, Y. Suzuki, M. Kimura and H. Shirai, Chem. Lett., 2000, 1168 CrossRef.
- J. J. E. Moreau, L. Vellutini, M. W. C. Man and C. Bied, Chem. Eur. J., 2003, 9, 1594 CrossRef CAS PubMed.
- M. Moriyama, N. Mizoshita, T. Yokota, K. Kishimoto and T. Kato, Adv. Mater., 2003, 13, 1335 CrossRef.
- N. Zweep, A. Hopkunson, A. Meetsma, W. R. Browne, B. L. Feringa and J. H. van Esch, Langmuir, 2009, 25, 8802 CrossRef CAS.
- K. A. Houton, K. L. Morris, L. Chen, M. Schmidtmann, J. T. A. Jones, L. C. Serpell, G. O. Lloyd and D. J. Aadms, Langmuir, 2012, 28, 9797 CrossRef CAS PubMed.
- S. K. Samanta, A. Pal and S. Bhattacharya, Langmuir, 2009, 25, 8567 CrossRef CAS PubMed.
- D.-C. Lee, B. Cao, K. Jang and P. M. Forster, J. Mater. Chem., 2010, 20, 867 RSC.
- H. Sato, T. Nakae, K. Morimoto and K. Tamura, Org. Biomol. Chem., 2012, 10, 1581 CAS.
- K. Kohno, K. Morimoto, N. Manabe, T. Yajima, A. Yamagishi and H. Sato, Chem. Commun., 2012, 48, 3860 RSC; H. Sato, T. Yajima and A. Yamagishi, Chem. Commun., 2011, 47, 3736 RSC.
- P. J. Stephens, J. Phys. Chem., 1985, 89, 748 CrossRef CAS; L. A. Nafie, T. A. Keiderling and P. J. Stephens, J. Am. Chem. Soc., 1976, 98, 2715 CrossRef; M. Bieri, C. Gautier and T. Bürgi, Phys. Chem. Chem. Phys., 2007, 9, 671 RSC; J. Sadlej, J. X. Dobrowolski and J. E. Rode, Chem. Soc. Rev., 2010, 39, 1478 RSC; G. Yang and Y. Xu, Top. Curr. Chem., 2011, 298, 189 CrossRef; H. Sato and A. Yamagishi, Int. J. Mol. Sci., 2013, 14, 964 CrossRef PubMed.
- S. Ma, X. Cao, M. Mak, A. Sadik, C. Walkner, T. B. Freedman, U. K. Lednev, R. K. Dukor and L. A. Nafie, J. Am. Chem. Soc., 2007, 129, 12364 CrossRef CAS PubMed; D. Kurouski, R. A. Lombardi, R. K. Dukor, I. K. Lednev and L. A. Nafie, Chem. Commun., 2010, 46, 7154 RSC.
- T. J. Measey and R. Schweitzer-Stenner, J. Am. Chem. Soc., 2011, 133, 1066 CrossRef CAS PubMed.
- N. Jiang, R. X. Tan and J. Ma, J. Phys. Chem. B, 2011, 115, 2801 CrossRef CAS PubMed.
- A. G. Petrovic and P. L. Polavarapu, J. Phys. Chem. B, 2005, 109, 23698 CrossRef CAS PubMed.
- T. Kawauchi, J. Kumaki, A. Kitaura, K. Okoshi, H. Kusanagi, K. Kobayashi, T. Sugai, H. Shinohara and E. Yashima, Angew. Chem., Int. Ed., 2008, 47, 515 CrossRef CAS PubMed.
- B. Berthier, T. Buffeteau, J.-M. Léger, R. Oda and I. Huc, J. Am. Chem. Soc., 2002, 124, 13486 CrossRef PubMed.
- V. Setnička, J. Nový, S. Böhm, N. Sreenivasachary, M. Urbanová and K. Volka, Langmuir, 2008, 24, 7520 CrossRef PubMed.
- E. Scwartz, S. R. Domingos, A. Vdovin, M. Doepf, W. J. Buma, J. J. L. M. Cornelissen, A. E. Rowan, R. J. M. Nolte and S. Woutersen, Macromolecules, 2010, 43, 7931 CrossRef.
- C. Merten and A. Hartwig, Macromolecules, 2010, 43, 8373 CrossRef CAS.
- H. Sato, K. Hori, T. Sakurai and A. Yamagishi, Chem. Phys. Lett., 2008, 467, 140 CrossRef CAS PubMed; H. Sato, T. Sakurai and A. Yamagishi, Chem. Lett., 2011, 40, 25 CrossRef.
- M. Kudo, T. Hanashima, A. Muranaka, H. Sato, M. Uchiyama, I. Azumaya, T. Hirano, H. Kagechika and A. Tanatani, J. Org. Chem., 2009, 74, 8154 CrossRef CAS PubMed.
- K. Miyamoto, H. Jintoku, T. Sawada, M. Takafuji, T. Sagawa and H. Ihara, Tetrahedron Lett., 2011, 52, 4030 CrossRef CAS PubMed.
- T. Sasaki, I. Hisaki, T. Miyano, N. Tohai, K. Morimoto, H. Sato, S. Tsuzuki and M. Miyata, Nat. Commun., 2013, 4, 1787, DOI:10.1038/ncomms2756.
- S. Saha, E.-M. Schön, C. Cativiela, D. Díaz Díaz and R. Banerjee, Chem. Eur. J., 2013, 19, 9562 CrossRef CAS PubMed; M. Pyzalska, M. Smal and R. Luboradzki, J. Non-Cryst. Solids, 2011, 357, 3184 CrossRef PubMed; Y. Xu, C. Kang, Y. Chen, Z. Bian, X. Qiu, L. Gao and Q. Meng, Chem. Eur. J., 2012, 18, 16955 CrossRef PubMed; S. Samai, P. Ghosh and K. Biradha, Chem. Commun., 2013, 49, 4181 RSC; I. Kapoor, E.-M. Schön, J. Bachl, D. Kühbeck, C. Cativiela, S. Saha, R. Banerjee, S. Roelens, J. J. Marrero-Tellado and D. Díaz Díaz, Soft Matter, 2012, 8, 3446 RSC; K. J. Gao, S. Wu, T. J. Emge and M. A. Rogers, CrystEngComm, 2013, 15, 4507 RSC; S. P. Anthony, L. Wang, S. Varughese and S. M. Draper, CrystEngComm, 2013, 15, 6602 RSC; A. Mallick, E.-M. Schön, T. Panda, K. Sreenivas, D. Díaz Díaz and R. Banerjee, J. Mater. Chem., 2012, 22, 14951 RSC; G. O. Lloyd and J. W. Steed, Soft Matter, 2011, 7, 75 RSC; D. Braga, S. d'Agostino, E. D'Amen and F. Grepioni, Chem. Commun., 2011, 47, 5154 RSC; C. D. Jones, J. C. Tan and G. O. Lloyd, Chem. Commun., 2012, 48, 2110 RSC.
- R. M. Silverstein, G. C. Bassler and T. C. Morrill, Spectrometric identification of organic compounds, John Wiley & Sons, Inc., New York, 1974 Search PubMed.
- N. Fujita, Y. Sakamoto, M. Shirakawa, M. Ojima, A. Fujii, M. Ozaki and S. Shinkai, J. Am. Chem. Soc., 2007, 129, 4134 CrossRef CAS PubMed; K. Aoki, M. Kudo and N. Tamaoki, Org. Lett., 2004, 6, 4009 CrossRef PubMed; M. Suzuki, M. Nanbu, M. Yumoto, H. Shirai and K. Hanabusa, New J. Chem., 2005, 29, 1439 RSC; G. O. Lloyd, M.-O. M. Piepenbrock, J. A. Foster, N. Clarke and J. W. Steed, Soft Matter, 2012, 8, 204 RSC; T. Ishi-i, R. Iguchi, E. Snip, M. Ikeda and S. Shinkai, Langmuir, 2001, 17, 5825 CrossRef; T. Sumiyoshi, K. Nishimura, M. Nakano, T. Handa, Y. Miwa and K. Tomioka, J. Am. Chem. Soc., 2003, 125, 12137 CrossRef PubMed; J. H. Jung and S. Shinkai, J. Chem. Soc., Perkin Trans. 2, 2000, 2393 RSC.
- M. J. Fischand et al.Gaussian 09, Revision A.02, Wallingford, CT, 2009 Search PubMed.
Footnote |
| † Electronic supplementary information (ESI) available: Syntheses of CnBr; 1H NMR, mass spectra, DSC, and ORD; critical gel concentration; photographic images of some gels; the dependence of sol–gel transition temperature on the concentration of RR-C7Br for various solvents; SEM image of RR- and SS-C9Br, C10Br and C11Br and C6Br; XRD of powder and toluene-gel states, toluene solvent; molecular models of gels; VCD of C6Br in turbid gel; X-ray crystallographic data (CCDC 946263 for SS-C6Br and 946264 for SS-C8Br), See DOI: 10.1039/c3ra44070b |
| This journal is © The Royal Society of Chemistry 2014 |

