Online mercury determination by laser-induced breakdown spectroscopy with the assistance of solution cathode glow discharge
Peichao
Zheng
*,
Hongdi
Liu
,
Jinmei
Wang
,
Minjie
Shi
,
Xiaomeng
Wang
,
Bin
Zhang
and
Rui
Yang
College of Optoelectronic Engineering, Chongqing University of Posts and Telecommunications, Chongqing Municipal Level Key Laboratory of Photoelectronic Information Sensing and Transmitting Technology, Chongqing 400065, P. R. China. E-mail: zhengpc@cqupt.edu.cn; Fax: +86-23-62460592; Tel: +86-23-62460592
First published on 3rd December 2014
Abstract
The trace mercury in an aqueous solution was determined by laser-induced breakdown spectroscopy (LIBS) with the assistance of a solution cathode glow discharge (SCGD) system. The aqueous solution was converted to the gas phase using a high voltage DC discharge, and then the generated mercury vapor was cooled by a gas–liquid separator to improve the concentration of the mercury. Finally, a 1064 nm wavelength Nd:YAG laser was used to produce the plasma. In the present experiment, the characteristic spectral line of Hg I 253.65 nm was selected for the analysis, under the optimal conditions of LIBS, to investigate the influences of the acid anion, the discharge current, the sample flow rate and the carrier gas flow rate. The temporal behavior of the electron temperature and electron number density were also investigated; the results show that the electron temperature decreases from about 10![[thin space (1/6-em)]](https://www.rsc.org/images/entities/char_2009.gif) 900 K to 8800 K with a delay time from 200 ns to 6 μs and that the electron number density is in the orders of 1017 and 1018 cm−3, and decreases with delay time. The analytical performance of this method was evaluated under optimized conditions, and a calibration curve of Hg was plotted based on the different concentrations measurement results, and the detection limit (LOD) of Hg was calculated to be 0.36 mg L−1. By this experimental configuration, the detection limit and sensitivity of Hg are improved to some extent. This method provides an alternative analytical method for the measurement of trace mercury in water.
900 K to 8800 K with a delay time from 200 ns to 6 μs and that the electron number density is in the orders of 1017 and 1018 cm−3, and decreases with delay time. The analytical performance of this method was evaluated under optimized conditions, and a calibration curve of Hg was plotted based on the different concentrations measurement results, and the detection limit (LOD) of Hg was calculated to be 0.36 mg L−1. By this experimental configuration, the detection limit and sensitivity of Hg are improved to some extent. This method provides an alternative analytical method for the measurement of trace mercury in water.
Introduction
Nowadays, environmental pollution problems are seen as being more and more serious, with heavy metal pollution being a particular concern. Various heavy metal pollution releases from industry, transport, and domestic waste have had a serious influence on environmental and human health.1 Mercury is one of the most toxic and hazardous of elements, and problems arise as it is durable, easy to transport, and can have a high biological enrichment, where any form of mercury can be converted into toxic methyl–mercury under certain conditions. Thus, mercury is considered a global pollutant, due to its long residence time, and as a major concern as mercury pollution has greatly increased in recent years. As a naturally occurring element, mercury can be found throughout the environment (soil, water, air) where it exists in three forms: elemental or metallic, inorganic, and organic.2 Due to the characteristics mentioned above, there is an increasing concern about the determination and monitoring of mercury. Strict regulations of the maximum allowable mercury concentration in the environment and food samples have been established throughout the world, but effective detecting methods are in urgent demand for the corresponding supervisory departments who have to monitor mercury.In the past several decades, many detection methods have been proposed for the determination of mercury, and much effort has been devoted to improving the limit of detection (LOD) of mercury, because this element is usually present in food and water samples at extremely low concentrations. Hinds3 developed a procedure to determine mercury in unrefined gold by flame and graphite furnace atomic absorption spectrometry (AAS). Grotti et al.4 refined a procedure for the simultaneous determination of arsenic, selenium, and mercury in foodstuffs by inductively coupled plasma-optical emission spectroscopy (ICP-OES). Pyhtilä et al.5 developed and optimized a method for the determination of low total mercury concentrations in humic-rich natural water samples using a cold vapor technique coupled to an inductively coupled plasma mass spectrometer (CV-ICP-MS). Hieftje's group6 developed a novel cold vapor generation method using solution cathode glow discharge (SCGD) coupled with ICP-OES in 2008. And then, He et al.7 used the novel SCGD induced vapor generation as an interface to on-line couple high-performance liquid chromatography (HPLC) with atomic fluorescence spectrometry (AFS) for the speciation of inorganic mercury, methyl–mercury, and ethyl–mercury. Furthermore, the analytical performance, including the figures of merit, of those methods have since been improved and developed.
Recently, laser-induced breakdown spectroscopy (LIBS) has aroused wide-ranging interest for its outstanding advantages, such as rapid analysis, minimal sample preparation, it being practically non-destructive, its operational simplicity, real-time analysis, and for the versatile sampling of solids, liquids, gases, and aerosols, over conventional spectrometric analytical methods.8 One of the most important applications of LIBS is the determination of trace amounts of heavy metals in water and food for environmental monitoring. Several achievements and improvements have been made in recent years, e.g., Srungaram et al.9 compared two potential spectroscopic methods (LIBS and spark-induced breakdown spectroscopy (SIBS)) under optimum experimental conditions for mercury monitoring. The LOD for mercury in soil was calculated using LIBS and SIBS as 483 ppm and 20 ppm, respectively. Sobral et al.10 investigated the detection sensitivity of trace Hg in water and ice samples by using laser-induced breakdown spectroscopy; the obtained LOD from the water and ice samples were of the order of 21.4 ppm and 3.7 ppm, respectively. Fang et al.11 directly and quantitatively compared two different sample presentation methods, namely plasma excitation within water bulk and on the surface in a water jet by LIBS, and the LOD of Hg obtained was in the order of 85 ppm. The main drawback of the LIBS as used for the determination of mercury in aqueous solution is its limited sensitivity, which is typically within the low numbers of the ppm range, thus better measurements are needed to improve the sensitivity and stability of this technique.
In the present work, a novel procedure for the determination of trace mercury in aqueous solution was developed based on LIBS. Dissolved mercury species were converted to volatile Hg vapor by SCGD to improve the sensitivity of the determination of Hg. In addition, the influences of the background electrolyte, discharge current, sample flow rate, and carrier gas flow rate were investigated and optimized. The LOD of this method was estimated by using the calibration curve of the Hg values plotted, based on the different concentration measurement results. The characteristic parameters of the plasma, including the electron temperature and electron number density, were investigated under different conditions, and it is shown that the local thermodynamic equilibrium (LTE) condition is fulfilled.
Experimental
Instrumental setup
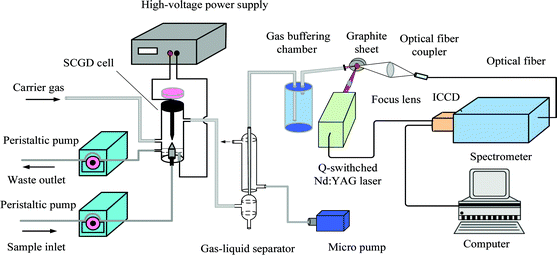
The experimental setup is shown in Fig. 1. The detection system was sustained in an open-to-air atmosphere, and consisted of three primary units: a solution cathode glow discharge mercury vapor generator, a gas–liquid separator (GLS), and LIBS equipment. A closed SCGD cell was constructed and developed. In this design, a tapered tungsten rod was used as the anode, while the solution was delivered through a customized quartz capillary with an internal diameter of 0.38 mm as the cathode, and the electrode gap of the discharge could be adjusted flexibly through a control knob. A high-voltage DC power supply (Yingkou High Power Research Institute, GYU-015A) was used to ignite the discharge under the protection of a power supply with a ceramic resistor (2.7 kΩ) used between the liquid anode and the positive output of the power supply. The sample solution was pumped into the cell via a peristaltic pump (Chongqing Jieheng Pump Co. Ltd, BT-100), and the portion of the solution not vaporized by the discharge was allowed to overflow into a polytetrafluoroethylene (PTFE) waste reservoir during discharge, with this overflow providing the electrical connection between the discharge and the solution in the reservoir. The waste solution was drain out to maintain a constant solution level in the waste reservoir, using the same peristaltic pump.When the Hg-containing sample was fed into the discharge cell, a volatile Hg vapor was produced. All the generated products issuing from the plasma were swept by an air stream controlled by a rotor flowmeter. In order to improve the Hg concentration, the air flow containing Hg was then introduced to a GLS. The GLS was of a condenser-based design, consisting of two concentric tubes, which was similar to that previously described.12 The water-cooled condenser was 200 mm (length) × 6 mm (i.d.) × 20 mm (o.d.). Coolant water at approximate 4 °C circulating in the condenser was used. The vapor was then transported to a sealed container (400 mL), to reduce fluctuations of the gas flow rate. Finally, the products were injected onto a graphite sheet through a 2 mm (i.d.) nozzle – where the graphite sheet was used to adsorb the mercury vapor and improve the efficiency of the laser ablation and then the LIBS equipment was used for detection. A Q-switched Nd:YAG laser (Quantel, Ultra 100), at a fundamental wavelength of 1064 nm with a pulse duration of 8 ns, a repetition rate of 20 Hz, and a maximum pulse energy of 100 mJ, was used as the excitation light source. The laser was focused on the surface of the graphite sheet by a 100 mm focal length plano-convex lens, to produce intense, transient plasma. The light emitted from the plasma was collected by an optical signal collection device composed of two quartz lens and transported by a 2 m long multimode silica optical fiber. The light signal was then transmitted to the entrance of a computerized Czerny–Turner spectrograph (Andor Model SR-750A). The spectrograph was equipped with three ruled gratings: 2400 grooves per mm, 1200 grooves per mm, and 300 grooves per mm, which could be changed according to the different demands under the control of a computer, and could provide high and low resolution spectra in the wavelength range of 200–1200 nm. A 2048 × 512 pixels intensified and gated CCD camera (Andor DH340T-18U-03) was attached to the output end of the spectrograph to detect the spectrally resolved lines. The ICCD camera was cooled to −15 °C by a Peltier cooler to reduce noise. The three-dimension translation stage was kept moving to ensure each fresh spot was ablated during the experiment.
Reagents and solutions
In this work, the purity of deionized water used throughout the experiment was 17.1 MΩ cm. Single element solutions of Hg were prepared by appropriate dilutions of stock Hg standard solution (1000 mg L−1) with this water. Superior-reagent grade HNO3, H2SO4, and HCl were purchased from Chongqing Chuandong Chemical Group Co., Ltd. These commercial products were used to investigate the effect of different background electrolytes on the oxidation of mercury.Stock solutions (1000 mg L−1) of Hg2+ were prepared by the dissolution of appropriate masses of mercuric chloride (99.5%). Moreover, all the sample solutions were prepared in dilute nitric acid, with the final PH adjusted to 1.0 after optimization.
Results and discussion
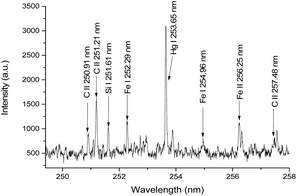
Fig. 2 depicts a typical emission spectrum of a liquid sample of HgCl2 recorded for 10 mg L−1 at the discharge current of 80 mA, a discharge voltage of 1200 V, and a sample flow rate of 8.7 mL min−1. Moreover, the optimal parameters of the LIBS were obtained by the sequential test method,13 and were 0.4 μs ICCD delay, 10 μs gate width, and 32 mJ laser pulse energy. As shown in Fig. 3, in the range from 248 nm to 258 nm, the spectral line of Hg I at 253.65 nm is the most outstanding among all the spectral lines, and therefore this line was selected for the qualitative and quantitative analyses for the subsequent experiments.In addition, the lines of C II at 250.91 nm, 251.21 nm, and 257.48 nm, and other impurities in the graphite sheet, such as Fe I at 252.29 nm and 254.96 nm and Fe II at 256.25 nm, and Si I at 251.61 nm were clearly resolved. The spectral information of the above lines for the qualitative and quantitative analysis was obtained from the NIST14 database. To obtain each spectrum, twenty pulses were accumulated, and five such spectra were measured for each experimental condition, in order to increase the sensitivity and reduce the standard deviation.
Effect of the acid anion
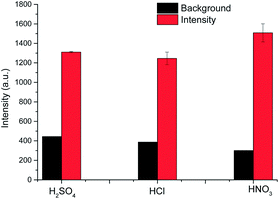
At the outset, the influences of the background electrolyte, discharge current, sample flow rate, and carrier gas flow rate on the emission intensity of mercury were studied, and then these were optimized to improve the detection sensitivity. According to previous literature, the background electrolyte can affect the Hg vapor generation efficiency15 and thus, it was essential to investigate the effect of the acid anion on the mercury vapor generation to sustain a highly effective discharge. Three mercury standard solutions (at a concentration of 10 mg L−1) were adjusted to a pH of 1.0 with the acids: sulfuric acid, hydrochloric acid, and nitric acid passed through them into the discharge system, respectively. The discharge voltage was kept constant at 1200 V for all the solutions. The solution flow rate and carrier gas flow rate were 8.7 mL min−1 and 300 mL min−1, respectively. It was observed that all of these acidic media could sustain the discharge stability and that mercury could be easily transformed into volatile mercury species by this device. The sensitivity was enhanced by different degrees over a conventional water jet LIBS. The different acid anions present had varied effects on the emission intensity due to the analyte, as shown in Fig. 3. The sample acidized by HNO3 resulted in the greatest intensity and lowest background emission, with the order of signal intensity enhancement being HNO3 > H2SO4 > HCl. In addition, nitric acid is the preferred reagent for the digestion of samples and has the greatest chemical compatibility. Accordingly, nitric acid (pH = 1) was selected as the acidic medium for our subsequent experiments.Effect of discharge current
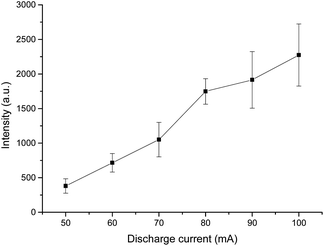
The influence of the discharge current on stable operation and the vapor generation efficiency was also evaluated to obtain the greatest sensitivity of the emission intensity. We adjusted the discharge current from 40 mA to 110 mA, but other parameters of the detection system were kept the same as before. The variation of the emission intensity of Hg I at 253.65 nm with different discharge currents is illustrated in Fig. 4. The results clearly show that the intensity of the Hg atomic emission becomes stronger with increasing the discharge current, which indicates that the vapor generation efficiency of Hg increase with the increasing discharge currents. This may be a consequence of the high discharge power enhancing both the reduction and volatilization efficiencies. However, when the current is great enough, excessive heating of the anode takes place and the temperature rises to an extremely high level, at which point the discharge plasma becomes unstable, and worse of all, becomes more energy-consuming. Taking all the above factors above consideration, a discharge current of 80 mA was employed in the remaining parts of the experiment.Effect of sample flow rate
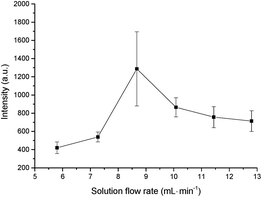
In order to improve the efficiency of determination and to reduce the sample consumption, the effect of the solution flow rate on the signal was evaluated in the range of 5.8–12.8 mL min−1 (Fig. 5). The flow liquid cathode was the Hg solution of 10 mg L−1, and the flow rate of air used to carry the Hg vapor sample was 300 mL min−1. An increase in the flow rate of the liquid cathode solution was also exhibited. The greatest signal was obtained by using the liquid flow rate of 8.7 mL min−1. The atomic emission intensity increased with the liquid flow rate from 5.8 to 8.7 mL min−1, mainly because of the greater amount of analyte entering the discharge. When the flow rate was too low (<5.8 mL min−1), the discharge was unstable and was easy to extinguish. However, it was found that too high a solution flow rate resulted in a lower signal of Hg emission. This might be caused by the changing of the SCGD plasma, which decreased the Hg vapor generation efficiency. Additionally, the increased water vapor pressure at high flow rates may also cool the laser-induced plasma. The stability of the signal at a liquid flow rate of 8.7 mL min−1 seemed to be worse than at the other flow rates, which may due to the transition of the liquid flow rate from 7.27 to 8.7 mL min−1; while from the signal intensity trend, the highest signal was obtained at the liquid flow rate of 8.7 mL min−1. Based on these results, the flow rate of 8.7 mL min−1 was selected for use in the following experiments.Effect of carrier gas flow rate
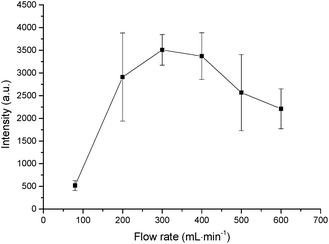
To enable the experimental system's universality and simplify the detection device, air was used as the carrier gas during the whole experiment. The influence of the flow rates of the carrier gas were investigated in the range of 80–600 mL min−1 on the basis of the spectral intensity from a 10 mg L−1 Hg solution. The volatile mercury species produced in the SCGD were transported to the LIBS equipment for determination with the carrier gas. The variation of the signal intensity as a function of carrier gas flow rate is shown in Fig. 6. It can be observed that emission intensity increases to the highest signal level with increasing the carrier gas flow rate and decreases afterwards, with the highest signal being obtained at the carrier gas flow rate of 300 mL min−1. Accordingly, a flow rate of 300 mL min−1 was employed in the remaining part of the experiment (Fig. 6).Calibration curve and the limit of detection
In the LIBS method, a calibration curve is the most widely used technology for quantitative analysis. For construction of the calibration curve, we prepared several standard solutions with different concentrations through dissolving HgCl2 in known volumes of de-ionized water. Aqueous solutions with different concentrations ranging from 100 μg L−1 to 10 mg L−1 were prepared, and the resulting calibration curve is shown in Fig. 7.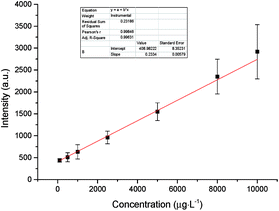 | ||
| Fig. 7 Experimental calibration curve of the emission intensity of Hg I at 253.65 nm versus Hg concentration. | ||
The LOD is defined as the lowest concentration that can be detected and is evaluated by:16
 | (1) |
Compared with other studies into the determination of mercury based on LIBS technology, our work has improved the sensitivity to some extent. The comparison between this work and resent results is summarized in Table 1.
| Detection methods | Species | Wavelength (nm) | LOD (ppm) |
|---|---|---|---|
| SCGD-LIBS (this work) | Hg I | 253.65 | 0.36 |
| Single LIBS (liquid sample)10 | Hg I | 253.65 | 21.4 |
| Single LIBS (evaporated in a carbon planchet)17 | Hg I | 253.65 | 10 |
| Single LIBS (water jet)11 | Hg I | 253.65 | 85 |
| Single LIBS and SIBS (soil sample)9 | Hg I | 546.07 | 483 |
| 20 | |||
| OEDP-LIBS18 | Hg I | 253.65 | 0.3 |
Measurements of the electron temperature and electron number density
Since the sample was converted to the gas phase from aqueous solution, and as we then used the LIBS to detect the toxic metal Hg, it was necessary to know the properties (electron temperature and electron number density) of the laser induced mercury vapor plasma. Moreover, the quantitative analysis of this experiment was based on the assumption of a local thermodynamic equilibrium (LTE), thus it is essential to show the validity of this assumption, in the following subsections, and hence we discuss the electron temperature, electron number density and LTE.The plasma parameters represent the most fundamental physical quantities, whose knowledge is useful for characterization of the plasma and its efficient use for analytical purposes.19 Electron temperature (T) is one of the most important properties of any excitation source, and its determination is important to understand the dissociation, ionization and excitation process taking place in the plasma.20 Two methods were applied to determine T, namely the Boltzmann plot method and the line pair ratio method from the relative intensities of the observed lines. The result obtained through the Boltzmann plot method is more accurate than the line pair ratio, due to it using more spectral lines to extract T. Therefore, the Boltzmann plot method was selected to determine the electron temperature in this work. Assuming that LTE is established within the plasma, the population in different levels is governed by a Boltzmann distribution. The following relationship was thus used to extract the electron temperature.21
 | (2) |
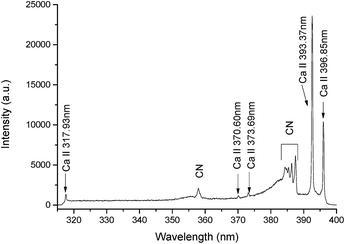
In this work, the gate width of the ICCD was 200 ns and the laser pulse energy was 32 mJ. The other spectral lines i.e., C I, Ca II, and Ca I were also significant. The spectral lines of Ca II at 317.93 nm, Ca II at 370.60 nm, Ca II at 373.69 nm, Ca II at 393.37 nm, and Ca II at 396.85 nm were selected to extract the electron temperature. The LIBS spectrum of plasma in the range of 315–400 nm containing the lines of Ca II is illustrated in Fig. 8. The measured intensities of the spectral lines and the other spectroscopic data, such as wavelength (λ), statistical weight (g), transition probability (A), and term energy (E), are listed in Table 2.
| Sr. no. | Wavelength λ (nm) | Transitions | Statistical weight gk | Transition probability Aki (s−1) | Energy (eV) | |
|---|---|---|---|---|---|---|
| E k | E i | |||||
| 1 | 317.93 | 3p64d2D3/2 → 3p64p2P01/2 | 6 | 3.6 × 10⁸ | 7.049150 | 3.150984 |
| 2 | 370.60 | 3p65s2S1/2 → 3p64p2P01/2 | 2 | 8.8 × 10⁸ | 6.467875 | 3.123349 |
| 3 | 373.69 | 3p65s2S1/2 → 3p64p2P03/2 | 2 | 1.7 ×10⁸ | 6.467875 | 3.150984 |
| 4 | 393.37 | 3p64p2P03/2 → 3p64s2S1/2 | 4 | 1.47 ×10⁸ | 3.150984 | 0 |
| 5 | 396.85 | 3p64p2P01/2 → 3p64s2S1/2 | 2 | 1.4 × 10⁸ | 3.123349 | 0 |
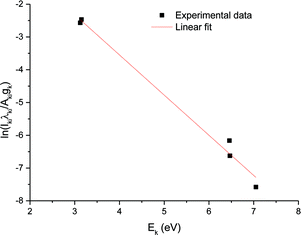
Fig. 9 shows the Boltzmann plot obtained from the Ca ionic lines, where the curved slope yields the electron temperature. The electron temperatures obtained as a function of the ICCD delay time can be calculated from the slopes of the corresponding Boltzmann's plots; the result is illustrated in Fig. 10. As can be seen, the electron temperature decreases with the ICCD delay time from about 10![[thin space (1/6-em)]](https://www.rsc.org/images/entities/char_2009.gif) 900 K to 8800 K, with the delay time ranging from 200 ns to 6 μs.
900 K to 8800 K, with the delay time ranging from 200 ns to 6 μs.
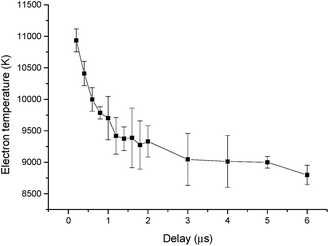 | ||
| Fig. 10 Temporal behavior of electron temperature with Hg(II) solution at a concentration of 10 mg L−1. | ||
During the evolution of the laser induced plasma, excitation and ionization of the evaporated material occur. The electron number density is a crucial parameter for determining the elemental composition. In fact, there are two main line broadening mechanisms in laser induced plasma, i.e., Stark broadening and Doppler broadening. At a high plasma density, Stark broadening induced by collision with charged particles dominates. One of the most reliable techniques to determine the electron number density is from the measured Stark-broadened line profile of an isolated line of either a neutral atom or a single charged ion. The full width at half maximum (FWHM) Δλ1/2 of a line is given by the following relationship:21
 | (3) |
 | (4) |
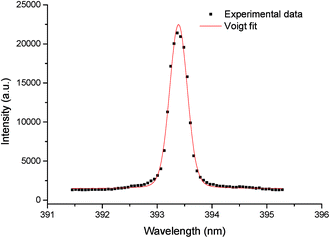
In this work, the electron number density (Ne) was calculated by the measurement of the FWHM of the Stark-broadened Voigt line shape of the ionic line (393.37 nm) of Ca II (see Fig. 11). The value of ω corresponding to the different electron temperatures can be obtained from the reference data.22
The temporal behavior of the electron number density obtained from the Ca II at 393.37 nm is shown in Fig. 12. As Fig. 12 shows, the electron number density of the plasma is in the order of 1018 cm−3, and it decreases with ICCD delay time to 1017 cm−3, due to the recombination of free electrons and ions.
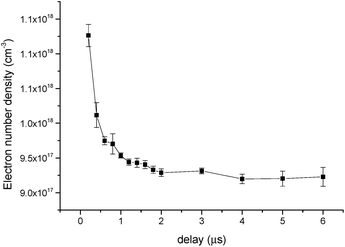 | ||
| Fig. 12 Temporal behavior of the electron number density with Hg(II) solution at a concentration of 10 mg L−1. | ||
The use of the emission spectroscopy for the determination of the electron temperature and electron number density requires optically thin spectral lines. The self-absorption depends on the oscillator strength, the level energy degeneracy, the broadening parameters, and also on the plasma parameters.23 The laser induced plasma was observed to be optically thin, as in case of self-absorption, a strong line will appear to have a dip in the central frequency (i.e., due to self-absorption).22 In the present work, we did not find any dip in the central frequency of the observed emission lines. As it was assumed in our experiment that the plasma is described by the local thermodynamic equilibrium (LTE), the necessary condition for LTE to give the corresponding lower limit of the electron density Ne is given by McWhirter criterion:24
| Ne ≥ 1.6 × 10¹²T1/2(ΔE)3 | (5) |
![[thin space (1/6-em)]](https://www.rsc.org/images/entities/char_2009.gif) 900 K, and ΔE = 3.8986 eV. The lower limit given by eqn (5) is 9.9 × 1016 cm−3, while the electron number density in our work was in the order of 1017 and 1018 cm−3. Therefore, the assumption of LTE was demonstrated.
900 K, and ΔE = 3.8986 eV. The lower limit given by eqn (5) is 9.9 × 1016 cm−3, while the electron number density in our work was in the order of 1017 and 1018 cm−3. Therefore, the assumption of LTE was demonstrated.
Conclusions
An analysis of the toxic metal of mercury in an aqueous solution of HgCl2 was carried out by laser-induced breakdown spectroscopy with the assistance of a solution cathode glow discharge. The liquid sample was converted to the gas phase through a high voltage DC discharge, and then the generated mercury vapor was concentrated by GLS. Finally, a 1064 nm wavelength Nd:YAG laser was used as an excitation source to ignite the plasma, and a high resolution Czerny–Turner spectrometer and ICCD detector were used for the spectral separation and detection. The characteristic spectral line of Hg I at 253.65 nm was selected for analysis, under the optimal conditions of LIBS, where the optimal and proper acidification reagent, discharge current, sample flow rate and carrier gas flow rate were determined through investigation. The analytical performances of this method were evaluated under optimized conditions, and a calibration curve of Hg was plotted based on the different concentration measurement results, from which the LOD of Hg was calculated to be 0.36 mg L−1. Moreover, the temporal behavior of the electron temperature and electron number density were investigated, and the results show that the electron temperature decreases from about 10![[thin space (1/6-em)]](https://www.rsc.org/images/entities/char_2009.gif) 900 K to 8800 K with the delay time from 200 ns to 6 μs, and the electron number density was found to be in the orders of 1017 and 1018 cm−3, which then decrease with increased delay time, due to the recombination of free electrons with the ions. By this experimental configuration, the detection limit and sensitivity of Hg could be improved to some extent. This method provides an alternative analytical method for the measurement of trace mercury in water.
900 K to 8800 K with the delay time from 200 ns to 6 μs, and the electron number density was found to be in the orders of 1017 and 1018 cm−3, which then decrease with increased delay time, due to the recombination of free electrons with the ions. By this experimental configuration, the detection limit and sensitivity of Hg could be improved to some extent. This method provides an alternative analytical method for the measurement of trace mercury in water.
Acknowledgements
This work was financially supported by the National Natural Science Foundation of China (61205149), Scientific and Technological Talents Training Project of Chongqing (CSTC2013kjrc-qnrc40002), 2013 Program for Innovation Team Building at Institutions of Higher Education in Chongqing (The Innovation Team of Smart Medical System and Key Technology), and Scientific and Technological Project of Nan'an District.Notes and references
- Z. Wang, Y. Deguchi, M. Kuwahara, X. Zheng, J. Yan and J. Liu, Jpn. J. Appl. Phys., 2013, 52, 11NC05(1)–11NC05(6) Search PubMed.
- S. Mostafalou and M. Abdollahi, Arch. Ind. Hyg. Toxicol., 2013, 64, 179–181 CAS.
- M. W. Hinds, Spectrochim. Acta, Part B, 1998, 53, 1063–1068 CrossRef.
- M. Grotti, C. Lagomarsino and E. Magi, Ann. Chim., 2006, 96, 751–764 CrossRef CAS.
- H. Pyhtilä, P. Perämäki, J. Piispanen, M. Niemelä, T. Suoranta, M. Starr, T. Nieminen, M. Kantola and L. Ukonmaanaho, Microchem. J., 2012, 103, 165–169 CrossRef PubMed.
- Z. Zhu, G. C. Y. Chan, S. J. Ray, X. Zhang and G. M. Hieftje, Anal. Chem., 2008, 80, 7043–7050 CrossRef CAS PubMed.
- Q. He, Z. Zhu, S. Hu and L. Jin, J. Chromatogr. A, 2011, 1218, 4462–4467 CrossRef CAS PubMed.
- P. Zheng, H. Liu, J. Wang, B. Yu, B. Zhang, R. Yang and X. Wang, Anal. Methods, 2014, 6, 2163–2169 RSC.
- P. K. Srungaram, K. K. Ayyalasomayajula, F. Yu-Yueh and J. P. Singh, Spectrochim. Acta, Part B, 2013, 87, 108–113 CrossRef CAS PubMed.
- H. Sobral, R. Sanginés and A. Trujillo-Vázquez, Spectrochim. Acta, Part B, 2012, 78, 62–66 CrossRef CAS PubMed.
- X. Fang and S. Rafi Ahmad, Appl. Spectrosc., 2007, 61, 1021–1024 CrossRef CAS.
- Z. Zhu, C. Huang, Q. He, Q. Xiao, Z. Liu, S. Zhang and S. Hu, Talanta, 2013, 106, 133–136 CrossRef CAS PubMed.
- P. Zheng, H. Liu, J. Wang, K. Liu, Y. Dai, B. Yu, B. Zhang, R. Yang and X. Wang, High Power Laser Part. Beams, 2013, 25, 2729–2733 CrossRef.
- http://physics.nist.gov/PhysRefData/ASD/lines_form.html .
- Z. Zhu, Q. He, Q. Shuai, H. Zheng and S. Hu, J. Anal. At. Spectrom., 2010, 25, 1390–1394 RSC.
- M. Sabsabi and P. Cielo, Appl. Spectrosc., 1995, 49, 499–507 CrossRef CAS.
- R. L. V. Wal, T. M. Ticich, J. R. West and P. A. Householder, Appl. Spectrosc., 1999, 53, 1226–1236 CrossRef.
- Q. Zhang, W. Xiong, Y. Chen and R. Li, Spectrosc. Spectral Anal., 2011, 31, 521–524 CAS.
- A. A. I. Khalilm, Opt. Laser Technol., 2013, 45, 443–452 CrossRef PubMed.
- M. Hanif, M. Salik and M. A. Baig, J. Mod. Phys., 2012, 3, 1663–1669 CrossRef.
- M. Hanif, M. Salik and M. A. Baig, Opt. Spectrosc., 2013, 114, 7–14 CrossRef CAS.
- H. R. Griem, Plasma spectroscopy, McGraw-Hill, New York, 1964 Search PubMed.
- M. Hanif, M. Salik and M. A. Baig, Plasma Sci. Technol., 2011, 13, 129–134 CrossRef CAS.
- R. W. P. McWhirter, R. H. Huddlestone and S. L. Leonard, Plasma diagnostic techniques, Academic, New York, 1965 Search PubMed.
| This journal is © The Royal Society of Chemistry 2015 |

